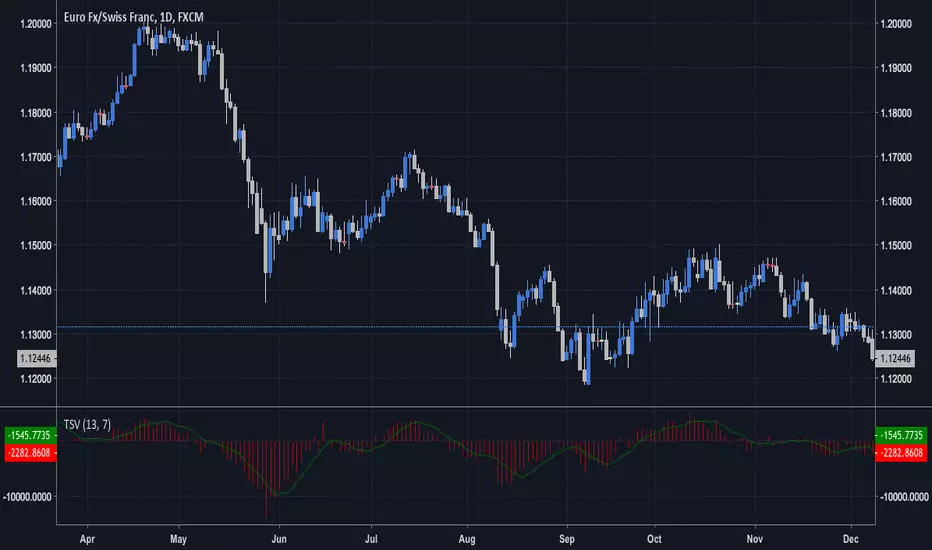
Time Segmented VolumeCorrected version of the Time Segmented Volume indicator (TSV).
The previous version contained a severe bug.
The due credits are in the comment section of the code.
חפש סקריפטים עבור "N+credit最新动态"
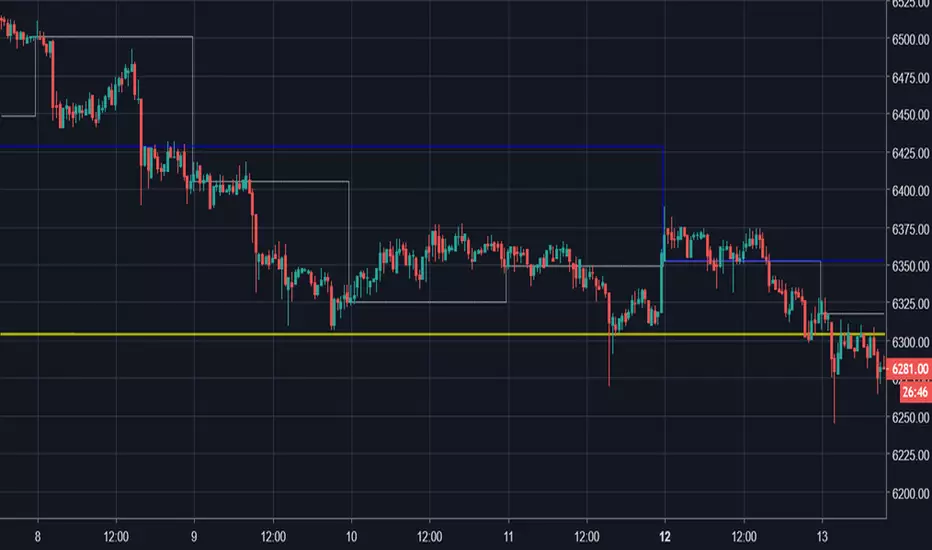
Open High Low HTFModification of TraderX0's script, all credits go to him. I simply modified it so it also includes the weekly and monthly options.
Useful for establishing bias on lower timeframes.
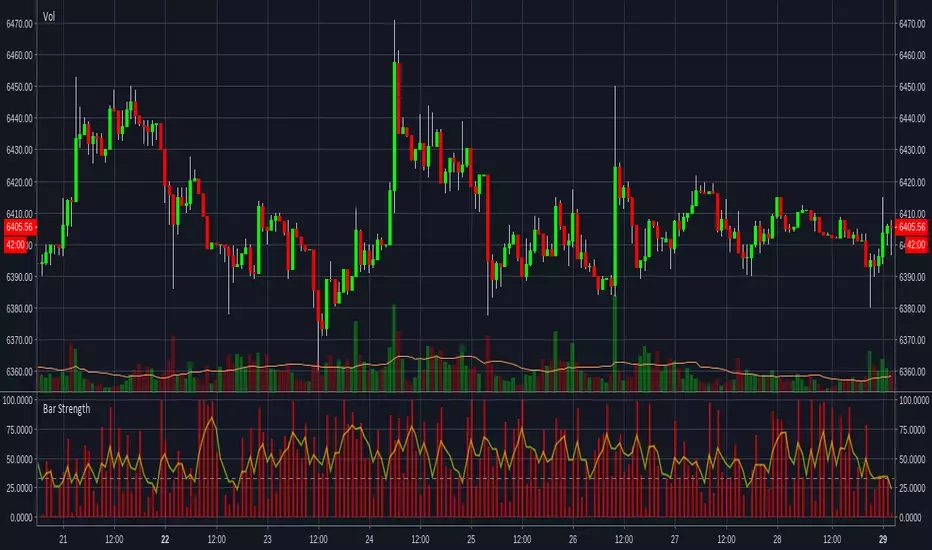
Bar Strength IndicatorIndicator to measure the size of the candle body against the whole candle including the wicks. More information can be found here www.fxstreet.com
This indidactor is based on Marco Mayers article. All credits go to him.
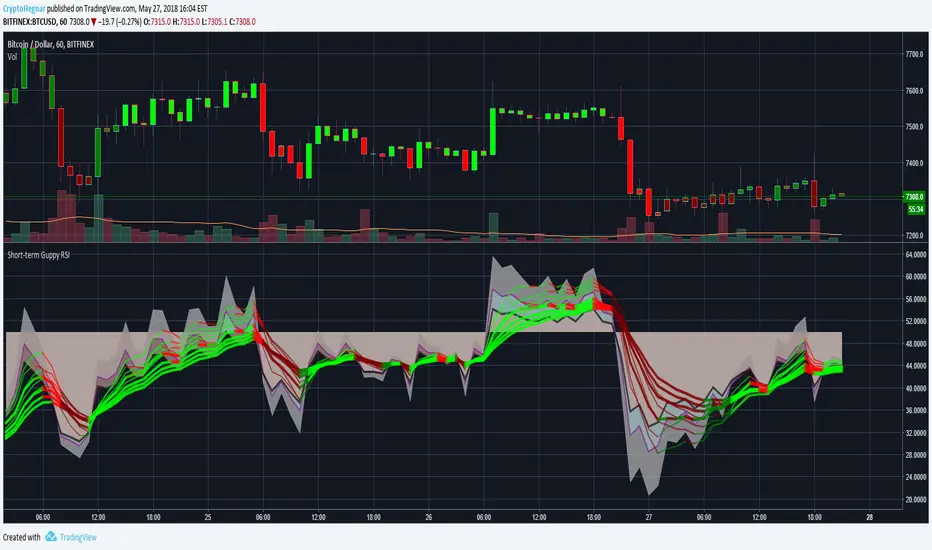
Triple RSIability to plot up to 3 rsi on one indicator. added the 50%, mid line. all credits go to Chris Moody

MTF stochastic strategyThis strategy is based on MTF strategy found on Forex Factory forum and published by bobby2 (credits to him).
This is quite simple but need improvement to work properly:
1- it is made for 5 min chart
2- when 15min stochastic cross above 50 and 5min stochastic is rising, buy
3- when 15min stochastic cross below 50 and 5min stochastic is falling, sell

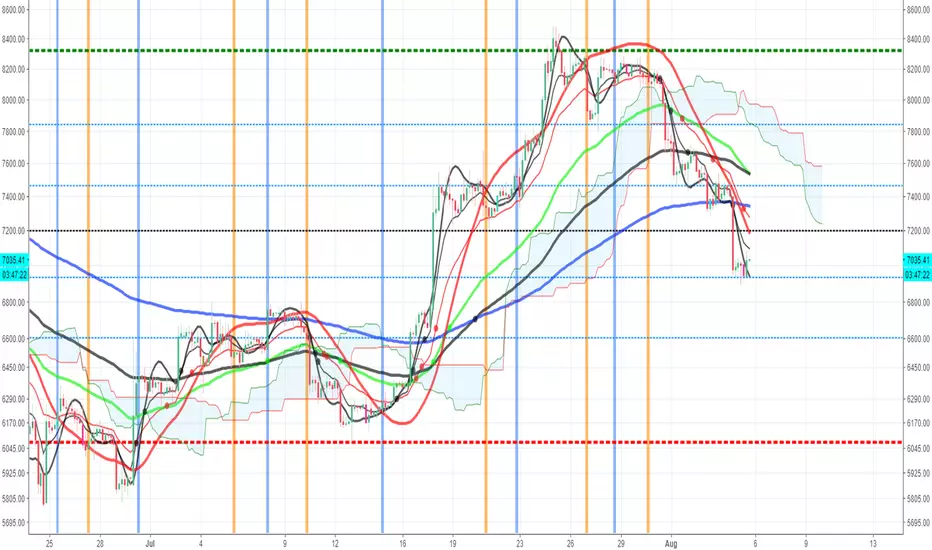
Uncle Mo's Ultimate Ichimoku V1Main features:
2 x Ichimoku Cloud
5 x EMA
2 x MA
1 x HullMA
Williams Fractals
Study is based around trader @br0qn 's Ichimoku script.
Credits also go to:
@RicardoSantos for the Bill Williams Fractals
@EmilianoMesa for the EMAs/MAs
@mohamed982 for the HullMA
The script is open source so please feel free to change it around. I'd greatly appreciate it if you could suggest ways to improve it.
Happy trading!

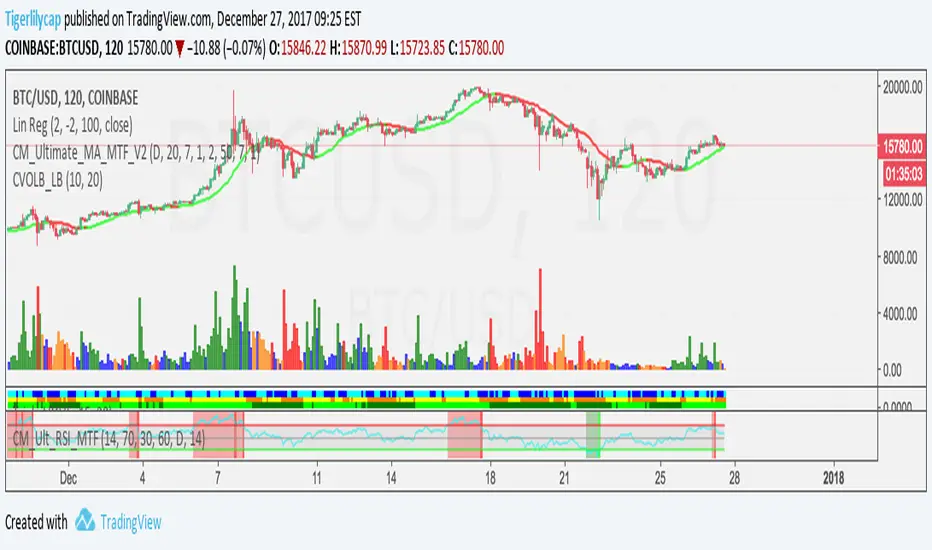
CM_Ultimate_MA_MTF_V3 GUNBOTWork in progress... Added new MAs with variable smoothing... EhlersSuperSmoother, EhlersEmaSmoother, xema. Added additional alerts for gunbot or similar cryptobots. Couldn't find the original author of the new MAs, so if you are, drop me a line for credit.

Slow Stochastic + ADX exhaustationSlow stochastic with ADX exhaustation and sell/entry points as orange/green circles.
This is a script I remade from Marco Valente's "RSI Combo" and Oshri17 "Slow stochastic".
Credits and thanks to them for sharing, I just expanded the diversity ^^
Hope you enjoy phit! ;D
Stochastic RSI with DivergencesTook my other Log RSI script and plugged in Stochastic RSI to see how divergences play on an oscillator with two lines. Turns out divergences are good at predicting changes in the oscillator but that doesn't mean that the oscillator will always mimic price action.
Log vs. no log is virtually the same.
Credits to
@fskrypt for introducing geometric mean
Divergences by @RicardoSantos (@JustUncleL's edit)

Trading ComboThis is a combo of many indicators including :
Ichimoku Cloud(With Buy and Sell Signals)
EMA
MA
HULL MA
Fibonacci Lines
Bitcoin Kill Zones(Turned off by Default)
MA Turning Points
Reversal(Pin) Bars and Upshaved and Downshaved Bars(Inside and Outside Bars Disabled By default)
Credits to for the source code:
Lazybear
ChrisMoody
100kiwi
Gesundheit
oenbot BB Buying OpportunitiesThis is my first attempt to emulate the eonbot BB strategy (github.com).
Definitely a beta version, need to work out why false positives, and stop buy/sells after previous buy/sell.
In the wiki page example of eonbot it refers to 75%, in this script enter the converse ... 25% and it should plot accurately.
If you are not familiar with eonbot check out the wiki & github sites : github.com
credits to: www.tradingview.com for the trending components

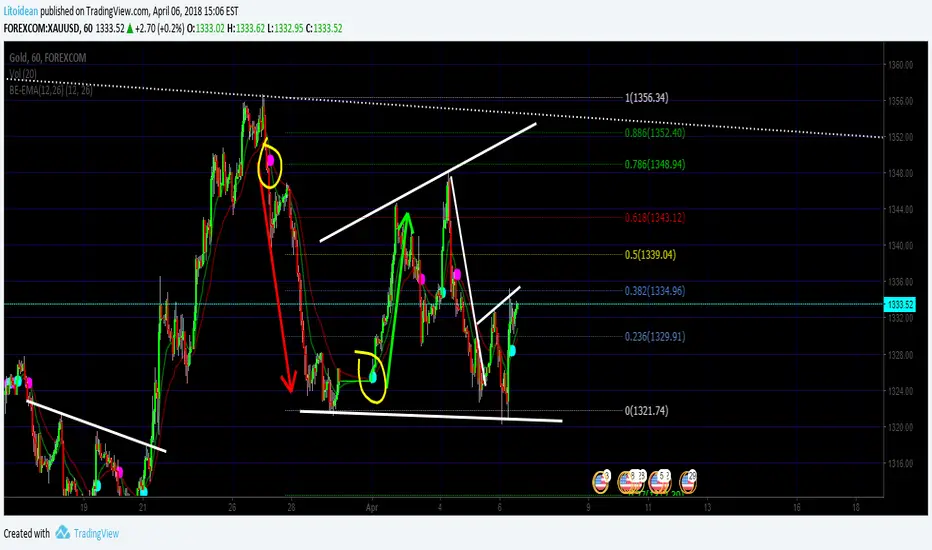
BE-EMA(12,26) (Blue Empire Exponential Moving Average)
Simple EMA where you get a CROSS mark between EMA 12 and EMA 26.
Each time a cross happens, a spot gets created.
If it's cyan, it goes up.
If it's magenta, it goes down.
I'm studying Trading at Blue Empire Academy, if you want to know more send me a PM.
Wave Analysis study the wave's behavior and tries to predict by using trendlines, elliot waves, fibonacci retracements, and EMAs basically.
In this Indicator, It's a confirmation when EMA 12 goes over to confirm the price may go up. and Vice versa.
Hope you like, please share if you think it's useful and comment if you think this can be better.
Thank you again for reading
>> This is just an indicator, it doesn't predict the future. Use it at your own risk. <<
##########
All the credits to @tracks, a genius who helped me polish the code. :] thank you.
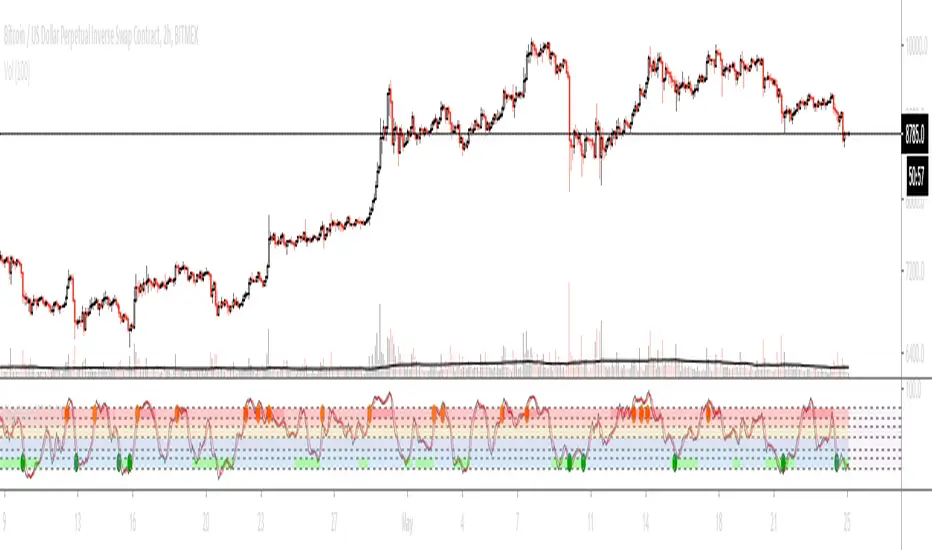
RSI / Stoch / Stoch RSI (SRSI) Overlay [SigmaDraconis]One indicator combining RSI, Stochastic Oscillator and Stochastic RSI in one.
Credits for rwhiteside and his RSI / Stoch RSI Overlay indicator who served as inspiration to all three.
I believe this will be very useful to a lot of people.
If you like, use and i prove to be , you can contribute to my
TIP JAR :

Colored Volume Bars [LazyBear] with overlayDivs and candle alignment a little easier to see - volume/2 to size correctly - could still use some refining
All credits to LazyBear for his color volume bar source code
SiL Ghanti by BHAJANPREETSiL ALERT by Bhajanpreet
fully working
credits - Arnab from Kolkata for introducing and helping me with this project!! :)

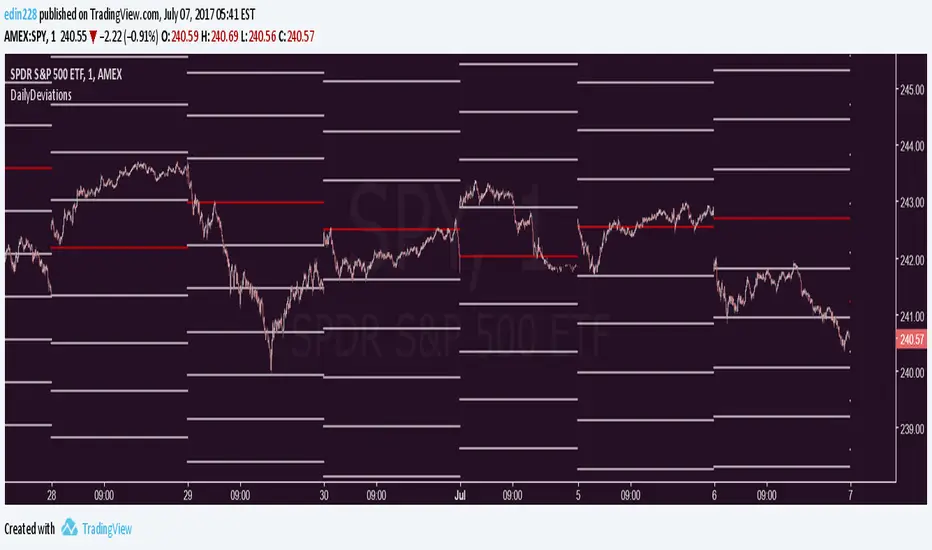
Daily Deviations Version 3Version 3 of Daily Deviations
Combines Lazy and Self Input version
HOW TO USE:
Select volatility index related to ticker. (Ex. Using SPY? Select VIX. Using QQQ? Select VXN. etc)
OR
Uncheck other volatility options and select "Use Custom Volatility" and input your own volatility.
Default setting is to use the previous close price as the "0 Level".
OR
Uncheck "Use Close Price" to enable a synthetic settlement price that is made by using the average of the daily open and close.
OR
Uncheck "Use Close Price" and select "Use Custom Settlement" and input your own settlement price.
Mess around and find the settings that you like the most.
Credits to /u/Living_Granger and /u/UberBotMan for the formulas and idea.
FuturesVsSpotShows the difference between Futures and Spot.
- Credits go to Josh Olszewicz / someone in whaleclub ts

Ehlers Optimal Tracking FilterThe original script was posted on ProRealCode by user Nicolas.
Dr. R.E. Kalman introduced his concept of optimum estimation in 1960. Since that time, his technique has proven to be a powerful and practical tool. The approach is particularly well suited for optimizing the performance of modern terrestrial and space navigation systems. Many traders not directly involved in system analysis have heard about Kalman filtering and have expressed an interest in learning more about it for market applications. Although attempts have been made to provide simple, intuitive explanations, none has been completely successful. Almost without exception, descriptions have become mired in the jargon and state-space notation of the “cult”.
Surprisingly, in spite of the obscure-looking mathematics (the most impenetrable of which can be found in Dr. Kalman’s original paper), Kalman filtering is a fairly direct and simple concept. In the spirit of being pragmatic, we will not deal with the full-blown matrix equations in this description and we will be less than rigorous in the application to trading. Rigorous application requires knowledge of the probability distributions of the statistics. Nonetheless we end with practically useful results. We will depart from the classical approach by working backwards from Exponential Moving Averages. In this process, we introduce a way to create a nearly zero lag moving average. From there, we will use the concept of a Tracking Index that optimizes the filter tracking for the given uncertainty in price movement and the uncertainty in our ability to measure it.
Credits to: www.prorealcode.com

Waddah Attar Explosion by ShizaruThe original script was posted on ProRealCode by user Nicolas.
The Waddah Attar explosion indicator is a well known indi in the forex community all over the web. It measures the price volatility "explosion" with the help of a difference between upper and lower bollinger bands (also known as "squeeze") and its direction and with a slow MACD advance or decline weighted with a coefficient (sensitivity=150).
A "deadzone" of x pips/points is at 20 points by default, but should be adjusted to the traded instrument.
If green or red oscillator histogram breach the "Explosion Line" above the dead zone, it's a signal.
This indicator act pretty much as a scalper in lower timeframe, but I found it useful with different timeframe comparison in higher ones in the past (M30/H1/H4).
Credits to www.prorealcode.com

Butterworth Filter by ShizaruThe original script was posted on ProRealCode by user StefanoCG.
Butterworth Filter (called also "maximally flat") is one of the simplest electronic filter. Its purpose is to obtain a frequency response of the flat as possible in the passband. Applied to the retail price index aims to filter out the "noise" and give you an indication on the direction of the more readable price.
Credits to: www.prorealcode.com

DSS Bresser Scalper Improved by ShizaruThe original script was posted on ProRealCode by user Nicolas.
This indicator is derived from Bressert's works in market cycles (Double Smooth Stochastic). It is converted from MT4 code and it is a part of a complete trading strategy of scalping, I certainly post on forums soon.
The DSS indicator is intended to spot overbought and oversold areas with less false signals than any other stochastic indicator. When the oscillator remains longer into one of the area, it is the beginning of a trend change.
I found it useful to spot price rebound while in a already formed trend. Of course, because stochastic is most used to find price reversal over a calculated price center, this indicator can also be nicely used in ranging markets.
Credits to: www.prorealcode.com

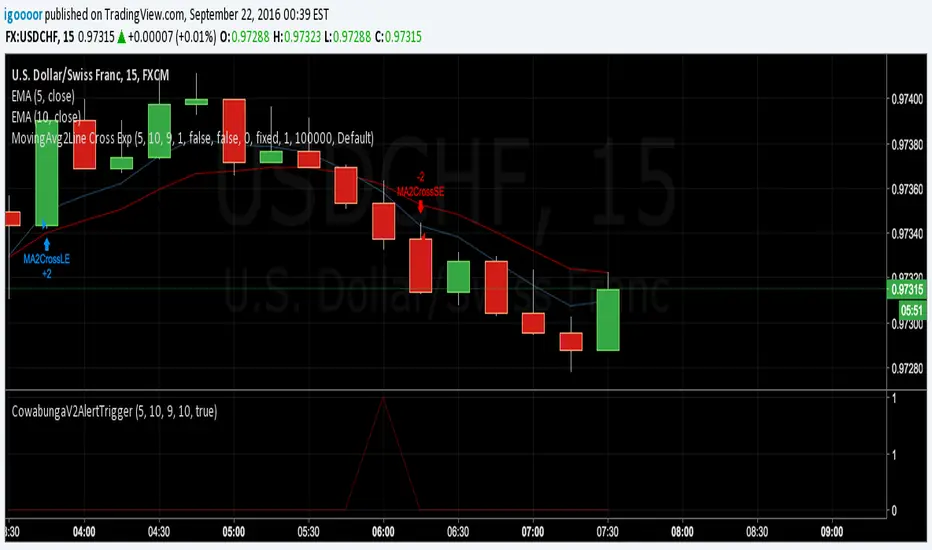
Cowabunga V2 Alert TriggerRefer to forums.babypips.com
This is the converison from mql4 files, credits goes to original poster.