Dual_MACD_trendingINFO:
This indicator is useful for trending assets, as my preference is for low-frequency trading, thus using BTCUSD on 1D/1W chart
In the current implementation I find two possible use cases for the indicator:
- as a stand-alone indicator on the chart which can also fire alerts that can help to determine if we want to manually enter/exit trades based on the signals from it (1D/1W is good for non-automated trading)
- can be used to connect to the Signal input of the TTS (TempalteTradingStrategy) by jason5480 in order to backtest it, thus effectively turning it into a strategy (instructions below in TTS CONNECTIVITY section)
Trading period can be selected from the indicator itself to limit to more interesting periods.
Arrow indications are drawn on the chart to indicate the trading conditions met in the script - light green for HTF crossover, dark green for LTF crossover and orange for LTF crossunder.
Note that the indicator performs best in trending assets and markets, and it is advisable to use additional indicators to filter the trading conditions when market/asset is expected to move sideways.
DETAILS:
It uses a couple of MACD indicators - one from the current timeframe and one from a higher timeframe, as the crossover/crossunder cases of the MACD line and the signal line indicate the potential entry/exit points.
The strategy has the following flow:
- If the weekly MACD is positive (MACD line is over the signal line) we have a trading window.
- If we have a trading window, we buy when the daily macd line crosses AND closes above the signal line.
- If we are in a position, we await the daily MACD to cross AND close under the signal line, and only then place a stop loss under the wick of that closing candle.
The user can select both the higher (HTF) and lower (LTF) timeframes. Preferably the lower timeframe should be the one that the Chart is on for better visualization.
If one to decide to use the indicator as a strategy, it implements the following buy and sell criterias, which are feed to the TTS, but can be also manually managed via adding alerts from this indicator.
Since usually the LTF is preceeding the crossover compared to the HTF, then my interpretation of the strategy and flow that it follows is allowing two different ways to enter a trade:
- crossover (and bar close) of the macd over the signal line in the HIGH TIMEFRAME (no need to look at the LOWER TIMEFRMAE)
- crossover (and bar close) of the macd over the signal line in the LOW TIMEFRAME, as in this case we need to check also that the macd line is over the signal line for the HIGH TIMEFRAME as well (like a regime filter)
The exit of the trade is based on the lower timeframe MACD only, as we create a stop loss equal to the lower wick of the bar, once the macd line crosses below the signal line on that timeframe
SETTINGS:
All of the indicator's settings are for the vanilla/general case.
User can set all of the MACD parameters for both the higher and lower (current) timeframes, currently left to default of the MACD stand-alone indicator itself.
The start-end date is a time filter that can be extermely usefull when backtesting different time periods.
TTS SETTINGS (NEEDED IF USED TO BACKTEST WITH TTS)
The TempalteTradingStrategy is a strategy script developed in Pine by jason5480, which I recommend for quick turn-around of testing different ideas on a proven and tested framework
I cannot give enough credit to the developer for the efforts put in building of the infrastructure, so I advice everyone that wants to use it first to get familiar with the concept and by checking
by checking jason5480's profile www.tradingview.com
The TTS itself is extremely functional and have a lot of properties, so its functionality is beyond the scope of the current script -
Again, I strongly recommend to be thoroughly epxlored by everyone that plans on using it.
In the nutshell it is a script that can be feed with buy/sell signals from an external indicator script and based on many configuration options it can determine how to execute the trades.
The TTS has many settings that can be applied, so below I will cover only the ones that differ from the default ones, at least according to my testing - do your own research, you may find something even better :)
The current/latest version that I've been using as of writing and testing this script is TTSv48
Settings which differ from the default ones:
- from - False (time filter is from the indicator script itself)
- Deal Conditions Mode - External (take enter/exit conditions from an external script)
- 🔌Signal 🛈➡ - Dual_MACD: 🔌Signal to TTSv48 (this is the output from the indicator script, according to the TTS convention)
- Sat/Sun - true (for crypto, in order to trade 24/7)
- Order Type - STOP (perform stop order)
- Distance Method - HHLL (HigherHighLowerLow - in order to set the SL according to the strategy definition from above)
The next are just personal preferenes, you can feel free to experiment according to your trading style
- Take Profit Targets - 0 (either 100% in or out, no incremental stepping in or out of positions)
- Dist Mul|Len Long/Short- 10 (make sure that we don't close on profitable trades by any reason)
- Quantity Method - EQUITY (personal backtesting preference is to consider each backtest as a separate portfolio, so determine the position size by 100% of the allocated equity size)
- Equity % - 100 (note above)
EXAMPLES:
If used as a stand-alone indicator, the green arrows on the bottom will represent:
- light green - MACD line crossover signal line in the HTF
- darker green - MACD line crossover signal line in the LTF
- orange - MACD line crossunder signal line in the LTF
I recommend enabling the alerts from the script to cover those cases.
If used as an input to the TTS, we'll get more decorations on the chart from the TTS itself.
In the example below we open a trade on the next day of LTF crossover, then a few days later a crossunder in the LTF occurs, so we set a SL at the low of the wick of this day. Few days later the price doesn't recover and hits that SL, so the position is closed.
חפש סקריפטים עבור "N+credit最新动态"

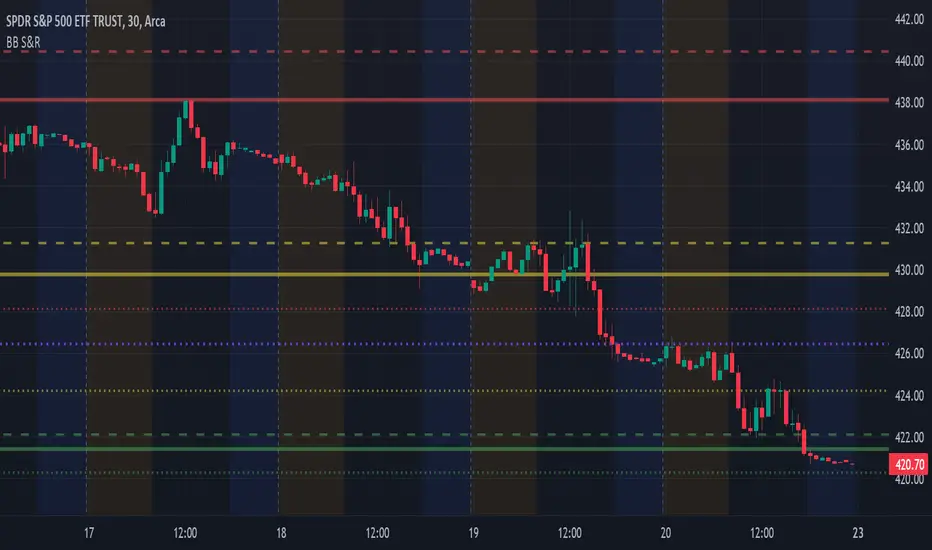
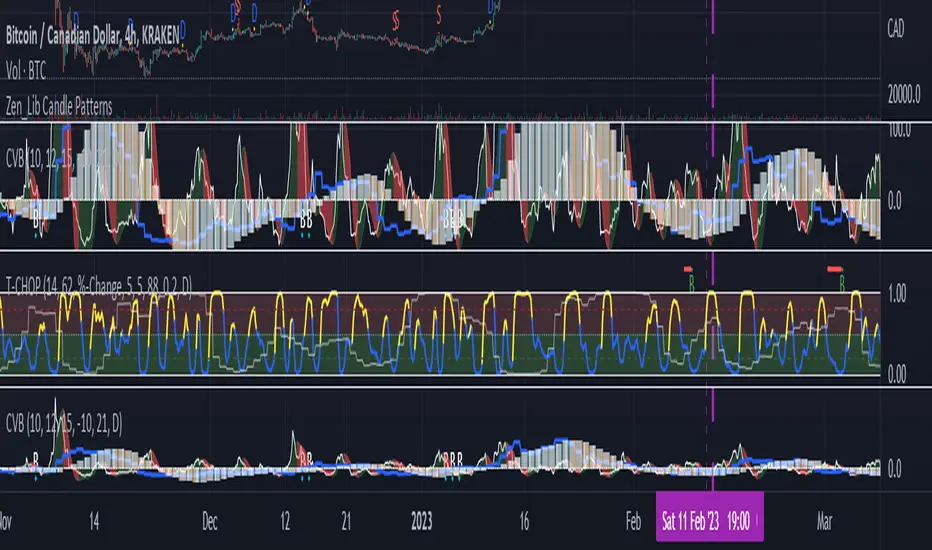
SpiceIn the chart photo is a description for each shape and letter, saying what each one is.
BB, Reversals are off by default.
BB + Reversals + Next bar confirmation - The way this should be used is by waiting for a 1 or 2 bar confirmation closed above/below the high/low of the Reversal candle. So if its a Top R, a yellow box will print as a confirmed 1 bar if it closed below the top R's low, then you can wait for the second bar to close also below the Top R's low. Vice versa with the Bot R.
RSI arrows - Essentially showing you when the multi time frame RSIs are coming back up above 30, or below 70. Respective to what time frames you have selected.
Three Line Strike - A trend continuation candlestick pattern consisting of four candles
Leledc Exhaustion suggest the trend may be reversing. Combined with the moving average as a trend filter, the indicator can signal the end of a pull back and the continuation of the trend.
EMAs - Help measuring the trend direction over a period of time.
Credit to all these amazing creators -
Multi Timeframe RSI (LTF) by @millerrh
3 Line Strike by @Lij_MC 'MarketVision A'
Leledc Exhaustion by @glaz, used updated version by @Joy_Bangla
If anyone uses the BB reversals source code to put into their own indicator/strategy, you are free to do so. Just send me a message I'd love to see your work with it! :)
Thanks to Lij_MC's MarketVision A indicator for inspiring me to add more features. At first it was just the RSI Arrows and the BB reversals candles + Condition but then I found MarketVision A and loved the extra Leledc and 3 Line Strike features.
Hope you enjoy this Spice!
No Signal is 100% correct at what it's trying to do. Use caution when trading!
Practice Risk Management.

BB Support & ResistanceChoosing support and resistance can be time consuming and subjective. Personally, I don't want to spend too much time manually marking up charts. Credit to video I saw, forget the producer, that demonstrated how multi-time frame Bollinger Bands can act as support and resistance. I suggest reading up on Bollinger Bands (en.wikipedia.org) and how to trade them. This indicator draws support and resistance lines based on Bollinger Bands on three time frames. You can select 1 or all three time frames to display on your chart. Enjoy.
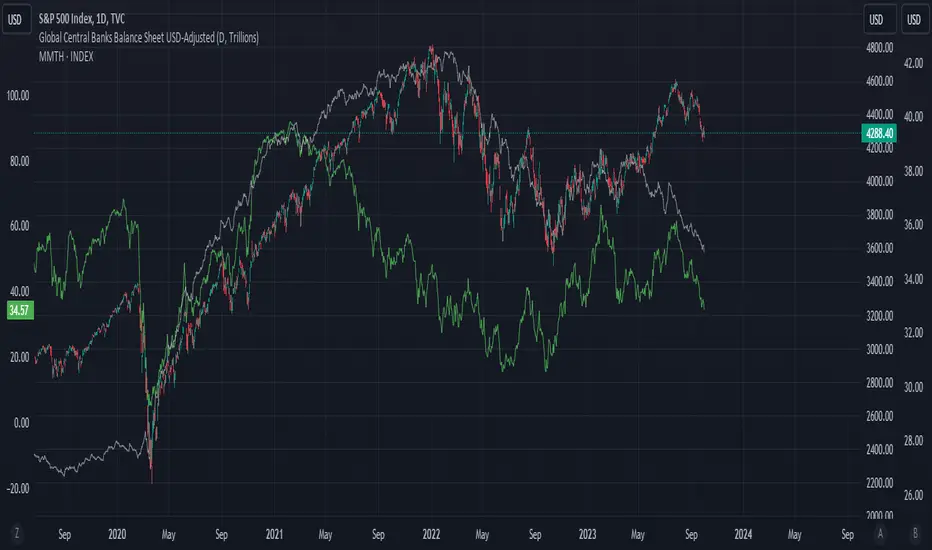
Global Central Banks Balance Sheet USD-AdjustedSumming up central banks balance sheet of:
US , China, EU, Japan, UK,
Swiss, Australia, Canada, Norway
Brazil, Russia, India, Mexico, Indonesia
Taiwan, HK, Korea, SG, Thailand
Then adjusting it to USD as the common denominator for comparison.
Net Foreign Assets (or foreign reserves) + Net Domestic Assets (or domestic credit, usually Money Supply M1) = Total Assets of the Central Bank Balance Sheet
In some way, the central bank balance sheet could be M2. However, I find some of the indicators don't add up and I don't have the time to check them out. This indicator is just a proxy. The issue with using central bank balance sheet to determine liquidity in the system is that it doesn't account for 1) collateral used for liquidity management in the public and private system, 2) shadow-banking financial system. As usual, US + EU + Japan publishes their data every weekly and the rest of the central banks publish monthly. I have removed any country with hard-pegged currencies except HK.
Additional materials to aid understanding:
www.imf.org
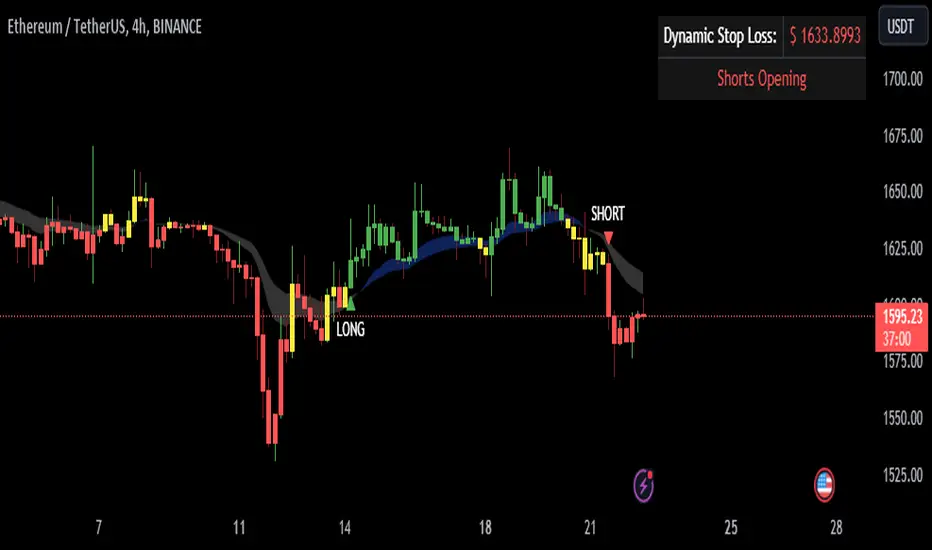
Ichimoku MA BandsThis indicator is based on the price average of the Ichimoku Strategy taking into account the last twenty five bars.
The blue band represents an upward momentum whereas the white band represents a downward momentum.
The red line is the 50 EMA which is used as a dynamic support resistance level for this strategy.
This indicator also has alerts that can be enabled by the user.
Disclaimer :
The current script should be used in confluence with other trading strategies and not in isolation. The scripts works best on 5M and 15M Timeframes and should be used with caution on lower timeframes.
This indicator is not intended to give exact entry or exit points for a trade but to provide a general idea of the trend & determine a good range for entering or exiting the trade. Please DYOR
Credit & References :
This script uses the default technical analysis reference library provided by PineScript (denoted as ta)
Buying Selling Volume StrategyFirst I would like to give the original credit and thanks to @ceyhun for his amazing volume script.
The way I decided to convert it into a strategy is divided into multiple types.
First, I decided in order to smooth out the values and make it more accurate to adapt the values to multiple timeframes.
After that I took the initial values from the buyers and sellers , and made a rest operation between them to have a flat difference between the power of both sides.
WIth that later on I decided to to apply a volatility filter,in this case bollinger bands, in order to find out potential leading trends.
At the same time in order to filter even more, I decided to make use as well for weekly VWAP values of the asset used.
Lastly I added a dynamic risk management into it , based on the ATR Daily values of the asset values.
As for the rules used, for example for long, I am looking that the price of the asset is above the weekly VWAP, after that I am checking that the MTF volume rest operation is both bullish and above the upper side of the bollinger.
For short we would want the asset to be below the weekly VWAP, and the volume to be bearish and above the upper side of bollinger.
The exit is either based on daily ATR values multipliers, or if we have a reverse condition.
If you have any questions, please let me know !

Normalized Adaptive Trend Lines [MAMA and FAMA]These indicators was originally developed by John F. Ehlers (Stocks & Commodities V. 19:10: MESA Adaptive Moving Averages). Everget wrote the initial functions for these in pine script. I have simply normalized the indicators and chosen to use the Laplace transformation instead of the hilbert transformation
How the Indicator Works:
The indicator employs a series of complex calculations, but we'll break it down into key steps to understand its functionality:
LaplaceTransform: Calculates the Laplace distribution for the given src input. The Laplace distribution is a continuous probability distribution, also known as the double exponential distribution. I use this because of the assymetrical return profile
MESA Period: The indicator calculates a MESA period, which represents the dominant cycle length in the price data. This period is continuously adjusted to adapt to market changes.
InPhase and Quadrature Components: The InPhase and Quadrature components are derived from the Hilbert Transform output. These components represent different aspects of the price's cyclical behavior.
Homodyne Discriminator: The Homodyne Discriminator is a phase-sensitive technique used to determine the phase and amplitude of a signal. It helps in detecting trend changes.
Alpha Calculation: Alpha represents the adaptive factor that adjusts the sensitivity of the indicator. It is based on the MESA period and the phase of the InPhase component. Alpha helps in dynamically adjusting the indicator's responsiveness to changes in market conditions.
MAMA and FAMA Calculation: The MAMA and FAMA values are calculated using the adaptive factor (alpha) and the input price data. These values are essentially adaptive moving averages that aim to capture the current trend more effectively than traditional moving averages.
But Omar, why would anyone want to use this?
The MAMA and FAMA lines offer benefits:
The indicator offers a distinct advantage over conventional moving averages due to its adaptive nature, which allows it to adjust to changing market conditions. This adaptability ensures that investors can stay on the right side of the trend, as the indicator becomes more responsive during trending periods and less sensitive in choppy or sideways markets.
One of the key strengths of this indicator lies in its ability to identify trends effectively by combining the MESA and MAMA techniques. By doing so, it efficiently filters out market noise, making it highly valuable for trend-following strategies. Investors can rely on this feature to gain clearer insights into the prevailing trends and make well-informed trading decisions.
This indicator is primarily suppoest to be used on the big timeframes to see which trend is prevailing, however I am not against someone using it on a timeframe below the 1D, just be careful if you are using this for modern portfolio theory, this is not suppoest to be a mid-term component, but rather a long term component that works well with proper use of detrended fluctuation analysis.
Dont hesitate to ask me if you have any questions
Again, I want to give credit to Everget and ChartPrime!

Luffy Gear 5To celebrate the reveal of Gear 5, decided to add luffy to tradingview
Have a mini companion on your chart, who better than the future pirate king??
Open source so people can experiment, thought it would be interesting to see users draw some pixel art, heres what I see as the optimized route:
Avoid long 3 things:
script length, opted for a 50x50
If statement length, break up the code
Length of main body, also links to above, functionalizing your code is good practice so put the 2 together and you have the below as an elementary implementation of pixel art!
(lower bit version of zenuchiha's work as mentioned on deviant art can be used with credit thank you im not much of an artist)
CandlestickPatternsLibrary "CandlestickPatterns"
This library provides a wide range of candlestick patterns, and available for user to call each pattern individually. It's a comprehensive and common tool designed for traders seeking to raise their technical analysis, and it may help users identify key turning of price action in financial instruments. Credit to public technical “*All Candlestick Patterns*” indicator.
abandonedBaby(order, d1)
The "Abandoned Baby" candlestick pattern is a bullish/bearish pattern consists of three candles.
Parameters:
order (simple string) : (simple string) Pattern order type "bull" or "bear".
d1 (simple float) : (simple float) Previous candle's body percentage out of candle range. Optional argument, default is 5.
darkCloudCover(c1, n)
The "Dark Cloud Cover" is a bearish pattern consists of two candles.
Parameters:
c1 (simple bool) : (simple bool) Previous candle's body must be higher than average. Optional argument, default is true.
n (simple int) : (simple int) Length of average candle's body. Optional argument, default is 14.
doji(d0)
The "Doji" is neither bullish or bearish consists of one candles.
Parameters:
d0 (simple float) : (simple float) Current candle's body percentage out of candle range. Optional argument, default is 5.
dojiStar(order, c1, n, d0)
The "Doji Star" is a bullish/bearish pattern consists of two candles.
Parameters:
order (simple string) : (simple string) Pattern order type "bull" or "bear" .
c1 (simple bool) : (simple bool) Previous candle's body must be higher than average. Optional argument, default is true.
n (simple int) : (simple int) Length of average candle's body. Optional argument, default is 14.
d0 (simple float) : (simple float) Current candle's body percentage out of candle range. Optional argument, default is 5.
downsideTasukiGap(c2, c1, n)
The "Downside Tasuki Gap" is a bearish pattern consists of three candles.
Parameters:
c2 (simple bool) : (simple bool) Before previous candle's body must be higher than average. Optional argument, default is true.
c1 (simple bool) : (simple bool) Previous candle's body must be lower than average. Optional argument, default is true.
n (simple int) : (simple int) Length of average candle's body. Optional argument, default is 14.
dragonflyDoji(d0)
The "Dragon Fly Doji" is a bullish pattern consists of one candle.
Parameters:
d0 (simple float) : (simple float) Current candle's body percentage out of candle range. Optional argument, default is 5.
engulfing(order, c1, c0, n)
The "Engulfing" is a bullish/bearish pattern consists of two candles.
Parameters:
order (simple string) : (simple string) Pattern order type "bull" or "bear".
c1 (simple bool) : (simple bool) Previous candle's body must be lower than average. Optional argument, default is true.
c0 (simple bool) : (simple bool) Current candle's body must be higher than average. Optional argument, default is true.
n (simple int) : (simple int) Length of average candle's body. Optional argument, default is 14.
eveningDojiStar(c2, c0, d1, n)
The "Evening Doji Star" is a bearish pattern consists of three candles.
Parameters:
c2 (simple bool) : (simple bool) Before previous candle's body must be higher than average, default is true.
c0 (simple bool) : (simple bool) Current candle's body must be higher than average. Optional argument, default is true.
d1 (simple float) : (simple float) Previous candle's body percentage out of candle range. Optional argument, default is 5.
n (simple int) : (simple int) Length of average candle's body. Optional argument, default is 14.
eveningStar(c2, c1, c0, n)
The "Evening Star" is a bearish pattern consists of three candles.
Parameters:
c2 (simple bool) : (simple bool) Before previous candle's body must be higher than average. Optional argument, default is true.
c1 (simple bool) : (simple bool) Previous candle's body must be lower than average. Optional argument, default is true.
c0 (simple bool) : (simple bool) Current candle's body must be higher than average. Optional argument, default is true.
n (simple int) : (simple int) Length of average candle's body. Optional argument, default is 14.
fallingThreeMethods(c4, c3, c2, c1, c0, n)
The "Falling Three Methods" is a bearish pattern consists of five candles.
Parameters:
c4 (simple bool) : (simple bool) 5th candle ago body must be higher than average. Optional argument, default is true.
c3 (simple bool) : (simple bool) 4th candle ago body must be lower than average. Optional argument, default is true.
c2 (simple bool) : (simple bool) 3rd candle ago body must be lower than average. Optional argument, default is true.
c1 (simple bool) : (simple bool) 2nd candle ago body must be lower than average. Optional argument, default is true.
c0 (simple bool) : (simple bool) Current candle's body must be higher than average. Optional argument, default is true.
n (simple int) : (simple int) Length of average candle's body. Optional argument, default is 14.
Returns: (bool)
fallingWindow()
The "Falling Window" is a bearish pattern consists of two candles.
gravestoneDoji(d0)
The "Gravestone Doji" is a bearish pattern consists of one candle.
Parameters:
d0 (simple float) : (simple float) Current candle's body percentage out of candle range. Optional argument, default is 5.
hammer(c0, n)
The "Hammer" is a bullish pattern consists of one candle.
Parameters:
c0 (simple bool) : (simple bool) Current candle's body must be lower than average. Optional argument, default is true.
n (simple int) : (simple int) Length of average candle's body. Optional argument, default is 14.
hangingMan(c0, n)
The "Hanging Man" is a bearish pattern consists of one candle.
Parameters:
c0 (simple bool) : (simple bool) Current candle's body must be lower than average. Optional argument, default is true.
n (simple int) : (simple int) Length of average candle's body. Optional argument, default is 14.
haramiCross(order, c1, n)
The "Harami Cross" candlestick pattern is a bullish/bearish pattern consists of two candles.
Parameters:
order (string) : (simple string) Pattern order type "bull" or "bear".
c1 (simple bool) : (simple bool) Previous candle's body must be higher than average. Optional argument, default is true.
n (simple int) : (simple int) Length of average candle's body. Optional argument, default is 14.
harami(order, c1, c0, n)
The "Harami" candlestick pattern is a bullish/bearish pattern consists of two candles.
Parameters:
order (string) : (simple string) Pattern order type "bull" or "bear"
c1 (simple bool) : (simple bool) Previous candle's body must be higher than average. Optional argument, default is true.
c0 (simple bool) : (simple bool) Current candle's body must be lower than average. Optional argument, default is true.
n (simple int) : (simple int) Length of average candle's body. Optional argument, default is 14.
invertedHammer(c0, n)
The "Inverted Hammer" is a bullish pattern consists of one candle.
Parameters:
c0 (simple bool) : (simple bool) Current candle's body must be lower than average. Optional argument, default is true.
n (simple int) : (simple int) Length of average candle's body. Optional argument, default is 14.
kicking(order, c1, c0, n)
The "Kicking" candlestick pattern is a bullish/bearish pattern consists of two candles.
Parameters:
order (string) : (simple string) Pattern order type "bull" or "bear"
c1 (simple bool) : (simple bool) Previous candle's body must be higher than average. Optional argument, default is true.
c0 (simple bool) : (simple bool) Current candle's body must be higher than average. Optional argument, default is true.
n (simple int) : (simple int) Length of average candle's body. Optional argument, default is 14.
longLowerShadow(l0)
The "Long Lower Shadow" candlestick pattern is a bullish pattern consists of one candles.
Parameters:
l0 (simple float) : (simple float) Current candle's lower wick min percentage out of candle range. Optional argument, default is 75.
longUpperShadow(u0)
The "Long Upper Shadow" candlestick pattern is a bearish pattern consists of one candles.
Parameters:
u0 (simple float) : (simple float) Current candle's upper wick min percentage out of candle range. Optional argument, default is 75.
marubozuBlack(c0, n)
The "Marubozu Black" candlestick pattern is a bearish pattern consists of one candles.
Parameters:
c0 (simple bool) : (simple bool) Current candle's body must be higher than average. Optional argument, default is true.
n (simple int) : (simple int) Length of average candle's body. Optional argument, default is 14.
marubozuWhite(c0, n)
The "Marubozu White" candlestick pattern is a bullish pattern consists of one candles.
Parameters:
c0 (simple bool) : (simple bool) Current candle's body must be higher than average. Optional argument, default is true.
n (simple int) : (simple int) Length of average candle's body. Optional argument, default is 14.
morningDojiStar(c2, d1, c0, n)
The "Morning Doji Star" candlestick pattern is a bullish pattern consists of three candles.
Parameters:
c2 (simple bool) : (simple bool) Before previous candle's body must be higher than average. Optional argument, default is true.
d1 (simple float) : (simple float) Previous candle's body percentage out of candle range. Optional argument, default is 5.
c0 (simple bool) : (simple bool) Current candle's body must be higher than average. Optional argument, default is true.
n (simple int) : (simple int) Length of average candle's body. Optional argument, default is 14.
morningStar(c2, c1, c0, n)
The "Morning Star" candlestick pattern is a bullish pattern consists of three candles.
Parameters:
c2 (simple bool) : (simple bool) Before previous candle's body must be higher than average. Optional argument, default is true.
c1 (simple bool) : (simple bool) Previous candle's body must be lower than average. Optional argument, default is true.
c0 (simple bool) : (simple bool) Cuurent candle's body must be higher than average. Optional argument, default is true.
n (simple int) : (simple int) Length of average candle's body. Optional argument, default is 14.
onNeck(c1, c0, n)
The "On Neck" candlestick pattern is a bearish pattern consists of two candles.
Parameters:
c1 (simple bool) : (simple bool) Previous candle's body must be higher than average. Optional argument, default is true.
c0 (simple bool) : (simple bool) Cuurent candle's body must be lower than average. Optional argument, default is true.
n (simple int) : (simple int) Length of average candle's body. Optional argument, default is 14.
piercing(c1, n)
The "Piercing" candlestick pattern is a bullish pattern consists of two candles.
Parameters:
c1 (simple bool) : (simple bool) Previous candle's body must be higher than average. Optional argument, default is true.
n (simple int) : (simple int) Length of average candle's body. Optional argument, default is 14.
risingThreeMethods(c4, c3, c2, c1, c0, n)
The "Rising Three Methods" candlestick pattern is a bullish pattern consists of five candles.
Parameters:
c4 (simple bool) : (simple bool) 5th candle ago body must be higher than average. Optional argument, default is true.
c3 (simple bool) : (simple bool) 4th candle ago body must be Lower than average. Optional argument, default is true.
c2 (simple bool) : (simple bool) 3rd candle ago body must be Lower than average. Optional argument, default is true.
c1 (simple bool) : (simple bool) 2nd candle ago body must be Lower than average. Optional argument, default is true.
c0 (simple bool) : (simple bool) Current candle's body must be higher than average. Optional argument, default is true.
n (simple int) : (simple int) Length of average candle's body. Optional argument, default is 14.
risingWindow()
The "Rising Window" candlestick pattern is a bullish pattern consists of two candle.
shootingStar(c0, n)
The "Shooting Star" candlestick pattern is a bearish pattern consists of one candle.
Parameters:
c0 (simple bool) : (simple bool) Current candle's body must be higher than average. Optional argument, default is true.
n (simple int) : (simple int) Length of average candle's body. Optional argument, default is 14.
spinningTopBlack(l0, u0)
The "Spinning Top Black" is neither bullish or bearish.
Parameters:
l0 (simple float) : (simple float) Current candle's lower wick min percentage out of candle range. Optional argument, default is 34.
u0 (simple float) : (simple float) Current candle's upper wick min percentage out of candle range. Optional argument, default is 34.
spinningTopWhite(l0, u0)
The "Spinning Top White" is neither bullish or bearish.
Parameters:
l0 (simple float) : (simple float) Current candle's lower wick min percentage out of candle range. Optional argument, default is 34.
u0 (simple float) : (simple float) Current candle's upper wick min percentage out of candle range. Optional argument, default is 34.
threeBlackCrows(c2, c1, c0, n)
The "Three Black Crows" candlestick pattern is a bearish pattern consists of three candles.
Parameters:
c2 (simple bool) : (simple bool) Before previous candle's body must be higher than average. Optional argument, default is true.
c1 (simple bool) : (simple bool) Previous candle's body must be higher than average. Optional argument, default is true.
c0 (simple bool) : (simple bool) Cuurent candle's body must be higher than average. Optional argument, default is true.
n (simple int) : (simple int) Length of average candle's body. Optional argument, default is 14.
threeWhiteSoldiers(c2, c1, c0, n)
The "Three White Soldiers" candlestick pattern is a bullish pattern consists of three candles.
Parameters:
c2 (simple bool) : (simple bool) Before previous candle's body must be higher than average. Optional argument, default is true.
c1 (simple bool) : (simple bool) Previous candle's body must be higher than average. Optional argument, default is true.
c0 (simple bool) : (simple bool) Cuurent candle's body must be higher than average. Optional argument, default is true.
n (simple int) : (simple int) Length of average candle's body. Optional argument, default is 14.
triStar(order, d2, d1, d0)
The "Tri Star" candlestick pattern is a bullish/bearish pattern consists of three candles.
Parameters:
order (simple string) : (simple string) Pattern order type "bull" or "bear".
d2 (simple float) : (simple float) Before previous candle's body percentage out of candle range. Optional argument, default is 5.
d1 (simple float) : (simple float) Previous candle's body percentage out of candle range. Optional argument, default is 5.
d0 (simple float) : (simple float) Current candle's body percentage out of candle range. Optional argument, default is 5.
tweezerBottom(c1, n)
The "Tweezer Bottom" candlestick pattern is a bullish pattern consists of two candles.
Parameters:
c1 (simple bool) : (simple bool) Previous candle's body must be higher than average. Optional argument, default is true.
n (simple int) : (simple int) Length of average candle's body. Optional argument, default is 14.
tweezerTop(c1, n)
The "Tweezer Top" candlestick pattern is a bearish pattern consists of two candles.
Parameters:
c1 (simple bool) : (simple bool) Previous candle's body must be higher than average. Optional argument, default is true.
n (simple int) : (simple int) Length of average candle's body. Optional argument, default is 14.
upsideTasukiGap(c2, c1, n)
The "Tri Star" candlestick pattern is a bullish pattern consists of three candles.
Parameters:
c2 (simple bool) : (simple bool) Before Previous candle's body must be higher than average. Optional argument, default is true.
c1 (simple bool) : (simple bool) Previous candle's body must be lower than average. Optional argument, default is true.
n (simple int) : (simple int) Length of average candle's body. Optional argument, default is 14.
Previous Day High Low Strategy only for LongWelcome to the "Previous Day High Low Strategy only for Long"!.
This strategy aims to identify potential long trading opportunities based on the previous day's high and low prices, along with certain market strength conditions.
Key Features:
Entry Conditions: The strategy triggers a long position when the current day's closing price crosses above the previous day's high or low.
Market Strength Filter: The strategy incorporates a market strength filter using the Average Directional Index (ADX). It only takes long positions when the ADX value is above a specific threshold and when there is a predominance of upward movement.
Trade Timing: The strategy operates within a specified trade window, starting at 09:30 and ending at 15:10. Positions are closed at 15:15 if still active.
Risk Management: The strategy employs dynamic stop-loss and profit-taking levels based on a user-defined Max Profit value. It has three profit targets (T1, T2, T3) and a stop-loss level to manage risk effectively.
Rules:
Ensure that the strategy idea is clearly understandable. Provide an easy-to-read title and a thoughtful description explaining the reasoning behind the strategy.
All content should be ad-free. Avoid any form of promotion, advertising, or solicitation.
No fundraising requests or money solicitation is allowed on TradingView.
Publish in the same language as the TradingView subdomain you're on, except for script titles, which must be in English.
Don't plagiarize. Create and share only unique content, and always give credit when using someone else's work.
Be respectful, kind, and constructive when engaging with others.
Zero tolerance for contentious political discourse, defamatory, threatening, or discriminatory remarks.
Avoid sharing harmful, misleading, or inappropriate content.
Respect the moderators' work and address complaints privately.
Use only your original account and avoid creating duplicate or fake accounts.
Do not attempt to manipulate the reputation system or engage in like-for-like schemes.
Explanation of how the strategy works
1. Previous Day's High and Low (HH, LL):
In this strategy, we start by obtaining the high and low prices of the previous day (not the current day) using the request.security function. This function allows us to access historical data for a specific time frame. The high and low prices are stored in the variables HH and LL, respectively.
2. Entry Conditions:
The strategy uses two conditions to trigger a long position:
Condition 1 (Long Condition 1): If the closing price of the current day crosses above the previous day's high (HH), it generates a long signal. This is achieved using the ta.crossover function, which detects when a crossover occurs.
Condition 2 (Long Condition 2): Similarly, if the closing price of the current day crosses above the previous day's low (LL), it also generates a long signal.
Combined Condition: To take long positions, the strategy combines both long conditions using the logical OR operator (or). This means that if either of the two conditions is met, a long position will be initiated.
3. Market Strength Filter:
The strategy also includes a filter based on the Average Directional Index (ADX) to gauge the market's strength before taking long positions. The ADX measures the strength of a trend in the market. The higher the ADX value, the stronger the trend.
Calculation of ADX: The ADX is calculated using the adx function, which takes two parameters: LWdilength (DMI Length) and LWadxlength (ADX period).
Strength Condition (strength_up): The strategy requires that the ADX value should be above a threshold (11 in this case) and that there is a predominance of upward movement (up > down) before initiating a long position. The LWADX value is multiplied by 2.5 and compared to the highest value of LWADX from the last 4 periods using ta.highest(LWADX , 4). If these conditions are met, the variable strength_up is set to true.
Combined Condition: The strength_up condition is then combined with the long conditions using the logical AND operator (and). This means that the strategy will only take a long position if both the long conditions and the market strength condition are met.
4. Trade Timing:
The strategy sets a specific trade window between 09:30 and 15:10. It will only execute trades within this time frame (TradeTime).
5. Risk Management:
The strategy implements dynamic stop-loss (SL) and profit-taking levels (T1, T2, T3) based on a user-defined Max Profit value. The stop-loss is set as a percentage of the Max Profit value. As the position moves in favor of the trader, the profit targets are adjusted accordingly.
6. Position Management:
The strategy uses the strategy.entry function to enter long positions based on the combined entry conditions. Once a position is open, the script uses strategy.exit to define the exit condition when either the profit target or stop-loss level is hit. The strategy.close function is used to close any open position at the end of the trade window (15:15).
7. Plotting:
The strategy uses the plot function to visualize the previous day's high and low prices, as well as the stop-loss (SL) and profit-taking (T1, T2, T3) levels on the chart.
Overall, the "Previous Day High Low Strategy only for Long" aims to identify potential long trading opportunities based on the previous day's price action and market strength conditions. However, as with any trading strategy, it's essential to thoroughly test it and consider risk management before applying it to real-world trading scenarios.
Disclaimer:
The information presented by this strategy is for educational purposes only and should not be considered as investment advice. The strategy is not designed for qualified investors. Always conduct your own research and consult with a financial advisor before making any trading decisions.
Remember, the success of any trading strategy depends on various factors, including market conditions, risk management, and individual trading skills. Past performance is not indicative of future results.

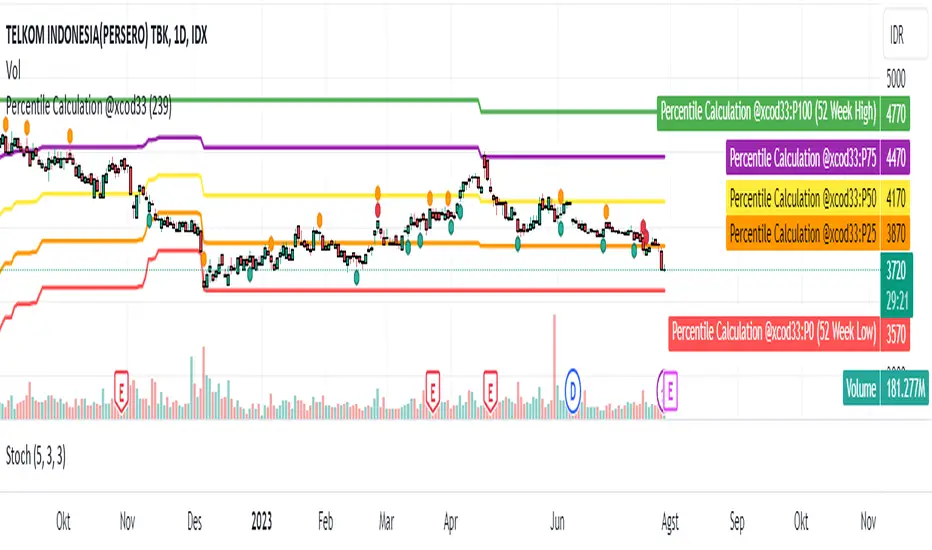
Percentile Calculation @xcod33This script calculates the current price percentile based on the highest and lowest price range in the last 52 weeks.
How to Use:
This script will provide the current price percentile relative to the 52-week price range on your chart. You can use it as an indicator to help identify where the current price stands relative to the historical price range in that period.
Targeted Market:
This script can be applied to various financial markets, including stocks, forex, indices, commodities, and others. It is not limited to a specific market and can be used across various trading instruments.
Market Conditions:
Here are some market conditions where this script can be useful:
1. Identifying Price Extremes: By looking at the current percentile, you can see if the price is near the highest or lowest extremes in the last 52 weeks. If the percentile is close to 0%, it means the price is near the lowest, while a percentile close to 100% indicates the price is near the highest.
Finding Consolidation Patterns: You can identify whether the price is within a certain range by looking at the percentile. If the percentile is around 50%, it indicates a relatively consistent price range.
2. Identifying Breakouts and Pullbacks: When the price is outside the historical range and the percentile approaches 100%, it indicates a breakout. When the price retraces back to the range and the percentile approaches 50%, it indicates a pullback.
3. However, keep in mind that this indicator only provides an additional perspective on the price relative to the 52-week range. It is not recommended to use this indicator as the sole basis for trading decisions. Always use further analysis and other indicators to confirm your trading signals.
Credit :
- M Rico Aditya Prayoga | Author
- Tri Okta Setiawan Marblo | Maker of formulas and ideas
Savitzky-Golay Filtered Chande Momentum OscillatorThe Savitzky-Golay Filtered Chande Momentum Oscillator (SGCMO) is a modified version of the Chande Momentum Oscillator that functions as a powerful analytical tool, capable of detecting trends and mean reversals. By applying a Savitzky-Golay filter to the price data, the oscillator provides enhanced visualization and smoother readings. (credit to © anieri for the Savitzky-Golay filter code: www.tradingview.com)
Chande Momentum Oscillator
The Chande Momentum Oscillator (CMO) is a technical indicator developed by Tushar Chande. It measures the momentum of an asset's price movement and provides insights into the overbought or oversold conditions of the market. The CMO calculates the difference between the sum of positive price changes and the sum of negative price changes over a specified period, and then normalizes it to a scale between -100 and +100. Traders and investors use the CMO to identify potential trend reversals, confirm the strength of a current trend, and generate buy or sell signals.
Smoothing
The Savitzky-Golay filter is a digital filter commonly employed for smoothing and noise reduction in time-series data. In the context of the SGCMO, the aim is to effectively smooth the CMO values, reducing the impact of short-term fluctuations and providing clearer insights into underlying trends. Additionally, an exponential moving average (EMA) filter is applied to further reduce noise and enhance trend visibility. This filtered CMO indicator may provide traders and investors with a clearer and more refined representation of momentum changes in the underlying asset, helping them make more informed trading decisions.
Application
The SGCMO serves as both a trend-following and mean-reversion tool. Traders can track the current trend using bullish white lines or bearish orange lines in trending markets. Alternatively, they can utilize green and red vertical lines, which indicate price retracement and help capture pullbacks and reversals. Green vertical lines appear when the trend reverses upwards in an oversold zone (-50 to -80), while red vertical lines indicate negative trend reversals in an overbought zone (50 to 80). Opening long positions when green and white lines appear, or short positions when red and orange lines are visible, can be considered. However, it is advisable to combine this indicator with other complementary technical analysis tools and incorporate it into a comprehensive trading strategy to maximize its effectiveness.

Discrete Fourier Transformed Money Flow IndexThe Discrete Fourier Transform Money Flow Index indicator integrates the Money Flow Index (MFI) with Discrete Fourier Transform (credit to author wbburgin - May 26 2023 ) smoothing to offer a refined and smoothed depiction of the MFI's underlying trend. The MFI is calculated using the formula: MFI = 100 - (100 / (1 + MR)), where a high MFI value indicates robust buying pressure (signaling an overbought condition), and a low MFI value indicates substantial selling pressure (signaling an oversold condition).
Why is the DFT and MFI combined?
The aim of this combination between DFT and MFI is to effectively filter out short-term fluctuations and noise, enabling a clearer assessment of the overall trend. This smoothing process enhances the reliability of the MFI by emphasizing dominant and sustained buying or selling pressures. This script executes a full DFT but only uses filtering from one frequency component. The choice to focus on the magnitude at index 0 is significant as it captures the dominant or fundamental frequency in the data. By analyzing this primary cyclic behavior, we can identify recurring patterns and potential turning points more easily. This streamlined approach simplifies interpretation and enhances efficiency by reducing complexity associated with multiple frequency components. Overall, focusing on the dominant frequency and applying it to the MFI provides a concise and actionable assessment of the underlying data.
Note: The FMFI indicator provides both smoothed and non-smoothed versions of the MFI, with the option to toggle the original non-smoothed MFI on or off in the settings.
Application
FMFI functions as a trend-following indicator. Bullish trends are denoted by the color white, while bearish trends are represented by the color purple. Circles plotted on the FMFI indicate regular bull and bear signals. Additionally, red arrows indicate a strong negative trend, while green arrows indicate a strong positive trend. These arrows are calculated based on the presence of regular bull and bear signals within overbought and oversold zones. To enhance its effectiveness, it is recommended to combine this indicator with other complementary technical analysis tools and integrate it into a comprehensive trading strategy. Traders are encouraged to explore a wide range of settings and timeframes to align the indicator with their unique trading preferences and adapt it to the current market conditions. By doing so, traders can optimize the indicator's performance and increase their potential for successful trading outcomes.
Utility
Traders and investors can employ this indicator to enhance their trend-following strategies. The white-colored components of the FMFI can help identify potential buying zones, while the purple-colored components can assist in identifying potential selling points. The red and green arrows can be used to pinpoint moments of strong bull or bear momentum, allowing traders to position themselves advantageously in their trading activities. Please note that future performance of any trading strategy is fundamentally unknowable, and past results do not guarantee future performance.

ALMA Smoothed Gaussian Moving AverageThis indicator is an altered version of the Gaussian Moving Average (GMA) (Credit to author: © LeafAlgo ). The GMA applies weights to the prices, giving more importance to the values closer to the current period and gradually diminishing the significance of older prices. The ALMA Smoothed Gaussian Moving Average (ASGMA) applies an ALMA smoothing to its price data to minimize lag and provide a more accurate representation of the underlying trend by dynamically adapting to changing market conditions. The Arnaud Legoux Moving Average (ALMA) is a specialized smoothing technique that adjusts the weights of the moving average based on market volatility. Its calculation uses Wavelet Transform techniques which enables this type of smoothing to capture both high-frequency and low-frequency components of a signal or data. The rationale for this mashup between ALMA and Gaussian filtering is to smooth the moving average line over the smoothed price data and produce stronger trend signals.
ASGMA serves as a trend-following indicator, identifying both bullish and bearish trends. It provides buy and sell signals indicated by "B" and "S" labels plotted alongside the price data. Additionally, the ASGMA's Exponential Moving Average (EMA) line alternates between green and red, indicating bullish and bearish momentum, respectively.
The ASGMA also incorporates two popular momentum indicators, the Relative Strength Index (RSI) and the Chande Momentum Oscillator (CMO). The inclusion of these indicators aims to enhance trend identification and reversal signals. For a strong buy signal, all three indicators (RSI, CMO, and ASGMA) must indicate bullish conditions, resulting in a vertical green line. Conversely, a vertical red line is plotted when all indicators indicate bearish conditions, representing a strong sell signal.
The ASGMA, with its unique combination of smoothing techniques and indicator amalgamation, provides traders and investors with powerful analytical tools. It can be applied in trend-following strategies using the regular buy and sell signals generated by labels and the EMA line. Alternatively, the vertical lines offer stronger buy and sell signals. These features aid in identifying potential entry and exit points, thereby enhancing trading decisions and market analysis. However, it is important to remember that the future performance of any trading strategy is fundamentally unknowable, and past results do not guarantee future performance.

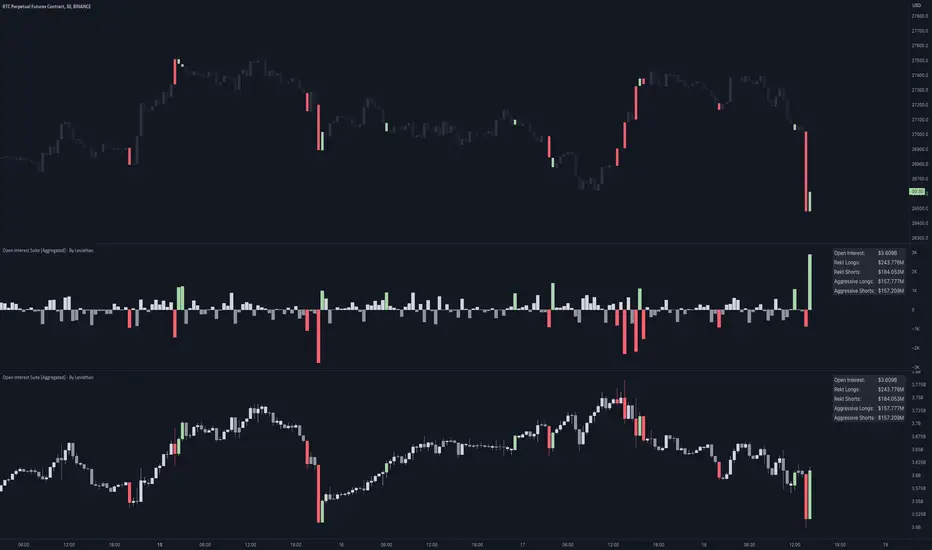
Open Interest Suite [Aggregated] - By LeviathanThis script is an all-in-one indicator that uses aggregated Open Interest data to plot OI candles, Open Interest Delta, OI x rVOL, and OI RSI. It also includes tools such as an OI Distribution profile, large OI increase/decrease coloring, a Stats Screener, and much more.
You can select and have the script plot the following:
- Open Interest in the form of OHLC candles
- Open Interest Delta in the form of a histogram
- Open Interest x Relative Volume in the form of a histogram
- Open Interest RSI in the form of a line
Additional features include:
- OI Distribution Profile (It shows the distribution of open interest in the visible range on y axis. This makes it easier to identify when Open Interest is relatively high or low and at which values most of the action took place)
- Stats screener (The screener includes the real-time net Open Interest value, Rekt Longs/Rekt Shorts based on large OI decreases and Aggressive Longs/Shorts based on large OI increases)
- Coloring (You can color OI Delta nodes, background and chart candles based on large OI increases/decreases)
- more
Instructions for the settings will be provided in the tooltips shortly.
Full credit goes to @KioseffTrading for the profile generation code.
NSDT Custom High and Low LinesFirst, the credit for the original script to plot a High and Low between a certain time goes to developer paaax.
I took that idea, converted it to Pinescript V5, cleaned up the code, and added a few more lines so you can plot different levels based on time of day.
Published open source like the original.
The example shown has:
Blue - plotting from the start of the Futures Asian session to the start of the Futures USA Session. (6:00PM - 9:30AM Eastern)
Yellow - plotting from the start of the Futures Europe session to the start of the Futures USA Session. (3:00AM - 9:30AM Eastern)
Green - plotting from the start of the Futures US Premarket session to the start of the Futures USA Session. (8:00AM - 9:30AM Eastern)
These are great levels to use for breakouts and/or support and resistance.
Combine these levels with the 5 min Open Range levels, as you have some good trades.
Each of the three sessions have individual start and end times that can be modified by the trader, so you can easily mark off important areas for your style of trading.

Pattern Forecast (Expo)█ Overview
The Pattern Forecast indicator is a technical analysis tool that scans historical price data to identify common chart patterns and then analyzes the price movements that followed these patterns. It takes this information and projects it into the future to provide traders with potential price actions that may occur if the same pattern is identified in real-time market data. This projection helps traders to understand the possible outcomes based on the previous occurrences of the pattern, thereby offering a clearer perspective of the market scenario. By analyzing the historical data and understanding the subsequent price movements following the appearance of a specific pattern, the indicator can provide valuable insights into potential future market behavior.
█ Calculations
The indicator works by scanning historical price data for various candlestick patterns. It includes all in-built TradingView patterns, credit to TradingView that has coded them.
Essentially, the indicator takes the historical price moves that followed the pattern to forecast what might happen next.
█ Example
In this example, the algorithm is set to search for the Inverted Hammer Bullish candlestick pattern. If the pattern is found, the historical outcome is then projected into the future. This helps traders to understand how the past pattern evolved over time.
█ How to use
Providing traders with a comprehensive understanding of historical patterns and their implications for future price action allows them to assess the likelihood of specific market scenarios objectively. For example, suppose the pattern forecast indicator suggests that a particular pattern is likely to lead to a bullish move in the market. A trader might consider going long if the same pattern is identified in the real-time market. Similarly, a trader might consider shorting the asset if the indicator suggests a bearish move is likely, if the same pattern is identified in the real-time market.
█ Settings
Pattern
Select the pattern that the indicator should scan for. All inbuilt TradingView patterns can be selected.
Forecast Candles
Number of candles to project into the future.
-----------------
Disclaimer
The information contained in my Scripts/Indicators/Ideas/Algos/Systems does not constitute financial advice or a solicitation to buy or sell any securities of any type. I will not accept liability for any loss or damage, including without limitation any loss of profit, which may arise directly or indirectly from the use of or reliance on such information.
All investments involve risk, and the past performance of a security, industry, sector, market, financial product, trading strategy, backtest, or individual's trading does not guarantee future results or returns. Investors are fully responsible for any investment decisions they make. Such decisions should be based solely on an evaluation of their financial circumstances, investment objectives, risk tolerance, and liquidity needs.
My Scripts/Indicators/Ideas/Algos/Systems are only for educational purposes!

Multi-Timeframe Trend TableThis is the first publication of an indicator to show trend on the higher timeframes and is an English version of the "Mtf Supertrend Table" coded by FxTraderProAsistan. Credit goes to him for the genesis of this work. I updated the original code to Pinescript V.5 and modified it to suit my needs. Please enjoy.
This trend table indicator has the following features:
1. Trend Mode : Option to select the method of determining trend, using the Pinescript built-in ta.supertrend function or finding trend based on the cross of 20 and 50 EMA
2. 6 trend timeframes of your choosing, with show/hide
3. Optional feature to include the DXY (US dollar) trends, for the timeframes chosen. Useful for instruments that react to changes in the US dollar
4. ATR settings to adjust the Supertrend parameters. Default values are an ATR length of 10 and a Factor of 3

Volume-based Support & Resistance Zones-V1 By Trade Mastership™ The all-new Support & Resistance Zones indicator, which has been upgraded to offer traders more powerful features and functionality. This innovative indicator identifies high-volume fractal lows or highs to create zones based on the size of the wick for that timeframe's candle. This makes it easy for traders to visualize which price levels are the most significant for either a trend continuation or a reversal when zones are broken and retested.
The original script for this indicator was created by Trade Mastership, with additional modifications by L N Behera. Credit goes to both of them for the majority of the logic behind this script. Since then, the script has been improved with several changes, including:
Changing the default S/R lines from plots to lines, and giving users the option to change between solid, dashed, or dotted lines for both S/R lines
Adding additional timeframes and more options for TF1, beyond the current TF. Now, users have four timeframes to plot S/R zones from
Giving users the option to easily change the line thickness for all S/R lines
Making it easier to change the colors of S/R lines and zones by consolidating the options under settings (rather than under style)
Adding extensions to active SR Zones to extend all the way right
Adding the option to extend or not extend the previous S/R zones up to the next S/R zone
Adding optional timeframe labels to active S/R zones, with left and right options, as well as the option to adjust how far to the right the label is set
Fixing an issue where the higher timeframe S/R zone was not properly starting from the high/low of fractal. Now, any higher timeframe S/R will begin exactly at the High/Low points. Note that this may not work perfectly on stocks, and if a fractal high/low is too many bars in the past, it will revert to a default max bars back to avoid script errors.
Adding a function to prevent S/R zones from lower timeframes displaying while on a higher timeframe. This helps clean up the chart quite a bit.
Creating arrays for each timeframe's boxes and lines so that the number of S/R zones can be controlled for each timeframe and limit memory consumption.
Adding new alert options and customized alert messages
Here's how this indicator works: it looks for fractal highs or fractal lows with volume that pierces above the volume's Moving Average. This moving average value can be modified in the settings for each timeframe. The fractal highs will be confirmed with three successive higher highs followed by two successive lower highs and vice versa for the fractal lows. The zone is created from the fractal high/low and the close of the candle for whatever timeframe you selected. The bigger the zone, the more significant that zone is.
Traders can disable any zone, change the zones to show lines only, and modify all the colors, transparencies, and thickness of lines for all the zones. To create alerts, traders can enable the types of alerts they want for each timeframe in the indicator's settings. After applying changes, right-click on one of the zones on the chart, and click "Add Alert on Vol S/R Zones." You do not need to add a title, as the correct alert messages are already built-in.
The latest update has migrated the script to Pine Script Version 5 and added a higher number of total boxes/lines to show on the chart. It has also increased the max bars count to the maximum Pine Script allows, enabling traders to utilize as many bars as possible when drawing the left side of SR zones that are very far back on the chart. Additionally, the update fixed issues where the indicator would not load on 1 minute and 3-minute charts unless higher timeframe SR zones

Volume Profile Fixed Range Support and Resistance LevelsThis script is based on the excellent Volume Profile / Fixed Range indicator by @LonesomeTheBlue, so all credit for the foundations of this indicator goes to @LonesomeTheBlue
I basically made 5 instances of the original script and added horizontal lines at the beginning and end of the each Value Area. To use the script as a support and resistance tool without the Value Areas and Point of Control (POC) labels you just need to untick "Boxes" and "Labels" in the "Style" section of the “Settings”.
The default look-back periods (in bars) are 7, 30, 60, 180 and 365, but you can change this or the colour of the lines easily in the “Settings”.
The dashed lines are the respective POC.
I find this tool to be very useful for quickly identifying interest levels on any chart while also ensuring a certain amount of objectivity in your TA.
Hope you find it useful and thanks again to @LonesomeTheBlue for going through the trouble of coding this and being so generous to share it with the rest of us!
Good luck out there!

JZ_Chaikin HTF Volatility BreakoutFirst off, all credit to Harry Potter as this is a minor customization of his indicator.
Basic additions:
-- Added a Higher Timeframe that is set to Daily but can be changed. Timeframe does wait until barstate.isconfirmed so won't repaint.
-- Added HMA smoothing line to both Chart and HTF. Can be used as it's own signal, as confirmation or in combination with faster signal line -- Breakout signal & Range Highlight use both.
-- Added optional coloring of HMA based on whether increasing or decreasing.
-- Added a low volatility option that highlights Range/No Trade zones. Defval is off so needs to be selected from inputs.
Breakout Signals are very simple and both take the HTF signal and HMA. When the faster Volatility line rises from below zero and comes within the range of -10 to 0, AND the HMA signals is increasing (and also below zero) for confirmation, generates a breakout signal of an incoming big move. You can alter the breakout threshold to be greater or less than -10, I just found that works best for filtering out the noise and false signals. Won't catch everything, but pretty reliable when it does.
Tested mostly on BTC so can't vouch for other assets and would likely need modification.
I've JUST taught myself coding from scratch (and to say I'm an amateur is an understatement), so apologies in advance if anything is unclear or could be coded better. Open to any suggestions.
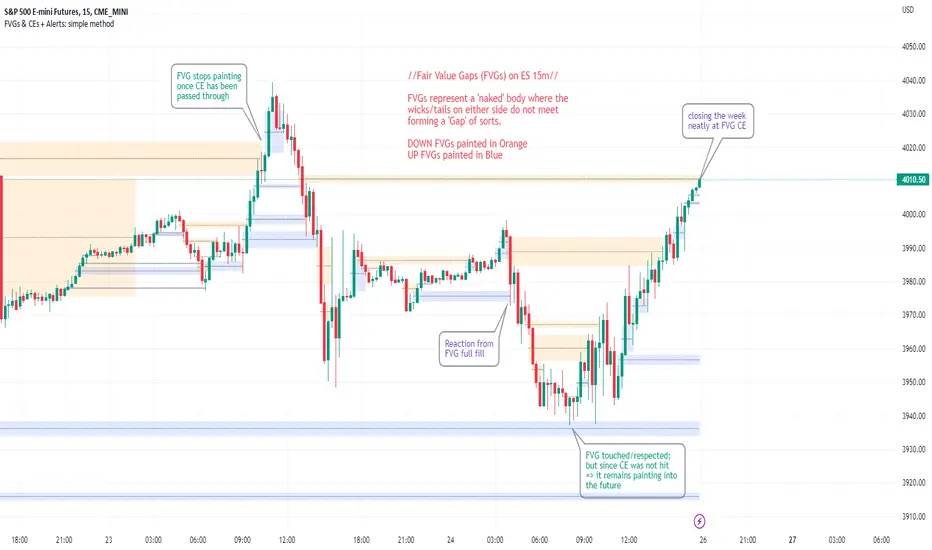
FVGs & CEs + Alerts: simple & efficient methodFair Value Gap indicator: Paints FVGs and their midlines (CEs). Stops painting when CE is hit, or when fully filled; user choice of threshold. This threshold is also used in the Alert conditions.
~~Plotted here on ES1! (CME), on the 15m timeframe~~
-A FVG represents a 'naked' body where the wicks/tails on either side do not meet. This can be seen as a type of 'gap', which price will have a tendency to want to re-fill (in part or in full).
-The midline (CE, or 'Consequent encroachment') of FVGs also tend to show price sensitivity.
-This indicator paints all FVGs until priced into, and should give an idea of which are more meaningful and which are best ignored (based on context: location, Time of day, market structure, etc).
-This is a simpler and more efficient method of painting Fair value gaps which auto-stop painting when price reaches them.
//Aims of Publishing:
-Education of ICT concepts of Fair Value Gaps and their midlines (CEs): To easily see via forward testing or backtesting, the sensitivity that price shows to these areas & levels.
-Demonstration of a much more efficient way of plotting FVGs which terminate at price, thanks to a modification of @Bjorgums's clever looping method referenced below.
//Settings:
-Toggle on/off upward and downward FVGs independently(blue and orange by default).
-Toggle on/off midline (CE).
-Standard color/line formatting options.
-Choose Threshold: CE of FVG or Full Fill of FVG: This will determine both the 'stop-painting' trigger and the 'Alert' trigger.
-Choose number of days lookback to control how many historical FVGs paint on chart.
//On alerts:
-Simple choice of 2 alerts:
~~One for price crossing into/above the nearest untouched 'premium' FVG above ( orange ). Trigger is user choice of CE or full fill.
~~Another for price crossing into/below the nearest untouched 'discount' FVG below (blue). Trigger is user choice of CE or full fill.
-Alerts set via the three dots in indicator status line.
//Cautionary notes:
-Do not use the alerts blindly to find trades. Wait until you have identified a good FVG above/below which you think price may show sensitivity to
-Usage on very low timeframes can cause unexpected results with alerts: due to new FVGs forming in realtime the Alert will always trigger at the most recent FVG above/ below having its threshold hit.
-Big thank you to @Bjorgum for his fantastic extendAndRemove method. Modified here for use with boxes and to integrate Alerts.
-Also Credit to ICT (inner circle trader) for the concepts used here: Fair value gaps and their Consequent Encroachment (CE).
Buying and Selling Pressure Raw Multi (TG Fork)Visualize raw buying and selling pressure via 3 different calculation methods, all superimposed with dynamic rescaling.
Buying and selling pressure is the concept of quantifying the disproportion between buying and selling. In practice, there is no single definitive way to calculate it.
This indicator is a merge to display three different methods to calculate buying and selling pressure, with automatic visual rescaling to superimpose the three simultaneously, updated to PineScript v5, and with some additional improvements for speed and calculation precisions, and instead of the EMA, other types of moving averages can be used.
I primarily made it for my own needs, but as always, I like sharing with the community, as maybe others may find this useful too.
How to use:
* As often, the goal is to get as many of the 3 signals concur together to get a stronger aggregated signal.
* First signal: If the green bars on the histogram are bigger than the red ones, then there is more buying pressure, and vice versa.
* Second signal: If the background is green, there is more buying pressure, and vice versa if the background is orange. The yellow and green lines define the background color, but they are by default hidden for a less cluttered visual experience.
* Third signal: If the cloud is blue, there is more buying pressure, and the bigger the cloud, the more momentum there is for it to stay (and more difficult it is to reverse to selling pressure). If the cloud is red, there is more selling pressure.
If you like this indicator, please don't give me any credit, instead please show some love to the original authors (in no particular order):
ceyhun:
daytraderph (I could not find the link to the original script, the page is inaccessible?):
www.tradingview.com
fract:
