PERFECT PIVOT RANGE DR ABIRAM SIVPRASAD (PPR)PERFECT PIVOT RANGE (PPR) by Dr. Abhiram Sivprasad
The Perfect Pivot Range (PPR) indicator is designed to provide traders with a comprehensive view of key support and resistance levels based on pivot points across different timeframes. This versatile tool allows users to visualize daily, weekly, and monthly pivots along with high and low levels from previous periods, helping traders identify potential areas of price reversals or breakouts.
Features:
Multi-Timeframe Pivots:
Daily, weekly, and monthly pivot levels (Pivot Point, Support 1 & 2, Resistance 1 & 2).
Helps traders understand price levels across various timeframes, from short-term (daily) to long-term (monthly).
Previous High-Low Levels:
Displays the previous week, month, and day high-low levels to highlight key zones of historical support and resistance.
Traders can easily see areas of price action from prior periods, giving context for future price movements.
Customizable Options:
Users can choose which pivot levels and high-lows to display, allowing for flexibility based on trading preferences.
Visual settings can be toggled on and off to suit different trading strategies and timeframes.
Real-Time Data:
All pivot points and levels are dynamically calculated based on real-time price data, ensuring accurate and up-to-date information for decision-making.
How to Use:
Pivot Points: Use daily, weekly, or monthly pivot points to find potential support or resistance levels. Prices above the pivot suggest bullish sentiment, while prices below indicate bearishness.
Previous High-Low: The high-low levels from previous days, weeks, or months can serve as critical zones where price may reverse or break through, indicating potential trade entries or exits.
Confluence: When pivot points or high-low levels overlap across multiple timeframes, they become even stronger levels of support or resistance.
This indicator is suitable for all types of traders (scalpers, swing traders, and long-term investors) looking to enhance their technical analysis and make more informed trading decisions.
Here are three detailed trading strategies for using the Perfect Pivot Range (PPR) indicator for options, stocks, and commodities:
1. Options Buying Strategy with PPR Indicator
Strategy: Buying Call and Put Options Based on Pivot Breakouts
Objective: To capitalize on sharp price movements when key pivot levels are breached, leading to high returns with limited risk in options trading.
Timeframe: 15-minute to 1-hour chart for intraday option trading.
Steps:
Identify the Key Levels:
Use weekly pivots for intraday trading, as they provide more significant levels for options.
Enable the "Previous Week High-Low" to gauge support and resistance from the previous week.
Call Option Setup (Bullish Breakout):
Condition: If the price breaks above the weekly pivot point (PP) with high momentum (indicated by a strong bullish candle), it signifies potential bullishness.
Action: Buy Call Options at the breakout of the weekly pivot.
Confirmation: Check if the price is sustaining above the pivot with a minimum of 1-2 candles (depending on timeframe) and the first resistance (R1) isn’t too far away.
Target: The first resistance (R1) or previous week’s high can be your target for exiting the trade.
Stop-Loss: Set a stop-loss just below the pivot point (PP) to limit risk.
Put Option Setup (Bearish Breakdown):
Condition: If the price breaks below the weekly pivot (PP) with strong bearish momentum, it’s a signal to expect a downward move.
Action: Buy Put Options on a breakdown below the weekly pivot.
Confirmation: Ensure that the price is closing below the pivot, and check for declining volumes or bearish candles.
Target: The first support (S1) or the previous week’s low.
Stop-Loss: Place the stop-loss just above the pivot point (PP).
Example:
Let’s say the weekly pivot point (PP) is at 1500, the price breaks above and sustains at 1510. You buy a Call Option with a strike price near 1500, and the target will be the first resistance (R1) at 1530.
2. Stock Trading Strategy with PPR Indicator
Strategy: Swing Trading Using Pivot Points and Previous High-Low Levels
Objective: To capture mid-term stock price movements using pivot points and historical high-low levels for better trade entries and exits.
Timeframe: 1-day or 4-hour chart for swing trading.
Steps:
Identify the Trend:
Start by determining the overall trend of the stock using the weekly pivots. If the price is consistently above the pivot point (PP), the trend is bullish; if below, the trend is bearish.
Buy Setup (Bullish Trend Reversal):
Condition: When the stock bounces off the weekly pivot point (PP) or previous week’s low, it signals a bullish reversal.
Action: Enter a long position near the pivot or previous week’s low.
Confirmation: Look for a bullish candle pattern or increasing volumes.
Target: Set your first target at the first resistance (R1) or the previous week’s high.
Stop-Loss: Place your stop-loss just below the previous week’s low or support (S1).
Sell Setup (Bearish Trend Reversal):
Condition: When the price hits the weekly resistance (R1) or previous week’s high and starts to reverse downwards, it’s an opportunity to short-sell the stock.
Action: Enter a short position near the resistance.
Confirmation: Watch for bearish candle patterns or decreasing volume at the resistance.
Target: Your first target would be the weekly pivot point (PP), with the second target as the previous week’s low.
Stop-Loss: Set a stop-loss just above the resistance (R1).
Use Previous High-Low Levels:
The previous week’s high and low are key levels where price reversals often occur, so use them as reference points for potential entry and exit.
Example:
Stock XYZ is trading at 200. The previous week’s low is 195, and it bounces off that level. You enter a long position with a target of 210 (previous week’s high) and place a stop-loss at 193.
3. Commodity Trading Strategy with PPR Indicator
Strategy: Trend Continuation and Reversal in Commodities
Objective: To capitalize on the strong trends in commodities by using pivot points as key support and resistance levels for trend continuation and reversal.
Timeframe: 1-hour to 4-hour charts for commodities like Gold, Crude Oil, Silver, etc.
Steps:
Identify the Trend:
Use monthly pivots for long-term commodities trading since commodities often follow macroeconomic trends.
The monthly pivot point (PP) will give an idea of the long-term trend direction.
Trend Continuation Setup (Bullish Commodity):
Condition: If the price is consistently trading above the monthly pivot and pulling back towards the pivot without breaking below it, it indicates a bullish continuation.
Action: Enter a long position when the price tests the monthly pivot (PP) and starts moving up again.
Confirmation: Look for a strong bullish candle or an increase in volume to confirm the continuation.
Target: The first resistance (R1) or previous month’s high.
Stop-Loss: Place the stop-loss below the monthly pivot (PP).
Trend Reversal Setup (Bearish Commodity):
Condition: When the price reverses from the monthly resistance (R1) or previous month’s high, it’s a signal for a bearish reversal.
Action: Enter a short position at the resistance level.
Confirmation: Watch for bearish candle patterns or decreasing volumes at the resistance.
Target: Set your first target as the monthly pivot (PP) or the first support (S1).
Stop-Loss: Stop-loss should be placed just above the resistance level.
Using Previous High-Low for Swing Trades:
The previous month’s high and low are important in commodities. They often act as barriers to price movement, so traders should look for breakouts or reversals near these levels.
Example:
Gold is trading at $1800, with a monthly pivot at $1780 and the previous month’s high at $1830. If the price pulls back to $1780 and starts moving up again, you enter a long trade with a target of $1830, placing your stop-loss below $1770.
Key Points Across All Strategies:
Multiple Timeframes: Always use a combination of timeframes for confirmation. For example, a daily chart may show a bullish setup, but the weekly pivot levels can provide a larger trend context.
Volume: Volume is key in confirming the strength of price movement. Always confirm breakouts or reversals with rising or declining volume.
Risk Management: Set tight stop-loss levels just below support or above resistance to minimize risk and lock in profits at pivot points.
Each of these strategies leverages the powerful pivot and high-low levels provided by the PPR indicator to give traders clear entry, exit, and risk management points across different markets
חפש סקריפטים עבור "Oil"

Season ChartThis overlay is built on the idea of seasonal charts.
It is constructed by taking the percentage change from each close and recording that change for every trading day of any year that is within the sample. We then take the average for each day of all the years.
These averages are then cumulated to create the chart as per traditional seasonal chart construction.
I have also taken a trimmed mean of the averages to try and dampen the impact one off moves that may have a dramatic effect on the daily averages (for example the crash to $0 in oil in April 2020) however, even removing 10% may not guarantee one off moves won’t affect the average.
The construction of the chart is completely dependent on the data provided by TradingView and so it is recommended that if longer sample sizes are used, the user go back to check that the years contained within the sample have a full history. Some data may have large gaps in their history and this can distort the seasonality readings.
I have attempted to align the chart with the first trading day of the year, but the start of some months may be out by a day or two as it becomes difficult to track all weeks with differing market holidays closures each year and this in turn varies the total amount of actual trading days in each year as well as leap years.
This overlay is designed for the Daily time frame only and will not work on Crypto or any other instrument that trades outside of usual business weekdays. Future updates may include the ability to adapt to Crypto instruments.
All feedback and comments welcome!

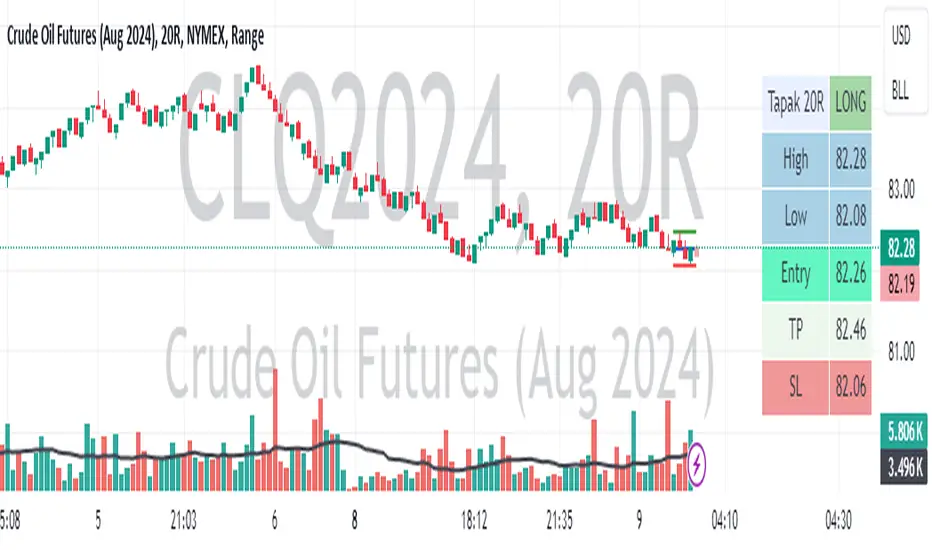
Tapak 20RThis strategy originally developed by Jatrader. Kudos to him for giving me chance to develop this indicator.
This script should be use Light Crude Oil Futures 20 Range chart. (This strategy only proven for 20R range chart, Crude Oil.)
How it works?
If current 20R candle is closed green, the closing value must be higher than previous candle to take long position.
If not, it stays as previous direction.
If current candle is closed red, the closing value must be lower than previous candle to take short position.
If not, it stays as previous direction.
How to use this indicator?
1. First, determine the stoploss point from high or low candle.(if current candle is green, stoploss is set higher than high candle and vice versa)
2. Determine how many tick you want to allowed for stoploss, how much profit (ticks) you want to achieve.
3. Determine the color and thickness of each line.
The table will display all value involved with this strategy such as entry value, stoploss value and target profit value.
Please kept in mind that, this is scalping strategy. So, the recommended target profit should be around 10 - 20 ticks.
Thank you.
KillZones + ACD Fisher [TradingFinder] Sessions + Reversal Level🔵 Introduction
🟣 ACD Method
"The Logical Trader" opens with a thorough exploration of the ACD Methodology, which focuses on pinpointing particular price levels associated with the opening range.
This approach enables traders to establish reference points for their trades, using "A" and "C" points as entry markers. Additionally, the book covers the concept of the "Pivot Range" and how integrating it with the ACD method can help maximize position size while minimizing risk.
🟣 Session
The forex market is operational 24 hours a day, five days a week, closing only on Saturdays and Sundays. Typically, traders prefer to concentrate on one specific forex trading session rather than attempting to trade around the clock.
Trading sessions are defined time periods when a particular financial market is active, allowing for the execution of trades.
The most crucial trading sessions within the 24-hour cycle are the Asia, London, and New York sessions, as these are when substantial money flows and liquidity enter the market.
🟣 Kill Zone
Traders in financial markets earn profits by capitalizing on the difference between their buy/sell prices and the prevailing market prices.
Traders vary in their trading timelines.Some traders engage in daily or even hourly trading, necessitating activity during periods with optimal trading volumes and notable price movements.
Kill zones refer to parts of a session characterized by higher trading volumes and increased price volatility compared to the rest of the session.
🔵 How to Use
🟣 Session Times
The "Asia Session" comprises two parts: "Sydney" and "Tokyo." This session begins at 23:00 and ends at 06:00 UTC. The "Asia KillZone" starts at 23:00 and ends at 03:55 UTC.
The "London Session" includes "Frankfurt" and "London," starting at 07:00 and ending at 14:25 UTC. The "London KillZone" runs from 07:00 to 09:55 UTC.
The "New York" session starts at 14:30 and ends at 19:25 UTC, with the "New York am KillZone" beginning at 14:30 and ending at 22:55 UTC.
🟣 ACD Methodology
The ACD strategy is versatile, applicable to various markets such as stocks, commodities, and forex, providing clear buy and sell signals to set price targets and stop losses.
This strategy operates on the premise that the opening range of trades holds statistical significance daily, suggesting that initial market movements impact the market's behavior throughout the day.
Known as a breakout strategy, the ACD method thrives in volatile or strongly trending markets like crude oil and stocks.
Some key rules for employing the ACD strategy include :
Utilize points A and C as critical reference points, continually monitoring these during trades as they act as entry and exit markers.
Analyze daily and multi-day pivot ranges to understand market trends. Prices above the pivots indicate an upward trend, while prices below signal a downward trend.
In forex trading, the ACD strategy can be implemented using the ACD indicator, a technical tool that gauges the market's supply and demand balance. By evaluating trading volume and price, this indicator assists traders in identifying trend strength and optimal entry and exit points.
To effectively use the ACD indicator, consider the following :
Identifying robust trends: The ACD indicator can help pinpoint strong, consistent market trends.
Determining entry and exit points: ACD generates buy and sell signals to optimize trade timing.
Bullish Setup :
When the "A up" line is breached, it’s wise to wait briefly to confirm it’s not a "Fake Breakout" and that the price stabilizes above this line.
Upon entering the trade, the most effective stop loss is positioned below the "A down" line. It's advisable to backtest this to ensure the best outcomes. The recommended reward-to-risk ratio for this strategy is 1, which should also be verified through backtesting.
Bearish Setup :
When the "A down" line is breached, it’s prudent to wait briefly to ensure it’s not a "Fake Breakout" and that the price stabilizes below this line.
Upon entering the trade, the most effective stop loss is positioned above the "A up" line. Backtesting is recommended to confirm the best results. The recommended reward-to-risk ratio for this strategy is 1, which should also be validated through backtesting.
Advantages of Combining Kill Zone and ACD Method in Market Analysis :
Precise Trade Timing : Integrating the Kill Zone strategy with the ACD Method enhances precision in trade entries and exits. The ACD Method identifies key points for trading, while the Kill Zone focuses on high-activity periods, together ensuring optimal timing for trades.
Better Trend Identification : The ACD Method’s pivot ranges help spot market trends, and when combined with the Kill Zone’s emphasis on periods of significant price movement, traders can more effectively identify and follow strong market trends.
Maximized Profits and Minimized Risks : The ACD Method's structured approach to setting price targets and stop losses, coupled with the Kill Zone's high-volume trading periods, helps maximize profit potential while reducing risk.
Robust Risk Management : Combining these methods provides a comprehensive risk management strategy, strategically placing stop losses and protecting capital during volatile periods.
Versatility Across Markets : Both methods are applicable to various markets, including stocks, commodities, and forex, offering flexibility and adaptability in different trading environments.
Enhanced Confidence : Using the combined insights of the Kill Zone and ACD Method, traders gain confidence in their decision-making process, reducing emotional trading and improving consistency.
By merging the Kill Zone’s focus on trading volumes and the ACD Method’s structured breakout strategy, traders benefit from a synergistic approach that enhances precision, trend identification, and risk management across multiple markets.

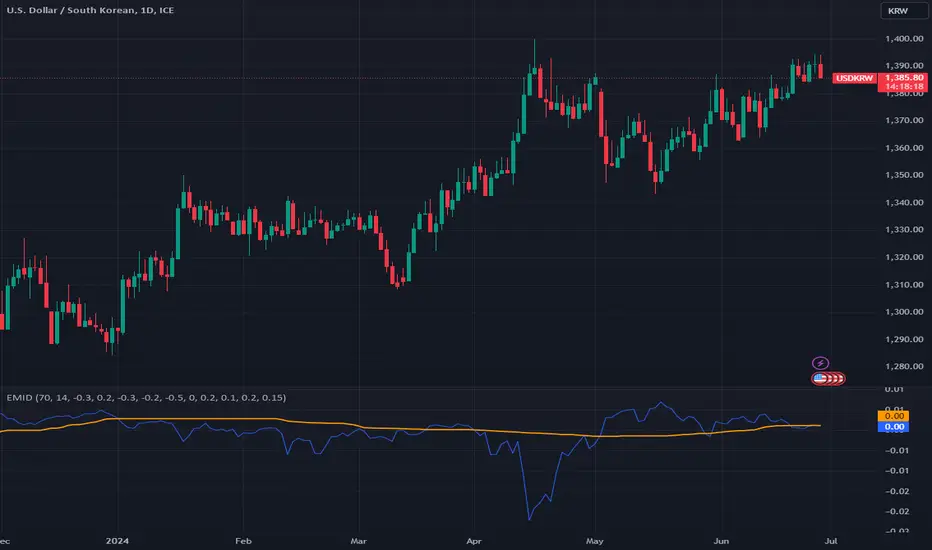
Enhanced Market Influence DashboardDescription
The "Enhanced Market Influence Dashboard" (EMID) is a sophisticated trading indicator developed in Pine Script, designed to provide traders with a comprehensive view of the market's influences by analyzing a diverse set of financial instruments. This script integrates various market data, calculates dynamic weights based on volatility, and combines them into a composite score to help traders identify significant market movements.
Concept and Methodology
The EMID indicator aggregates data from multiple financial instruments, including forex pairs, commodities, indices, and ETFs. By calculating the median and volatility of these instruments over user-defined timelines, it dynamically adjusts their weights to reflect current market conditions. The composite score generated from these weighted values helps traders understand the overall market influence and detect significant movements.
Key Features
Market Data Integration: The script fetches real-time data from various symbols such as USD/JPY, Gold, Dollar Index (DXY), US Treasury Rate, VIX Index, Crude Oil, EUR/USD, Emerging Market Index, QYLD ETF, and Nasdaq 100 Futures.
1. Dynamic Weight Calculation: The script calculates dynamic weights for each instrument based on their volatility relative to their simple moving average. This approach ensures that more volatile instruments have a proportionally higher impact on the composite score.
2. Median and Volatility Analysis: It uses the median value and standard deviation over specified timelines to gauge the central tendency and volatility of each instrument.
3. Composite Score Generation: By normalizing the difference between current prices and their respective medians, and applying dynamic weights, the script generates a composite score that reflects the overall market sentiment.
4. Baseline Calculation: A dynamic baseline is computed as the median of the composite score over the lookback period, providing a reference point for identifying significant deviations.
5. Alerts: The script includes alert conditions to notify traders of significant market movements, either above or below the baseline by a threshold value.
Usage
To use the EMID indicator, follow these steps:
1. Input Configuration: Adjust the input parameters to suit your trading strategy. The key inputs include:
-Median Timeline: The period for calculating the median values.
-Volatility Timeline: The period for calculating volatility.
-Base Weights: Set the base weights for each financial instrument according to their perceived influence on the market.
-Adding the Indicator: Apply the EMID indicator to your chart in TradingView. Ensure that the symbols used in the script are relevant to your trading strategy and available in your TradingView subscription.
2. Interpreting the Composite Score: The composite score plotted on the chart gives an aggregated view of market influences. Compare the composite score with the baseline to identify significant market movements.
-A composite score significantly above the baseline indicates a potential market uptrend.
-A composite score significantly below the baseline indicates a potential market downtrend.
-Setting Alerts: Use the alert conditions to set up notifications for significant market movements. These alerts help you stay informed about critical changes in market sentiment.
Underlying Calculations
1. Median Calculation: The median function is applied to each instrument's price data over the specified timeline.
2. Volatility Calculation: Volatility is calculated as the standard deviation divided by the simple moving average over the volatility timeline.
3. Dynamic Weight Application: Base weights are multiplied by the respective volatility values to get dynamic weights.
4. Normalized Scores: The script normalizes the difference between current prices and their medians, then multiplies by the dynamic weights to get individual scores.
5. Composite Score: Summing all normalized and weighted scores results in the composite score.
6. Baseline: The baseline is the median of the composite score over the median timeline.
By integrating multiple market influences and dynamically adjusting weights based on volatility, the EMID indicator provides a robust tool for traders to analyze market conditions and make informed trading decisions.
ACD Indicator [TradingFinder] M Fisher Pivots Methodology Signal🔵 Introduction
The book "The Logical Trader" begins with a comprehensive review of the ACD Methodology principles, which include identifying specific price points related to the opening range.
This method allows you to set reference points for trading and use points "A" and "C" for trade entry. You will also learn about the "Pivot Range" and how to combine them with the ACD method to maximize position size and minimize risk.
In this indicator, the strategy is implemented to make it easier to use.
🔵 How to Use
The "ACD" strategy can be applied to various markets such as stocks, commodities, or forex, providing buy and sell signals that allow you to set your price targets and stop losses.
This strategy is based on the assumption that the opening range of trades is statistically significant each day, meaning the initial market fluctuations influence the market until the end of the day.
The ACD trading strategy is known as a breakout strategy and performs best in volatile or strongly trending markets, such as crude oil and stocks.
Some of the rules for using the ACD strategy include the following :
Consider points A and C as reference points and continuously pay attention to these points during trades. These points serve as entry and exit points for trades.
Examine daily and multi-day pivot ranges to analyze market trends. If the price is above the pivots, the trend is upward, and if below the pivots, the trend is downward.
Trading with the ACD strategy in forex is possible using the ACD indicator. This indicator is a technical tool used to measure the balance between supply and demand in the market. By analyzing trading volume and price, this indicator helps traders identify trend strength and suitable entry and exit points.
To use the ACD indicator, consider the following :
Identifying strong trends: The ACD indicator can help you identify strong and stable trends in the market.
Determining entry and exit points: ACD provides buy and sell signals to enter or exit trades at the best possible time.
Bullish Setup :
When the "A up" line is broken, it is advisable to wait for some time to ensure that this is not a "Fake Breakout" and that the price stabilizes above this line.
After entering the trade, the best stop loss you can choose is below the "A down" line. However, it is recommended to test this in backtests to achieve the best results. The suitable reward-to-risk ratio for this strategy is 1, which should also be backtested.
Bearish Setup :
When the "A down" line is broken, it is advisable to wait for some time to ensure that this is not a "Fake Breakout" and that the price stabilizes below this line.
After entering the trade, the best stop loss you can choose is above the "A up" line. However, it is recommended to test this in backtests to achieve the best results. The suitable reward-to-risk ratio for this strategy is 1, which should also be backtested.
🔵 Setting
NDay Pivot Range Period : Using this entry you can specify the number of days to calculate NDay Pivot Range.
Show Daily Pivot Range : Set the Daily Pivot color and displayed or not.
Show NDay Pivot Range : Set the NDay Pivot color and displayed or not.
ATR Period Levels : Determining the period of the ATR indicator, which is used to determine the A and C levels.
Show Tokyo ACD Setup : Set the Tokyo ACD Setup color and displayed or not.
Tokyo Opening Range Time : The amount of time taken to determine the opening range. You can set this number between 5 and 60 minutes.
Tokyo Session : Market start and end time.
A Level Multiplier : The coefficient that is multiplied by ATR to determine the distance of line A up and A down.
C Level Multiplier : The coefficient that is multiplied by ATR to determine the distance of line C up and C down.
The same settings exist for the London and New York sessions.

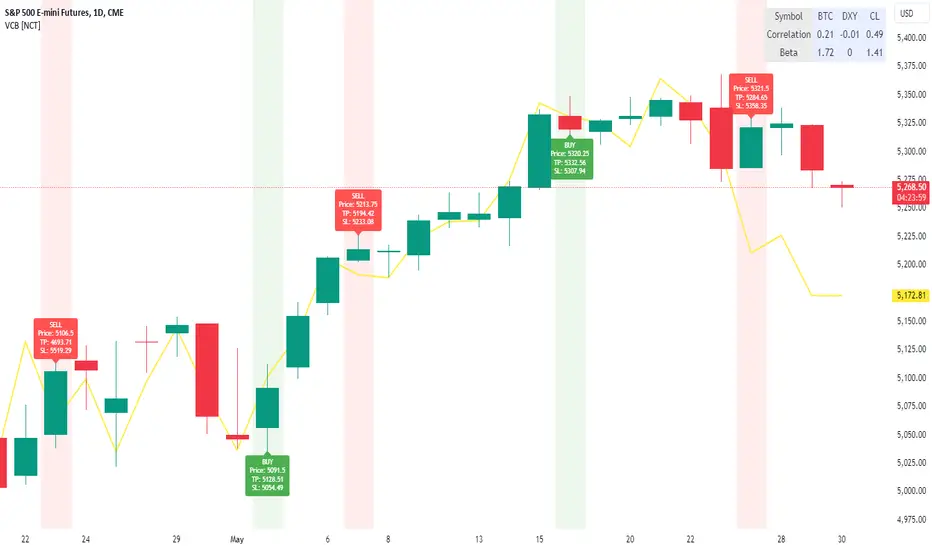
VolCorrBeta [NariCapitalTrading]Indicator Overview: VolCorrBeta
The VolCorrBeta indicator is designed to analyze and interpret intermarket relationships. This indicator combines volatility, correlation, and beta calculations to provide a comprehensive view of how certain assets (BTC, DXY, CL) influence the ES futures contract (I tailored this indicator to the ES contract, but it will work for any symbol).
Functionality
Input Symbols
BTCUSD : Bitcoin to USD
DXY : US Dollar Index
CL1! : Crude Oil Futures
ES1! : S&P 500 Futures
These symbols can be customized according to user preferences. The main focus of the indicator is to analyze how the price movements of these assets correlate with and lead the price movements of the ES futures contract.
Parameters for Calculation
Correlation Length : Number of periods for calculating the correlation.
Standard Deviation Length : Number of periods for calculating the standard deviation.
Lookback Period for Beta : Number of periods for calculating beta.
Volatility Filter Length : Length of the volatility filter.
Volatility Threshold : Threshold for adjusting the lookback period based on volatility.
Key Calculations
Returns Calculation : Computes the daily returns for each input symbol.
Correlation Calculation : Computes the correlation between each input symbol's returns and the ES futures contract returns over the specified correlation length.
Standard Deviation Calculation : Computes the standard deviation for each input symbol's returns and the ES futures contract returns.
Beta Calculation : Computes the beta for each input symbol relative to the ES futures contract.
Weighted Returns Calculation : Computes the weighted returns based on the calculated betas.
Lead-Lag Indicator : Calculates a lead-lag indicator by averaging the weighted returns.
Volatility Filter : Smooths the lead-lag indicator using a simple moving average.
Price Target Estimation : Estimates the ES price target based on the lead-lag indicator (the yellow line on the chart).
Dynamic Stop Loss (SL) and Take Profit (TP) Levels : Calculates dynamic SL and TP levels using volatility bands.
Signal Generation
The indicator generates buy and sell signals based on the filtered lead-lag indicator and confirms them using higher timeframe analysis. Signals are debounced to reduce frequency, ensuring that only significant signals are considered.
Visualization
Background Coloring : The background color changes based on the buy and sell signals for easy visualization (user can toggle this on/off).
Signal Labels : Labels with arrows are plotted on the chart, showing the signal type (buy/sell), the entry price, TP, and SL levels.
Estimated ES Price Target : The estimated price target for ES futures is plotted on the chart.
Correlation and Beta Dashboard : A table displayed in the top right corner shows the current correlation and beta values for relative to the ES futures contract.
Customization
Traders can customize the following parameters to tailor the indicator to their specific needs:
Input Symbols : Change the symbols for BTC, DXY, CL, and ES.
Correlation Length : Adjust the number of periods used for calculating correlation.
Standard Deviation Length : Adjust the number of periods used for calculating standard deviation.
Lookback Period for Beta : Change the lookback period for calculating beta.
Volatility Filter Length : Modify the length of the volatility filter.
Volatility Threshold : Set a threshold for adjusting the lookback period based on volatility.
Plotting Options : Customize the colors and line widths of the plotted elements.
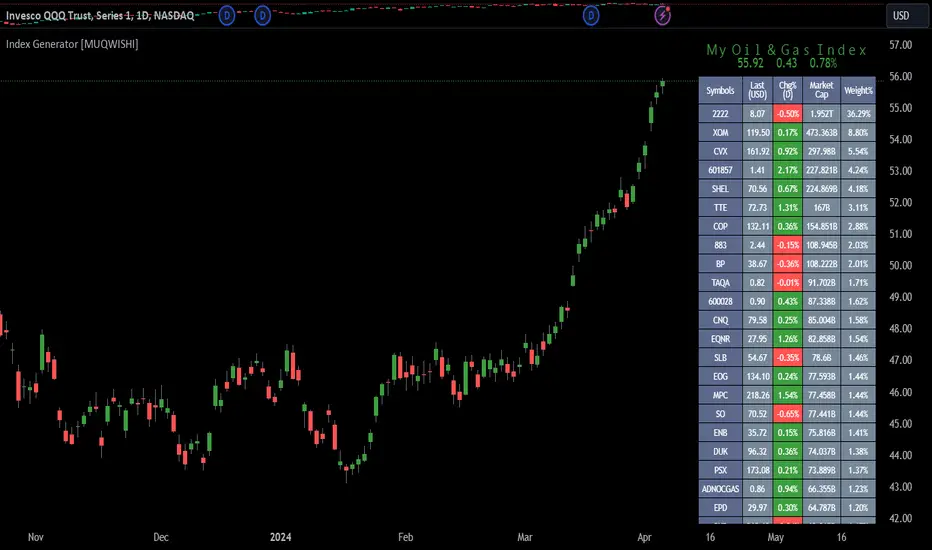
Index Generator [By MUQWISHI]▋ INTRODUCTION :
The “Index Generator” simplifies the process of building a custom market index, allowing investors to enter a list of preferred holdings from global securities. It aims to serve as an approach for tracking performance, conducting research, and analyzing specific aspects of the global market. The output will include an index value, a table of holdings, and chart plotting, providing a deeper understanding of historical movement.
_______________________
▋ OVERVIEW:
The image can be taken as an example of building a custom index. I created this index and named it “My Oil & Gas Index”. The index comprises several global energy companies. Essentially, the indicator weights each company by collecting the number of shares and then computes the market capitalization before sorting them as seen in the table.
_______________________
▋ OUTPUTS:
The output can be divided into 3 sections:
1. Index Title (Name & Value).
2. Index Holdings.
3. Index Chart.
1. Index Title , displays the index name at the top, and at the bottom, it shows the index value, along with the daily change in points and percentage.
2. Index Holdings , displays list the holding securities inside a table that contains the ticker, price, daily change %, market cap, and weight %. Additionally, a tooltip appears when the user passes the cursor over a ticker's cell, showing brief information about the company, such as the company's name, exchange market, country, sector, and industry.
3. Index Chart , display a plot of the historical movement of the index in the form of a bar, candle, or line chart.
_______________________
▋ INDICATOR SETTINGS:
(1) Naming the index.
(2) Entering a currency. To unite all securities in one currency.
(3) Table location on the chart.
(4) Table’s cells size.
(5) Table’s colors.
(6) Sorting table. By securities’ (Market Cap, Change%, Price, or Ticker Alphabetical) order.
(7) Plotting formation (Candle, Bar, or Line)
(8) To show/hide any indicator’s components.
(9) There are 34 fields where user can fill them with symbols.
Please let me know if you have any questions.
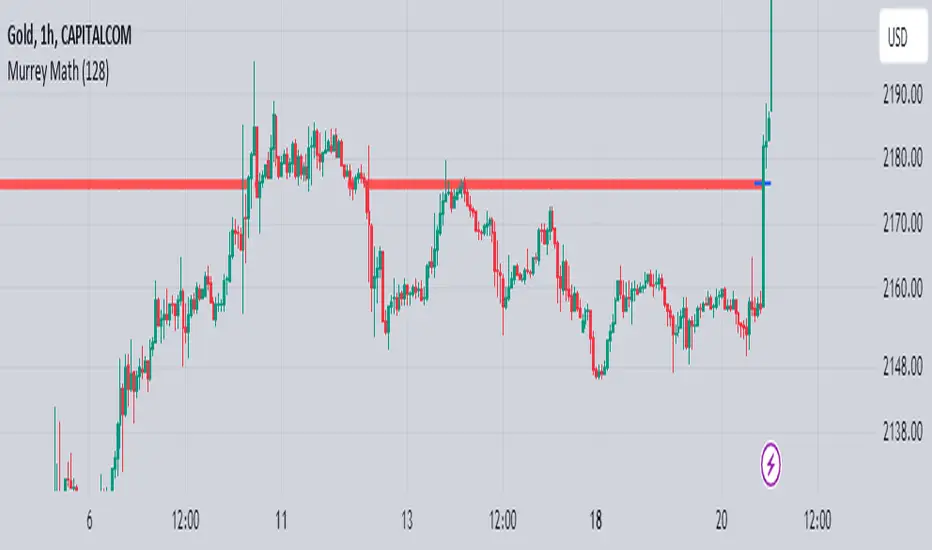
Murrey Math
The Murrey Math indicator is a set of horizontal price levels, calculated from an algorithm developed by stock trader T.J. Murray.
The main concept behind Murrey Math is that prices tend to react and rotate at specific price levels. These levels are calculated by dividing the price range into fixed segments called "ranges", usually using a number of 8, 16, 32, 64, 128 or 256.
Murrey Math levels are calculated as follows:
1. A particular price range is taken, for example, 128.
2. Divide the current price by the range (128 in this example).
3. The result is rounded to the nearest whole number.
4. Multiply that whole number by the original range (128).
This results in the Murrey Math level closest to the current price. More Murrey levels are calculated and drawn by adding and subtracting multiples of the range to the initially calculated level.
Traders use Murrey Math levels as areas of possible support and resistance as it is believed that prices tend to react and pivot at these levels. They are also used to identify price patterns and possible entry and exit points in trading.
The Murrey Math indicator itself simply calculates and draws these horizontal levels on the price chart, allowing traders to easily visualize them and use them in their technical analysis.
HOW TO USE THIS INDICATOR?
To use the Murrey Math indicator effectively, here are some tips:
1. Choose the appropriate Murrey Math range : The Murrey Math range input (128 by default in the provided code) determines the spacing between the levels. Common ranges used are 8, 16, 32, 64, 128, and 256. A smaller range will give you more levels, while a larger range will give you fewer levels. Choose a range that suits the volatility and trading timeframe you're working with.
2. Identify potential support and resistance levels: The horizontal lines drawn by the indicator represent potential support and resistance levels based on the Murrey Math calculation. Prices often react or reverse at these levels, so they can be used to spot areas of interest for entries and exits.
3. Look for price reactions at the levels: Watch for price action like rejections, bounces, or breakouts at the Murrey Math levels. These reactions can signal potential trend continuation or reversal setups.
4. Trail stop-loss orders: You can place stop-loss orders just below/above the nearest Murrey Math level to manage risk if the price moves against your trade.
5. Set targets at future levels: Project potential profit targets by looking at upcoming Murrey Math levels in the direction of the trend.
7. Adjust range as needed: If prices are consistently breaking through levels without reacting, try adjusting the range input to a different value to see if it provides better levels.
In which asset can this indicator perform better?
The Murrey Math indicator can potentially perform well on any liquid financial asset that exhibits some degree of mean-reversion or trading range behavior. However, it may be more suitable for certain asset classes or trading timeframes than others.
Here are some assets and scenarios where the Murrey Math indicator can potentially perform better:
1. Forex Markets: The foreign exchange market is known for its ranging and mean-reverting nature, especially on higher timeframes like the daily or weekly charts. The Murrey Math levels can help identify potential support and resistance levels within these trading ranges.
2. Futures Markets: Futures contracts, such as those for commodities (e.g., crude oil, gold, etc.) or equity indices, often exhibit trading ranges and mean-reversion trends. The Murrey Math indicator can be useful in identifying potential turning points within these ranges.
3. Stocks with Range-bound Behavior: Some stocks, particularly those of large-cap companies, can trade within well-defined ranges for extended periods. The Murrey Math levels can help identify the boundaries of these ranges and potential reversal points.
4. I ntraday Trading: The Murrey Math indicator may be more effective on lower timeframes (e.g., 1-hour, 30-minute, 15-minute) for intraday trading, as prices tend to respect support and resistance levels more closely within shorter time periods.
5. Trending Markets: While the Murrey Math indicator is primarily designed for range-bound markets, it can also be used in trending markets to identify potential pullback or continuation levels.
Pairs strategyHello, Tradingview community,
I am been playing with this idea that nowadays trading instruments are interconnected and when one goes too far "out of order" it should return to the mean.
So, here's a relatively simple idea.
This is a LONG-ONLY strategy.
Buy when your traded instrument's last bar closes down, and the comparing instrument closes up.
Sell when close is higher than the previous bar's high.
Best results I found with medium timeframes: 45min, 120min, 180min.
Also, feel free to test non-typical timeframes such as 59min, 119min, 179min, etc.
My reasoning for medium timeframes would be, that they are big enough to avoid "market noise"
of smaller timeframes + commissions & slippage is less negligible, and small enough to avoid exposure of higher timeframes, although, I haven't tested D timeframe and above.
The best results, I found were with instruments that aren't directly correlated. I mostly tested equities and equity futures, so for equity indexes, equity index futures, or large-cap stocks, NASDAQ:SMH , NASDAQ:NVDA , EURUSD, and Crude Oil would be a good candidate for comparing symbols.
When testing either futures or stocks, please adjust the commission for each asset, for stocks I use % equity, so it compounds over time, whereas, for futures, I use 1 contract all the time.
Here's NASDAQ:MSFT on 119min chart
Here's AMEX:SPY on 59min chart using NASDAQ:NVDA as comparison
Here's CME_MINI:ES1! on 179min chart using NYMEX:CL1! as comparison
To change comparison symbol just insert your symbol between the brackets on both fields down here.
SymbolClose = request.security("YOUR SYMBOL HERE", timeframe.period, close)
SymbolOpen = request.security("YOUR SYMBOL HERE", timeframe.period, open)
Since I am still relatively new to testing, hence, I am publishing this idea, so you can point out some crucial things I may have missed.
Thanks,
Enjoy the strategy!

Supertrend Advance Pullback StrategyHandbook for the Supertrend Advance Strategy
1. Introduction
Purpose of the Handbook:
The main purpose of this handbook is to serve as a comprehensive guide for traders and investors who are looking to explore and harness the potential of the Supertrend Advance Strategy. In the rapidly changing financial market, having the right tools and strategies at one's disposal is crucial. Whether you're a beginner hoping to dive into the world of trading or a seasoned investor aiming to optimize and diversify your portfolio, this handbook offers the insights and methodologies you need. By the end of this guide, readers should have a clear understanding of how the Supertrend Advance Strategy works, its benefits, potential pitfalls, and practical application in various trading scenarios.
Overview of the Supertrend Advance Pullback Strategy:
At its core, the Supertrend Advance Strategy is an evolution of the popular Supertrend Indicator. Designed to generate buy and sell signals in trending markets, the Supertrend Indicator has been a favorite tool for many traders around the world. The Advance Strategy, however, builds upon this foundation by introducing enhanced mechanisms, filters, and methodologies to increase precision and reduce false signals.
1. Basic Concept:
The Supertrend Advance Strategy relies on a combination of price action and volatility to determine the potential trend direction. By assessing the average true range (ATR) in conjunction with specific price points, this strategy aims to highlight the potential starting and ending points of market trends.
2. Methodology:
Unlike the traditional Supertrend Indicator, which primarily focuses on closing prices and ATR, the Advance Strategy integrates other critical market variables, such as volume, momentum oscillators, and perhaps even fundamental data, to validate its signals. This multidimensional approach ensures that the generated signals are more reliable and are less prone to market noise.
3. Benefits:
One of the main benefits of the Supertrend Advance Strategy is its ability to filter out false breakouts and minor price fluctuations, which can often lead to premature exits or entries in the market. By waiting for a confluence of factors to align, traders using this advanced strategy can increase their chances of entering or exiting trades at optimal points.
4. Practical Applications:
The Supertrend Advance Strategy can be applied across various timeframes, from intraday trading to swing trading and even long-term investment scenarios. Furthermore, its flexible nature allows it to be tailored to different asset classes, be it stocks, commodities, forex, or cryptocurrencies.
In the subsequent sections of this handbook, we will delve deeper into the intricacies of this strategy, offering step-by-step guidelines on its application, case studies, and tips for maximizing its efficacy in the volatile world of trading.
As you journey through this handbook, we encourage you to approach the Supertrend Advance Strategy with an open mind, testing and tweaking it as per your personal trading style and risk appetite. The ultimate goal is not just to provide you with a new tool but to empower you with a holistic strategy that can enhance your trading endeavors.
2. Getting Started
Navigating the financial markets can be a daunting task without the right tools. This section is dedicated to helping you set up the Supertrend Advance Strategy on one of the most popular charting platforms, TradingView. By following the steps below, you'll be able to integrate this strategy into your charts and start leveraging its insights in no time.
Setting up on TradingView:
TradingView is a web-based platform that offers a wide range of charting tools, social networking, and market data. Before you can apply the Supertrend Advance Strategy, you'll first need a TradingView account. If you haven't set one up yet, here's how:
1. Account Creation:
• Visit TradingView's official website.
• Click on the "Join for free" or "Sign up" button.
• Follow the registration process, providing the necessary details and setting up your login credentials.
2. Navigating the Dashboard:
• Once logged in, you'll be taken to your dashboard. Here, you'll see a variety of tools, including watchlists, alerts, and the main charting window.
• To begin charting, type in the name or ticker of the asset you're interested in the search bar at the top.
3. Configuring Chart Settings:
• Before integrating the Supertrend Advance Strategy, familiarize yourself with the chart settings. This can be accessed by clicking the 'gear' icon on the top right of the chart window.
• Adjust the chart type, time intervals, and other display settings to your preference.
Integrating the Strategy into a Chart:
Now that you're set up on TradingView, it's time to integrate the Supertrend Advance Strategy.
1. Accessing the Pine Script Editor:
• Located at the top-center of your screen, you'll find the "Pine Editor" tab. Click on it.
• This is where custom strategies and indicators are scripted or imported.
2. Loading the Supertrend Advance Strategy Script:
• Depending on whether you have the script or need to find it, there are two paths:
• If you have the script: Copy the Supertrend Advance Strategy script, and then paste it into the Pine Editor.
• If searching for the script: Click on the “Indicators” icon (looks like a flame) at the top of your screen, and then type “Supertrend Advance Strategy” in the search bar. If available, it will show up in the list. Simply click to add it to your chart.
3. Applying the Strategy:
• After pasting or selecting the Supertrend Advance Strategy in the Pine Editor, click on the “Add to Chart” button located at the top of the editor. This will overlay the strategy onto your main chart window.
4. Configuring Strategy Settings:
• Once the strategy is on your chart, you'll notice a small settings ('gear') icon next to its name in the top-left of the chart window. Click on this to access settings.
• Here, you can adjust various parameters of the Supertrend Advance Strategy to better fit your trading style or the specific asset you're analyzing.
5. Interpreting Signals:
• With the strategy applied, you'll now see buy/sell signals represented on your chart. Take time to familiarize yourself with how these look and behave over various timeframes and market conditions.
3. Strategy Overview
What is the Supertrend Advance Strategy?
The Supertrend Advance Strategy is a refined version of the classic Supertrend Indicator, which was developed to aid traders in spotting market trends. The strategy utilizes a combination of data points, including average true range (ATR) and price momentum, to generate buy and sell signals.
In essence, the Supertrend Advance Strategy can be visualized as a line that moves with the price. When the price is above the Supertrend line, it indicates an uptrend and suggests a potential buy position. Conversely, when the price is below the Supertrend line, it hints at a downtrend, suggesting a potential selling point.
Strategy Goals and Objectives:
1. Trend Identification: At the core of the Supertrend Advance Strategy is the goal to efficiently and consistently identify prevailing market trends. By recognizing these trends, traders can position themselves to capitalize on price movements in their favor.
2. Reducing Noise: Financial markets are often inundated with 'noise' - short-term price fluctuations that can mislead traders. The Supertrend Advance Strategy aims to filter out this noise, allowing for clearer decision-making.
3. Enhancing Risk Management: With clear buy and sell signals, traders can set more precise stop-loss and take-profit points. This leads to better risk management and potentially improved profitability.
4. Versatility: While primarily used for trend identification, the strategy can be integrated with other technical tools and indicators to create a comprehensive trading system.
Type of Assets/Markets to Apply the Strategy:
1. Equities: The Supertrend Advance Strategy is highly popular among stock traders. Its ability to capture long-term trends makes it particularly useful for those trading individual stocks or equity indices.
2. Forex: Given the 24-hour nature of the Forex market and its propensity for trends, the Supertrend Advance Strategy is a valuable tool for currency traders.
3. Commodities: Whether it's gold, oil, or agricultural products, commodities often move in extended trends. The strategy can help in identifying and capitalizing on these movements.
4. Cryptocurrencies: The volatile nature of cryptocurrencies means they can have pronounced trends. The Supertrend Advance Strategy can aid crypto traders in navigating these often tumultuous waters.
5. Futures & Options: Traders and investors in derivative markets can utilize the strategy to make more informed decisions about contract entries and exits.
It's important to note that while the Supertrend Advance Strategy can be applied across various assets and markets, its effectiveness might vary based on market conditions, timeframe, and the specific characteristics of the asset in question. As always, it's recommended to use the strategy in conjunction with other analytical tools and to backtest its effectiveness in specific scenarios before committing to trades.
4. Input Settings
Understanding and correctly configuring input settings is crucial for optimizing the Supertrend Advance Strategy for any specific market or asset. These settings, when tweaked correctly, can drastically impact the strategy's performance.
Grouping Inputs:
Before diving into individual input settings, it's important to group similar inputs. Grouping can simplify the user interface, making it easier to adjust settings related to a specific function or indicator.
Strategy Choice:
This input allows traders to select from various strategies that incorporate the Supertrend indicator. Options might include "Supertrend with RSI," "Supertrend with MACD," etc. By choosing a strategy, the associated input settings for that strategy become available.
Supertrend Settings:
1. Multiplier: Typically, a default value of 3 is used. This multiplier is used in the ATR calculation. Increasing it makes the Supertrend line further from prices, while decreasing it brings the line closer.
2. Period: The number of bars used in the ATR calculation. A common default is 7.
EMA Settings (Exponential Moving Average):
1. Period: Defines the number of previous bars used to calculate the EMA. Common periods are 9, 21, 50, and 200.
2. Source: Allows traders to choose which price (Open, Close, High, Low) to use in the EMA calculation.
RSI Settings (Relative Strength Index):
1. Length: Determines how many periods are used for RSI calculation. The standard setting is 14.
2. Overbought Level: The threshold at which the asset is considered overbought, typically set at 70.
3. Oversold Level: The threshold at which the asset is considered oversold, often at 30.
MACD Settings (Moving Average Convergence Divergence):
1. Short Period: The shorter EMA, usually set to 12.
2. Long Period: The longer EMA, commonly set to 26.
3. Signal Period: Defines the EMA of the MACD line, typically set at 9.
CCI Settings (Commodity Channel Index):
1. Period: The number of bars used in the CCI calculation, often set to 20.
2. Overbought Level: Typically set at +100, denoting overbought conditions.
3. Oversold Level: Usually set at -100, indicating oversold conditions.
SL/TP Settings (Stop Loss/Take Profit):
1. SL Multiplier: Defines the multiplier for the average true range (ATR) to set the stop loss.
2. TP Multiplier: Defines the multiplier for the average true range (ATR) to set the take profit.
Filtering Conditions:
This section allows traders to set conditions to filter out certain signals. For example, one might only want to take buy signals when the RSI is below 30, ensuring they buy during oversold conditions.
Trade Direction and Backtest Period:
1. Trade Direction: Allows traders to specify whether they want to take long trades, short trades, or both.
2. Backtest Period: Specifies the time range for backtesting the strategy. Traders can choose from options like 'Last 6 months,' 'Last 1 year,' etc.
It's essential to remember that while default settings are provided for many of these tools, optimal settings can vary based on the market, timeframe, and trading style. Always backtest new settings on historical data to gauge their potential efficacy.
5. Understanding Strategy Conditions
Developing an understanding of the conditions set within a trading strategy is essential for traders to maximize its potential. Here, we delve deep into the logic behind these conditions, using the Supertrend Advance Strategy as our focal point.
Basic Logic Behind Conditions:
Every strategy is built around a set of conditions that provide buy or sell signals. The conditions are based on mathematical or statistical methods and are rooted in the study of historical price data. The fundamental idea is to recognize patterns or behaviors that have been profitable in the past and might be profitable in the future.
Buy and Sell Conditions:
1. Buy Conditions: Usually formulated around bullish signals or indicators suggesting upward price momentum.
2. Sell Conditions: Centered on bearish signals or indicators indicating downward price momentum.
Simple Strategy:
The simple strategy could involve using just the Supertrend indicator. Here:
• Buy: When price closes above the Supertrend line.
• Sell: When price closes below the Supertrend line.
Pullback Strategy:
This strategy capitalizes on price retracements:
• Buy: When the price retraces to the Supertrend line after a bullish signal and is supported by another bullish indicator.
• Sell: When the price retraces to the Supertrend line after a bearish signal and is confirmed by another bearish indicator.
Indicators Used:
EMA (Exponential Moving Average):
• Logic: EMA gives more weight to recent prices, making it more responsive to current price movements. A shorter-period EMA crossing above a longer-period EMA can be a bullish sign, while the opposite is bearish.
RSI (Relative Strength Index):
• Logic: RSI measures the magnitude of recent price changes to analyze overbought or oversold conditions. Values above 70 are typically considered overbought, and values below 30 are considered oversold.
MACD (Moving Average Convergence Divergence):
• Logic: MACD assesses the relationship between two EMAs of a security’s price. The MACD line crossing above the signal line can be a bullish signal, while crossing below can be bearish.
CCI (Commodity Channel Index):
• Logic: CCI compares a security's average price change with its average price variation. A CCI value above +100 may mean the price is overbought, while below -100 might signify an oversold condition.
And others...
As the strategy expands or contracts, more indicators might be added or removed. The crucial point is to understand the core logic behind each, ensuring they align with the strategy's objectives.
Logic Behind Each Indicator:
1. EMA: Emphasizes recent price movements; provides dynamic support and resistance levels.
2. RSI: Indicates overbought and oversold conditions based on recent price changes.
3. MACD: Showcases momentum and direction of a trend by comparing two EMAs.
4. CCI: Measures the difference between a security's price change and its average price change.
Understanding strategy conditions is not just about knowing when to buy or sell but also about comprehending the underlying market dynamics that those conditions represent. As you familiarize yourself with each condition and indicator, you'll be better prepared to adapt and evolve with the ever-changing financial markets.
6. Trade Execution and Management
Trade execution and management are crucial aspects of any trading strategy. Efficient execution can significantly impact profitability, while effective management can preserve capital during adverse market conditions. In this section, we'll explore the nuances of position entry, exit strategies, and various Stop Loss (SL) and Take Profit (TP) methodologies within the Supertrend Advance Strategy.
Position Entry:
Effective trade entry revolves around:
1. Timing: Enter at a point where the risk-reward ratio is favorable. This often corresponds to confirmatory signals from multiple indicators.
2. Volume Analysis: Ensure there's adequate volume to support the movement. Volume can validate the strength of a signal.
3. Confirmation: Use multiple indicators or chart patterns to confirm the entry point. For instance, a buy signal from the Supertrend indicator can be confirmed with a bullish MACD crossover.
Position Exit Strategies:
A successful exit strategy will lock in profits and minimize losses. Here are some strategies:
1. Fixed Time Exit: Exiting after a predetermined period.
2. Percentage-based Profit Target: Exiting after a certain percentage gain.
3. Indicator-based Exit: Exiting when an indicator gives an opposing signal.
Percentage-based SL/TP:
• Stop Loss (SL): Set a fixed percentage below the entry price to limit potential losses.
• Example: A 2% SL on an entry at $100 would trigger a sell at $98.
• Take Profit (TP): Set a fixed percentage above the entry price to lock in gains.
• Example: A 5% TP on an entry at $100 would trigger a sell at $105.
Supertrend-based SL/TP:
• Stop Loss (SL): Position the SL at the Supertrend line. If the price breaches this line, it could indicate a trend reversal.
• Take Profit (TP): One could set the TP at a point where the Supertrend line flattens or turns, indicating a possible slowdown in momentum.
Swing high/low-based SL/TP:
• Stop Loss (SL): For a long position, set the SL just below the recent swing low. For a short position, set it just above the recent swing high.
• Take Profit (TP): For a long position, set the TP near a recent swing high or resistance. For a short position, near a swing low or support.
And other methods...
1. Trailing Stop Loss: This dynamic SL adjusts with the price movement, locking in profits as the trade moves in your favor.
2. Multiple Take Profits: Divide the position into segments and set multiple TP levels, securing profits in stages.
3. Opposite Signal Exit: Exit when another reliable indicator gives an opposite signal.
Trade execution and management are as much an art as they are a science. They require a blend of analytical skill, discipline, and intuition. Regularly reviewing and refining your strategies, especially in light of changing market conditions, is crucial to maintaining consistent trading performance.
7. Visual Representations
Visual tools are essential for traders, as they simplify complex data into an easily interpretable format. Properly analyzing and understanding the plots on a chart can provide actionable insights and a more intuitive grasp of market conditions. In this section, we’ll delve into various visual representations used in the Supertrend Advance Strategy and their significance.
Understanding Plots on the Chart:
Charts are the primary visual aids for traders. The arrangement of data points, lines, and colors on them tell a story about the market's past, present, and potential future moves.
1. Data Points: These represent individual price actions over a specific timeframe. For instance, a daily chart will have data points showing the opening, closing, high, and low prices for each day.
2. Colors: Used to indicate the nature of price movement. Commonly, green is used for bullish (upward) moves and red for bearish (downward) moves.
Trend Lines:
Trend lines are straight lines drawn on a chart that connect a series of price points. Their significance:
1. Uptrend Line: Drawn along the lows, representing support. A break below might indicate a trend reversal.
2. Downtrend Line: Drawn along the highs, indicating resistance. A break above might suggest the start of a bullish trend.
Filled Areas:
These represent a range between two values on a chart, usually shaded or colored. For instance:
1. Bollinger Bands: The area between the upper and lower band is filled, giving a visual representation of volatility.
2. Volume Profile: Can show a filled area representing the amount of trading activity at different price levels.
Stop Loss and Take Profit Lines:
These are horizontal lines representing pre-determined exit points for trades.
1. Stop Loss Line: Indicates the level at which a trade will be automatically closed to limit losses. Positioned according to the trader's risk tolerance.
2. Take Profit Line: Denotes the target level to lock in profits. Set according to potential resistance (for long trades) or support (for short trades) or other technical factors.
Trailing Stop Lines:
A trailing stop is a dynamic form of stop loss that moves with the price. On a chart:
1. For Long Trades: Starts below the entry price and moves up with the price but remains static if the price falls, ensuring profits are locked in.
2. For Short Trades: Starts above the entry price and moves down with the price but remains static if the price rises.
Visual representations offer traders a clear, organized view of market dynamics. Familiarity with these tools ensures that traders can quickly and accurately interpret chart data, leading to more informed decision-making. Always ensure that the visual aids used resonate with your trading style and strategy for the best results.
8. Backtesting
Backtesting is a fundamental process in strategy development, enabling traders to evaluate the efficacy of their strategy using historical data. It provides a snapshot of how the strategy would have performed in past market conditions, offering insights into its potential strengths and vulnerabilities. In this section, we'll explore the intricacies of setting up and analyzing backtest results and the caveats one must be aware of.
Setting Up Backtest Period:
1. Duration: Determine the timeframe for the backtest. It should be long enough to capture various market conditions (bullish, bearish, sideways). For instance, if you're testing a daily strategy, consider a period of several years.
2. Data Quality: Ensure the data source is reliable, offering high-resolution and clean data. This is vital to get accurate backtest results.
3. Segmentation: Instead of a continuous period, sometimes it's helpful to backtest over distinct market phases, like a particular bear or bull market, to see how the strategy holds up in different environments.
Analyzing Backtest Results:
1. Performance Metrics: Examine metrics like the total return, annualized return, maximum drawdown, Sharpe ratio, and others to gauge the strategy's efficiency.
2. Win Rate: It's the ratio of winning trades to total trades. A high win rate doesn't always signify a good strategy; it should be evaluated in conjunction with other metrics.
3. Risk/Reward: Understand the average profit versus the average loss per trade. A strategy might have a low win rate but still be profitable if the average gain far exceeds the average loss.
4. Drawdown Analysis: Review the periods of losses the strategy could incur and how long it takes, on average, to recover.
9. Tips and Best Practices
Successful trading requires more than just knowing how a strategy works. It necessitates an understanding of when to apply it, how to adjust it to varying market conditions, and the wisdom to recognize and avoid common pitfalls. This section offers insightful tips and best practices to enhance the application of the Supertrend Advance Strategy.
When to Use the Strategy:
1. Market Conditions: Ideally, employ the Supertrend Advance Strategy during trending market conditions. This strategy thrives when there are clear upward or downward trends. It might be less effective during consolidative or sideways markets.
2. News Events: Be cautious around significant news events, as they can cause extreme volatility. It might be wise to avoid trading immediately before and after high-impact news.
3. Liquidity: Ensure you are trading in assets/markets with sufficient liquidity. High liquidity ensures that the price movements are more reflective of genuine market sentiment and not due to thin volume.
Adjusting Settings for Different Markets/Timeframes:
1. Markets: Each market (stocks, forex, commodities) has its own characteristics. It's essential to adjust the strategy's parameters to align with the market's volatility and liquidity.
2. Timeframes: Shorter timeframes (like 1-minute or 5-minute charts) tend to have more noise. You might need to adjust the settings to filter out false signals. Conversely, for longer timeframes (like daily or weekly charts), you might need to be more responsive to genuine trend changes.
3. Customization: Regularly review and tweak the strategy's settings. Periodic adjustments can ensure the strategy remains optimized for the current market conditions.
10. Frequently Asked Questions (FAQs)
Given the complexities and nuances of the Supertrend Advance Strategy, it's only natural for traders, both new and seasoned, to have questions. This section addresses some of the most commonly asked questions regarding the strategy.
1. What exactly is the Supertrend Advance Strategy?
The Supertrend Advance Strategy is an evolved version of the traditional Supertrend indicator. It's designed to provide clearer buy and sell signals by incorporating additional indicators like EMA, RSI, MACD, CCI, etc. The strategy aims to capitalize on market trends while minimizing false signals.
2. Can I use the Supertrend Advance Strategy for all asset types?
Yes, the strategy can be applied to various asset types like stocks, forex, commodities, and cryptocurrencies. However, it's crucial to adjust the settings accordingly to suit the specific characteristics and volatility of each asset type.
3. Is this strategy suitable for day trading?
Absolutely! The Supertrend Advance Strategy can be adjusted to suit various timeframes, making it versatile for both day trading and long-term trading. Remember to fine-tune the settings to align with the timeframe you're trading on.
4. How do I deal with false signals?
No strategy is immune to false signals. However, by combining the Supertrend with other indicators and adhering to strict risk management protocols, you can minimize the impact of false signals. Always use stop-loss orders and consider filtering trades with additional confirmation signals.
5. Do I need any prior trading experience to use this strategy?
While the Supertrend Advance Strategy is designed to be user-friendly, having a foundational understanding of trading and market analysis can greatly enhance your ability to employ the strategy effectively. If you're a beginner, consider pairing the strategy with further education and practice on demo accounts.
6. How often should I review and adjust the strategy settings?
There's no one-size-fits-all answer. Some traders adjust settings weekly, while others might do it monthly. The key is to remain responsive to changing market conditions. Regular backtesting can give insights into potential required adjustments.
7. Can the Supertrend Advance Strategy be automated?
Yes, many traders use algorithmic trading platforms to automate their strategies, including the Supertrend Advance Strategy. However, always monitor automated systems regularly to ensure they're operating as intended.
8. Are there any markets or conditions where the strategy shouldn't be used?
The strategy might generate more false signals in markets that are consolidative or range-bound. During significant news events or times of unexpected high volatility, it's advisable to tread with caution or stay out of the market.
9. How important is backtesting with this strategy?
Backtesting is crucial as it allows traders to understand how the strategy would have performed in the past, offering insights into potential profitability and areas of improvement. Always backtest any new setting or tweak before applying it to live trades.
10. What if the strategy isn't working for me?
No strategy guarantees consistent profits. If it's not working for you, consider reviewing your settings, seeking expert advice, or complementing the Supertrend Advance Strategy with other analysis methods. Remember, continuous learning and adaptation are the keys to trading success.
Other comments
Value of combining several indicators in this script and how they work together
Diversification of Signals: Just as diversifying an investment portfolio can reduce risk, using multiple indicators can offer varied perspectives on potential price movements. Each indicator can capture a different facet of the market, ensuring that traders are not overly reliant on a single data point.
Confirmation & Reduced False Signals: A common challenge with many indicators is the potential for false signals. By requiring confirmation from multiple indicators before acting, the chances of acting on a false signal can be significantly reduced.
Flexibility Across Market Conditions: Different indicators might perform better under different market conditions. For example, while moving averages might excel in trending markets, oscillators like RSI might be more useful during sideways or range-bound conditions. A mashup strategy can potentially adapt better to varying market scenarios.
Comprehensive Analysis: With multiple indicators, traders can gauge trend strength, momentum, volatility, and potential market reversals all at once, providing a holistic view of the market.
How do the different indicators in the Supertrend Advance Strategy work together?
Supertrend: This is primarily a trend-following indicator. It provides traders with buy and sell signals based on the volatility of the price. When combined with other indicators, it can filter out noise and give more weight to strong, confirmed trends.
EMA (Exponential Moving Average): EMA gives more weight to recent price data. It can be used to identify the direction and strength of a trend. When the price is above the EMA, it's generally considered bullish, and vice versa.
RSI (Relative Strength Index): An oscillator that measures the magnitude of recent price changes to evaluate overbought or oversold conditions. By cross-referencing with other indicators like EMA or MACD, traders can spot potential reversals or confirmations of a trend.
MACD (Moving Average Convergence Divergence): This indicator identifies changes in the strength, direction, momentum, and duration of a trend in a stock's price. When the MACD line crosses above the signal line, it can be a bullish sign, and when it crosses below, it can be bearish. Pairing MACD with Supertrend can provide dual confirmation of a trend.
CCI (Commodity Channel Index): Initially developed for commodities, CCI can indicate overbought or oversold conditions. It can be used in conjunction with other indicators to determine entry and exit points.
In essence, the synergy of these indicators provides a balanced, comprehensive approach to trading. Each indicator offers its unique lens into market conditions, and when they align, it can be a powerful indication of a trading opportunity. This combination not only reduces the potential drawbacks of each individual indicator but leverages their strengths, aiming for more consistent and informed trading decisions.
Backtesting and Default Settings
• This indicator has been optimized to be applied for 1 hour-charts. However, the underlying principles of this strategy are supply and demand in the financial markets and the strategy can be applied to all timeframes. Daytraders can use the 1min- or 5min charts, swing-traders can use the daily charts.
• This strategy has been designed to identify the most promising, highest probability entries and trades for each stock or other financial security.
• The combination of the qualifiers results in a highly selective strategy which only considers the most promising swing-trading entries. As a result, you will normally only find a low number of trades for each stock or other financial security per year in case you apply this strategy for the daily charts. Shorter timeframes will result in a higher number of trades / year.
• Consequently, traders need to apply this strategy for a full watchlist rather than just one financial security.
• Default properties: RSI on (length 14, RSI buy level 50, sell level 50), EMA, RSI, MACD on, type of strategy pullback, SL/TP type: ATR (length 10, factor 3), trade direction both, quantity 5, take profit swing hl 5.1, highest / lowest lookback 2, enable ATR trail (ATR length 10, SL ATR multiplier 1.4, TP multiplier 2.1, lookback = 4, trade direction = both).

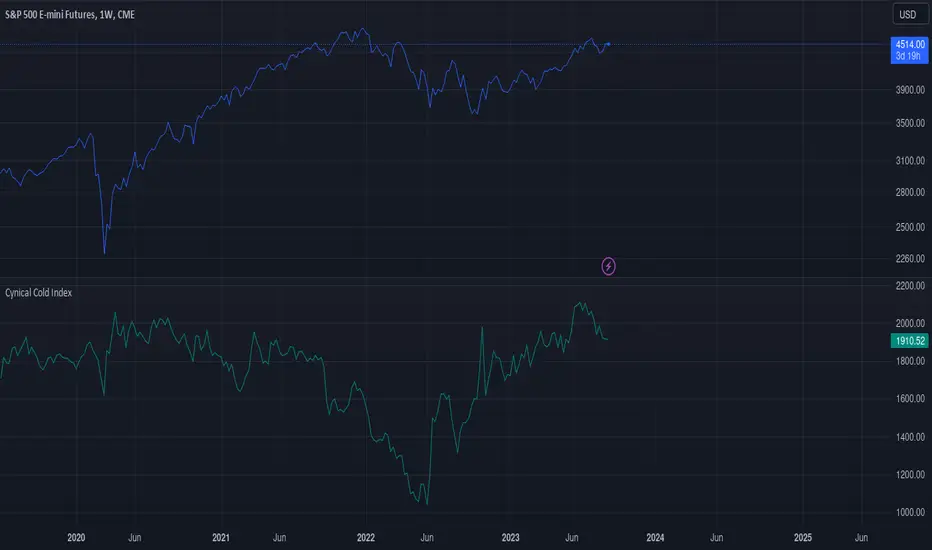
Cynical Cold IndexThis TradingView indicator calculates the Cynical Cold Index, which is a weighted basket of commodity prices designed to track economic conditions. It compares the price of a given asset to the index value.
Weights the commodities as percentages:
Gold: 10%
Oil: 15%
Coffee: 5%
Natural Gas: 10%
Silver: 15%
Sugar: 5%
Corn: 5%
Wheat: 5%
Cotton: 10%
Copper: 10%
Iron Ore: 5%
Live Cattle: 5%
Urea: 5%
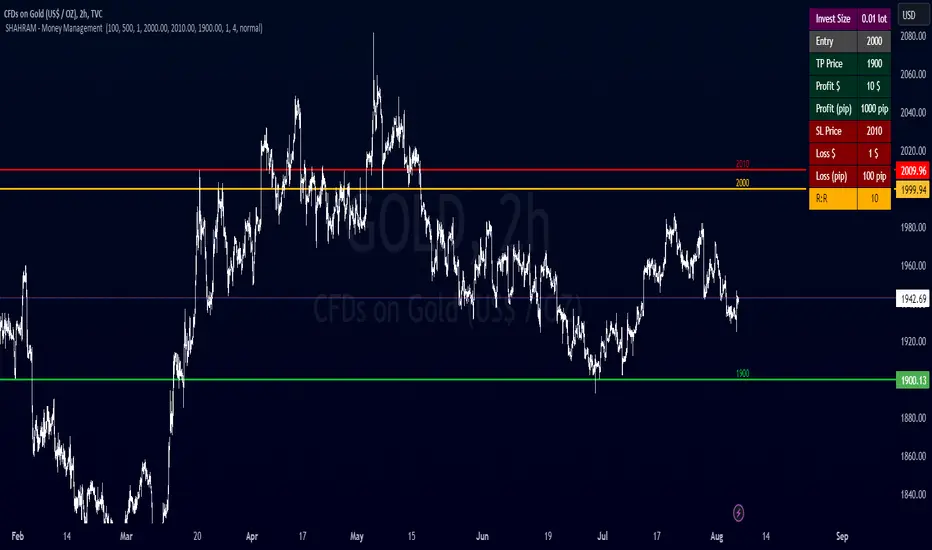
SHAHRAM - Money Management This indiator will help you to calculate your position size for managing the risk calculator.
Features :
Click-able Price Entry & SL & TP
calculations works on Forex, CFD, Stock, Futures and Crypto markets.
Usage:
Step 1: Set your entry price
Step 2: Set your stop loss
Step 3: Set your Target
Step 4: Choose the symbol, forex will be automatically detected
Step 5: Fill in your balance and set your risk settings
Parameters
- Set symbol: Forex (auto detection), US100, US30, BTC, XAUUSD, NGAS, XBRUSD, XTIUSD, AUS200, US500, OIL, GOLD, SILVER,...
- Account balance
- Risk in %
- Contract size
- Levels: Stop loss, Entry, Target
- Display settings for the Trading Panel
Trading panel
- Show Live P/L
- Show Risk to reward
- Show lot size
- Show risk in %
- Show account balance
- Show money at risk (no commissions included)
You need change the lot size in Account Setting of this indicator For Gold,Oil... and Other Symbol like as different pip value.
Simply choose your entry level and stop level than target price on the chart and the indicator will calculate your invest size and other documents. You can change your account risk and base currency units in the settings along with changing the scaling of the calculation to adjust the results with the lot sizing units of your broker. This allows the calculator to be used with CFDs, forex, Gold, etc.. Hope it helps in your trading it has been the single most useful tool in my trading as it has helped me always keep my risk locked up and on point that is why I released it.
Copyright BY : @shahramlife
indiator will help you to calculate your position size for managing the risk calculator.
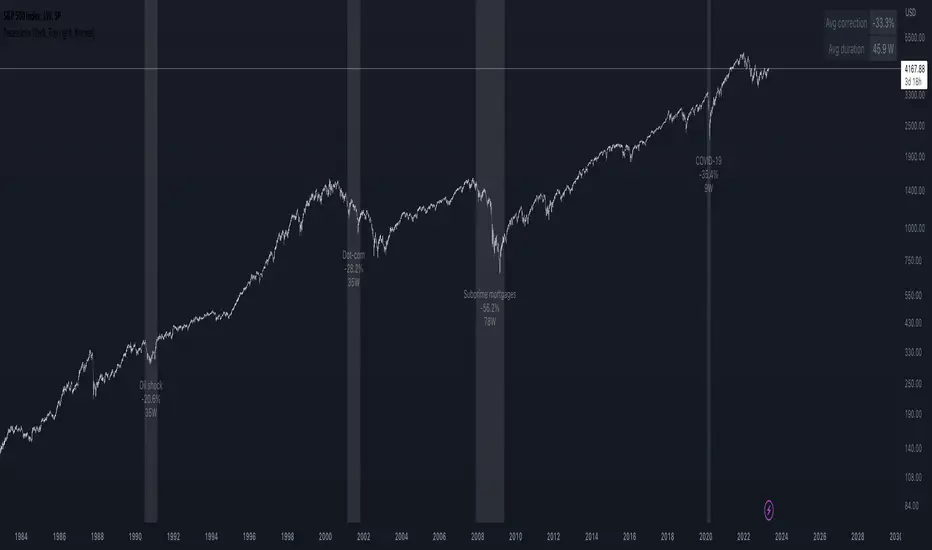
Recessions & crises shading (custom dates & stats)Shades your chart background to flag events such as crises or recessions, in similar fashion to what you see on FRED charts. The advantage of this indicator over others is that you can quickly input custom event dates as text in the menu to analyse their impact for your specific symbol. The script automatically labels, calculates and displays the peak to through percentage corrections on your current chart.
By default the indicator is configured to show the last 6 US recessions. If you have custom events which will benefit others, just paste the input string in the comments below so one can simply copy/paste in their indicator.
Example event input (No spaces allowed except for the label name. Enter dates as YYYY-MM-DD.)
2020-02-01,2020-03-31,COVID-19
2007-12-01,2009-05-31,Subprime mortgages
2001-03-01,2001-10-30,Dot-com bubble
1990-07-01,1991-03-01,Oil shock
1981-07-01,1982-11-01,US unemployment
1980-01-01,1980-07-01,Volker
1973-11-01,1975-03-01,OPEC
Ultimate P&L IndicatorHello everyone,
Excited to release this P&L Indicator! Read below for more details.
What it does:
This is an indicator that permits you to track your active P&L live on Tradingview. As well, it provides some insight into DCAing your position by giving you live estimates of your revised DCA if you were to add to your position at various targets/price points.
Who is it for:
I developed it because I trade 100% off of Tradingview but my broker does not support Tradingview integration. So I wanted a way to track my position live on the Tradingview platform without having to constantly reference my broker. I also wanted to be able to set position specific alerts right on Tradingview.
How does it work:
It works by the user manually inputting their trade information, including their DCA, position size and the date and time of position entry. The indicator can provide real time and live DCA adjusted estimates if you were to add to your position at the current stock price, or you can manually calculcate your revised DCA at a specific price target.
The indicator also displays your current and past performance on your position for the duration of the position period:
Elements:
Capabilities:
The indicator is compatible with both futures and share trading.
Option trading is not directly available, however, you can get an idea for your option position P&L by following the 1 option contract = 100 share rule.
So if you have 5 option contracts that you bought at a ticker price of, say, 38$, your average cost or DCA would be 38 and your position size would be 500. This will not be 100% accurate, but will be close enough to give you a feel for your active P&L.
If you are trading futures, you will need to select "Futures Trading" and specify the TIck and Index costs. A cheat sheet has been provided in the tool tip for ES, Oil and MNQ. The default is set for ES1! mini futures at 0.25 ticks per 50$.
Important tips:
1. Select the date and time of your position (optional): This is optional but will provide you with the clearest and most accurate review of how your position has performed, including the highest and lowest (drawdown).
2. Select whether it is a share position or a futures position (this is required).
3. Select whether it is a long or short position (this is required).
4. Input your DCA and position size (this is required).
5. Most importantly, select the ticker your position is based in!
I have also prepared a quick start video which is linked below:
As always, please let me know your comments/questions and feedback for the indicator.
Thanks for checking it out and safe trades everyone!
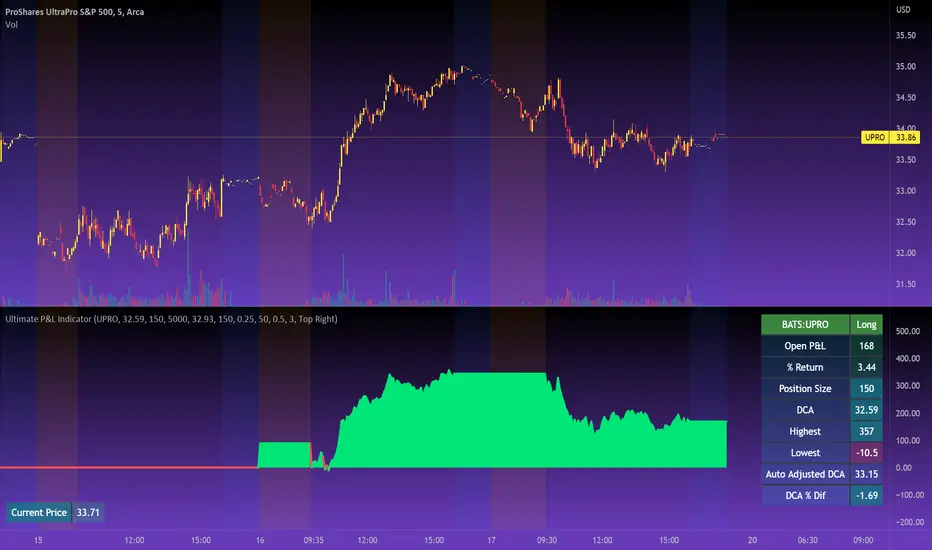
BE - Golden Cross Crude KeyTraders, i have been observing crude oil for about 3 months now and somehow I can see that crude is respecting 42 days Moving average and crosses have created massive spikes most of the time.
However you need to be mindful of the time to trade and timeframe since not all crosses creates spikes.
Note: I have been testing on a 15min timeframe.
Keeping this in mind, this indicator is a automated solution which takes trade entries on crosses plus buffer and exits based on the specified Sl type.
Enjoy!
DISCLAIMER: No sharing, copying, reselling, modifying, or any other forms of use are authorized for our documents, script / strategy, and the information published with them. This informational planning script / strategy is strictly for individual use and educational purposes only. This is not financial or investment advice. Investments are always made at your own risk and are based on your personal judgement. I am not responsible for any losses you may incur. Please invest wisely.
Happy to receive suggestions and feedback in order to improve the performance of the indicator better.

Peer Performance - NIFTY36STOCKSI have created a peer performance dashboard for:
36 stocks from:
5 sectors of Nifty 100
This kind of dashboard is very useful for traders when they are planing to trade in a stocks and like to see how that is stocks is performing against other stocks in the same sector . Picking outperforming stocks will always give outstanding results when market starts moving. os having view on teh complete sector will always be good for traders before picking a specific stock.
Sectors covered in this indicators are:
Indian Auto Sector
Banking Sector
Oil, Gas and Energy Stocks
Cement Sector
Technology Sector
It will help traders reviewing performance ( stock return in last 1 year) of group of stocks from a particular sector .
Basically 5 functions are used to plot this dashboard
using "if " function to shortlist the stocks and the sector it belongs to.
tablo function to plot a table with specific parameters like number of row and columns, color of the frame of table
Getting yearly return into a series of variables using "request.security" function
str.tostring function is used to convert yearly return into a series of text so that it can inserted into the table cell.
finally plotting all the text and yearly return values using table.cell function

Global Money Supply USD-AdjustedGlobal Money Supply Aggregates
- US, China, EU, Japan, UK
- Korea, India, Canada, HK, Australia
- Taiwan, Brazil, Swiss, Russia, Mexico
- Thailand, Indonesia, Saudi, Singapore, Vietnam
Unfortunately, TV Pine can only take in 40 tickers, Each country has Money Supply Data adjusted against its FX to USD.
The formula in TV only can contain 10 tickers. So would recommend doing it up yourself on the first big 5 countries,
Anyway US and China constitute close to 50% of the global money supply.
However, one can argue whether money supply data (broad money) is valid nowadays. But I would bring up that this is just for comparison and trend purposes. Yes, M3 was removed from the US Fed data releases in end-2005.
Aggregating all of the above tickers yield me around 120tn of money supply, USD-adjusted.
There's pretty much other countries that should be included but due to the lack of data and small size of the country, it is omitted.
Examples:
- Heavily Sanctioned: Iran (400-500bn) and Iraq (200-300bn)
- No Data/Bad Data: Algeria (100bn), Bangladesh (110bn)
- Fallen Angels: Venezuela (100bn?), Argentina (120bn)
- 400-500bn club: Israel, Turkey, Poland, Sweden, Ireland, UAE, Msia, Chile
- 200-300bn club: Norway, Czech, Philippines, S.Africa, New Zealand, Egypt, Denmark, Qatar
- 100bn club: Colombia, Lebanon, Pakistan, Morocco, Romania, Hungary, Nigeria, Kuwait
- GDP 1bn club: Peru, Kazakhstan, Angola, Sudan, Ukraine, Ecuador
All these could add up to 10-15tn money supply, but with currencies with bad adoption on some. End of the day, we still living in a dollarised world, with the big 5 nations taking up to 80% of the officially published money supply. The unfortunate issue is that the money supply data isn't that forward-looking. A simple linear extrapolation of historical 3-month rolling average for next month estimates can be decent, with possibility of manual meddling to add adjustments on huge macro-events eg QE infinity.
Perhaps, additional tweaking would be inflation-adjusting this. Against SPX, some housing index, crude oil, gold.
howmuch.net
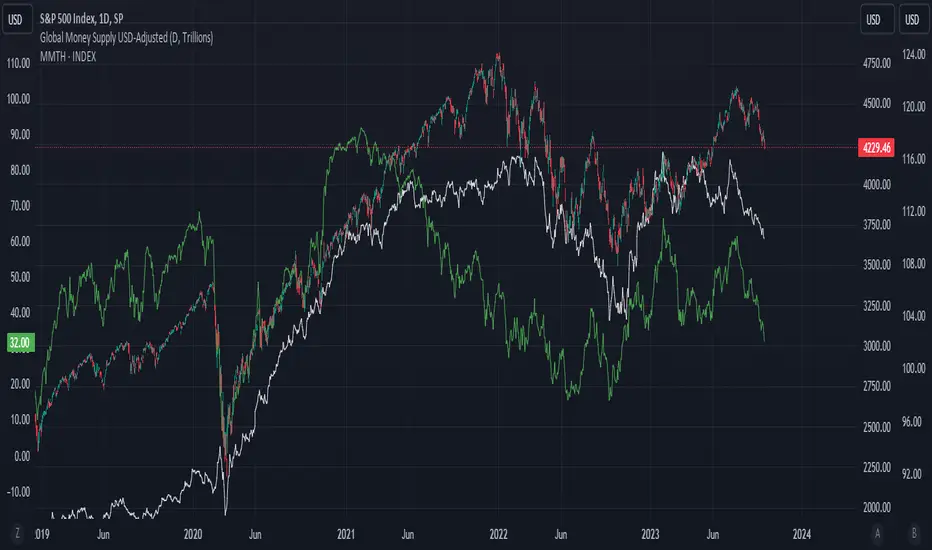
Assassin's Grid
Introduction: Are you a fan of automated grid-based trading and holding onto your crypto assets like they're the last Snickers bar in the world? If so, this Pine script could be your new best friend!
Grid Trading Genius: The script uses some seriously advanced grid trading techniques to automatically place orders at different price levels, creating a mesh of positions that move with the market like a well-oiled machine. This strategy can be great for traders who are willing to sit back and let their positions grow like a fine wine over time.
Optimization Features: The script comes loaded with all sorts of features and tools to help traders optimize their grid positions, like position exits and custom alerts for creating limit and market orders. This helps keep traders in the loop and allows them to take action as needed, like a ninja in the night.
Unique Twists: One of the unique features of this script is the option to choose between normal or incremental entry steps in a 1,2,3,... ratio. By choosing incremental entries, traders can potentially improve their average price and increase their potential profits like a boss. Just keep in mind that this script doesn't have a stop loss feature, but it does include the option to sell without profit on the final entry or on all entries if desired. Additionally, the script is always open to improvement and any ideas for improving it are welcome, like a blank canvas.
Conclusion: If you love automated trading and have the patience and determination to stick to a solid strategy, this Pine script could be a great fit for you. It's suitable for traders who are comfortable with more complex trading approaches and are willing to put in the time and effort to learn and master the script's various features and techniques, like a Jedi Knight
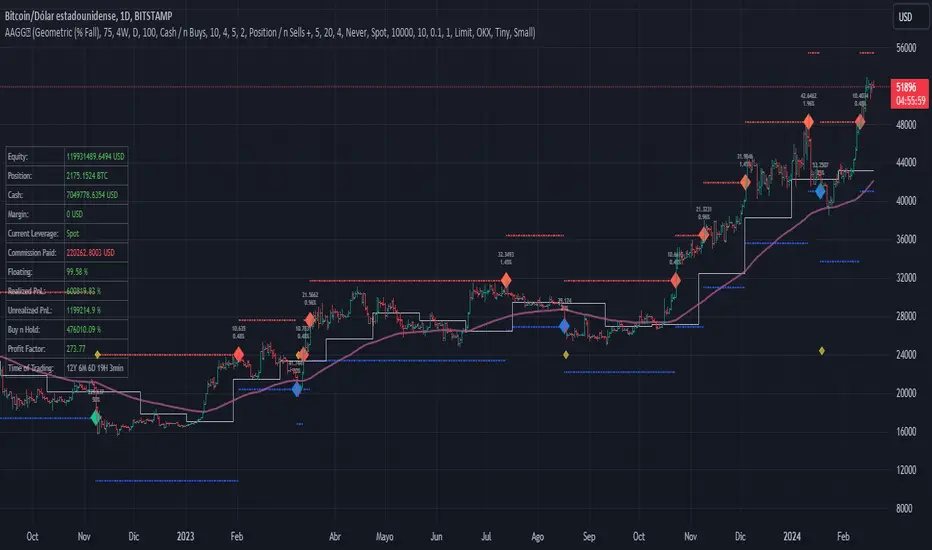
Enterprise Value on Earnings / FCF / FFO Band Enterprise Value per Diluted Share plotted as black line.
Bands start at 5x and stops at 30x, each represents a 5x increment.
Band Options (per Diluted Share, Fiscal Year):
①Free Cash Flow
②Operating Income
③Adjusted Funds from Operations
④Core Earnings
where:
AFfO = FFO - Unusual Income/Expenses + Tax Distortion (dafault 25% tax rate)
Core Earnings = Net Income - Unusual Income/Expenses + Tax Distortion (default 25% tax rate)
These two adjustments are coarse and watered-down, so take them with a grain of salt.
For professional assessments of Core Earnings versus GAAP Earnings you may go to David Trainer at Great Speculations(costs money). I am unaffiliated with these entities.
Tips:
①③ are unapplicable to financials.
③ may work for REIT-like companies whose depreciation is mostly overstated(e.g. hydro-elec utility companies whose dams typically don't wear out in ten years; companies with assets that APPRECIATE in reality but they D&A them anyway).
Probably none works for cyclicals, especially extreme boom-bust cyclicals such as oil, aluminum & shipping etc.
Beware unnaturally low (dividend_payout+buyback)/net_income ratio as some majority shareholders may funnel money to themselves/cronies at the expense of small shareholders.
Disclaimer: Use at your own discretion. No guarantees for any accuracy or usefulness. If you decide to use it, I take no responsibility whatsoever for any consequences. Does not constitute financial advice. Past performance is not Indicative of future results.
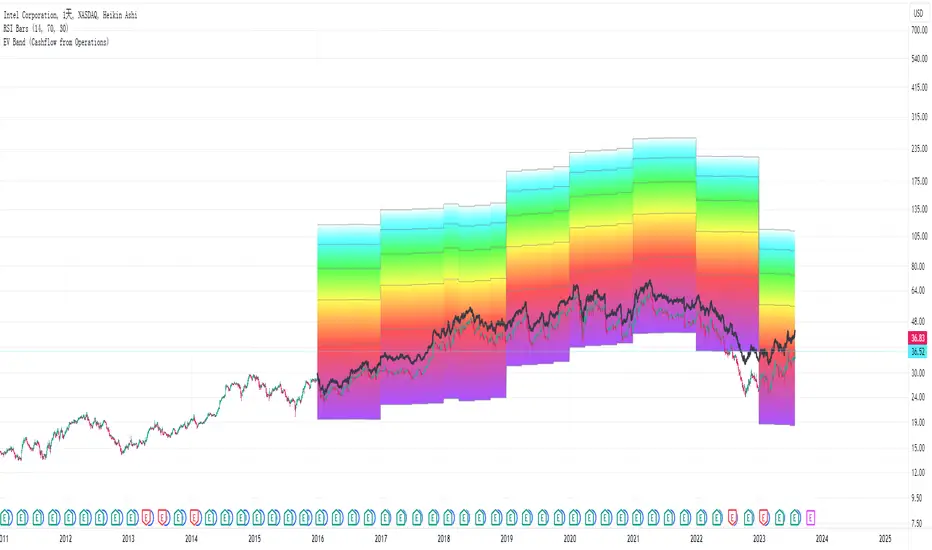
AJ's Position Size Calculator for Forex and StocksThis position size/ stop loss and take profit calculator is designed to make entering positions more efficient. In the settings enter your account size and currency. Stop loss and profit levels can be calculated from the ATR or manually. To manually choose stop and profit price, choose manual from the SL or TP Value Type, then enter your price in the boxes below. Lot size or shares will be calculated and displayed on the table to the right of the chart. Position size calculation takes into account any currency exchange rates between your account currency and the quoted currency of the selected ticker. For forex lot sizes the exchange rate for the quoted currency relative to account currency is also built in to get an accurate position size. Enter your brokers leverage and your used margin will be displayed as well. The position size calculator is currently only configured for stocks and forex, I will try to add updates, in the future to other tickers like crypto , precious metals and crude oil CFD's. profit target and stop loss calculator should work for all symbols. I can't guarantee that the output of this calculator is correct. Use at your own risk!

energies_correlation_zscoreA table to help track correlations between the four major energies contracts of the CME. The table shows the z-score of the current correlation value between HO, RB, CL, and NG. The inputs are:
- timeframe: the timeframe of the calcluation. the default is 5 minutes.
- window: the rolling window over which to calculate the correlations. the default is 48, or four hours given the default timeframe.
A score of zer means that the correlation over the latest window is in line with the average for all windows sampled from the chart history. More positive scores imply higher positive correlation than normal, and vice versa for negative scores.

CL PMAThis is and indicator Using SMAs of the High+Low+Close/3 pivot point strategy outlines by Mark Fisher. This indicator is meant to be used as another layer adding confirmation to the ACD system. I mostly use this script to track Crude Oil ( CL ) but it can be used for many other products . However, this indicator is most useful in volatile markets.
This is not meant to be used as a primary indicator but rather third level of confirmation after ACD and Number lines outlined by Mark Fishers system.
