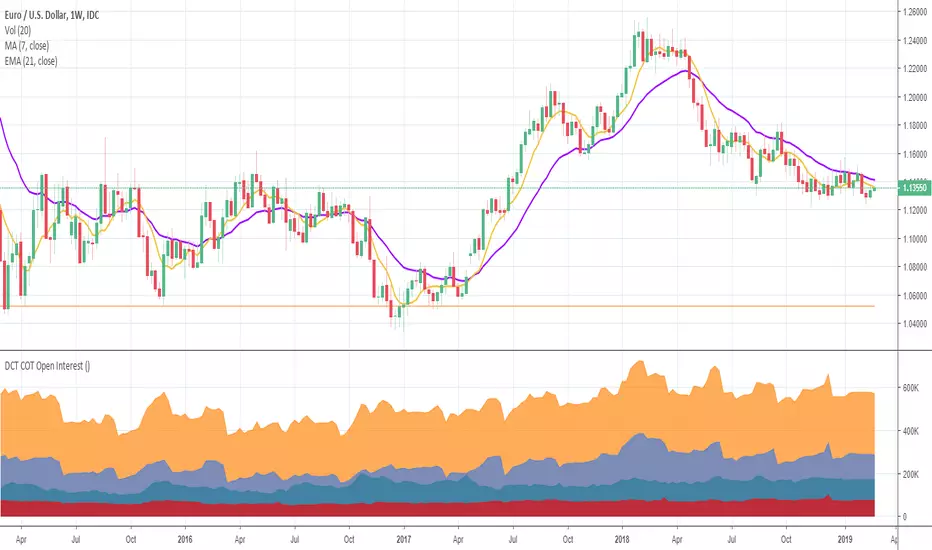
Deckchair Trader COT Open InterestPlots the COT Open Interest from the legacy report data from Quandl. Plots the commercial, non commercial and non reportables. Each plot can be hidden as needed.
I've tried to capture the basic dollar based currencies and the futures such as corn , wheat , rice, oil , hogs etc. The symbols required a little translation to match what Quandl is expecting but I think I got most of them. Please let me know of any issues with these.
Part of a suite of COT related indicators based on the excellent book "the commitment of traders bible" by Stephen Briese.
Works best on weekly timeframe.
Feb 26, 2018
Release Notes: Quandl have changed their codes :( now they seem to be using the CFTC Id's where are numeric (and can be found in the dump you get from them)
So whereas before for example, GBPUSD was mapped to BP it is now mapped to 096742.
I have gone through the various dumps and tried to map all the symbols I was using, the currency were the easy ones, the wheat, corn etc a little harder to trade down due to variations.
Please let me know if different
Thanks
Tim Titchmarsh
DeckchairTrader
חפש סקריפטים עבור "Oil"
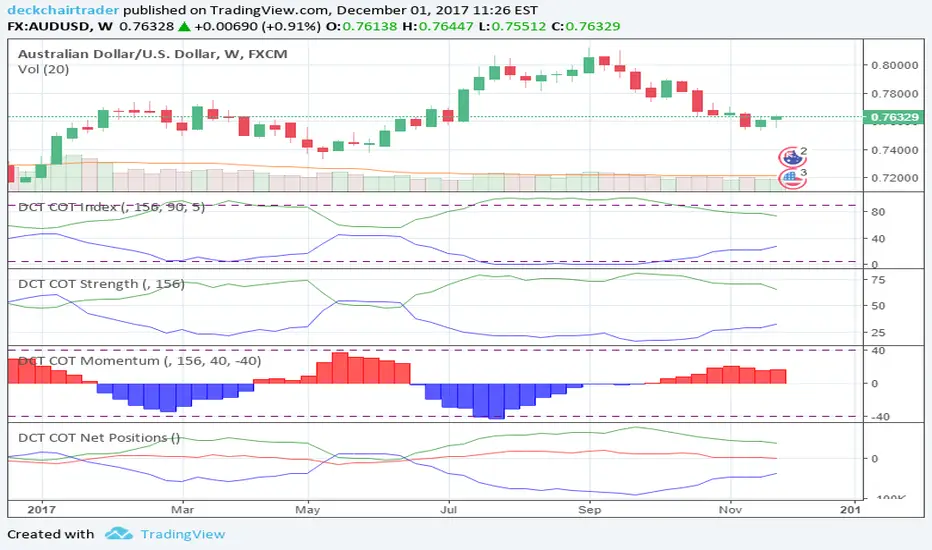
Deckchair Trader COT IndexPlots the COT Index from the legacy report data from Quandl. Plots the commercial, non commercial and non reportables. Each plot can be hidden as needed.
I've tried to capture the basic dollar based currencies and the futures such as corn , wheat , rice, oil , hogs etc. The symbols required a little translation to match what Quandl is expecting but I think I got most of them. Please let me know of any issues with these.
Part of a suite of COT related indicators based on the excellent book "the commitment of traders bible" by Stephen Briese.
Currently working on a trading strategy based around these indicators,
Would love to hear if you are interested in this or have some COT trading ideas to share.
Feb 26, 2018
Release Notes: Quandl have changed their codes :( now they seem to be using the CFTC Id's where are numeric (and can be found in the dump you get from them)
So whereas before for example, GBPUSD was mapped to BP it is now mapped to 096742.
I have gone through the various dumps and tried to map all the symbols I was using, the currency were the easy ones, the wheat, corn etc a little harder to trade down due to variations.
Please let me know if different
Thanks
Tim Titchmarsh
DeckchairTrader

Kringold2[WOZDUX] gold equivalentThe indicator is a tool for global analysis. The default is the price of gold. The price of the instrument from the main window is divided by the price of gold. The result is the price of the instrument in units of gold. The screen uses the Dow Jones index as an example. In the indicator window, the price of the index in units of gold or the so-called gold Dow Jones. The use of the gold equivalent makes it possible to see more truthful trends. The Indicator has the ability to change gold to any other equivalent. It is enough to change the name of the exchange and the name of the instrument in the options tool and exchange. In addition, in the settings, the second box on top allows you to view the graph in a linear or logarithmic scale. The first box at the top switches the line chart or the CCI =WT indicator to this chart.
-------------------------------------------
Индикатор это инструмент для глобального анализа. По умолчанию используется цена золота. Цена инструмента из основного окна делится на цену золота. В результате получается цена инструмента в единицах золота. На экране для примера используется индекс Доу джонса. В окне индикатора цена индекса в единицах золота или так называемый золотой Доу Джонс. Использование золотого эквивалента дает возможность видеть более правдивые тенденции движения. В Индикаторе есть возможность поменять золото на любой другой эквивалент. Достаточно в опциях инструмент и биржа изменить название биржи и название инструмента. Кроме того, в настройках, второй бокс сверху дает возможность смотреть график в линейном или логарифмическом масштабе. Первый бокс сверу переключает линейный график или индикатор CCI =WT к данному графику.

IV/HV ratio 1.0 [dime]This script compares the implied volatility to the historic volatility as a ratio.
The plot indicates how high the current implied volatility for the next 30 days is relative to the actual volatility realized over the set period. This is most useful for options traders as it may show when the premiums paid on options are over valued relative to the historic risk.
The default is set to one year (252 bars) however any number of bars can be set for the lookback period for HV.
The default is set to VIX for the IV on SPX or SPY but other CBOE implied volatility indexes may be used. For /CL you have OVX/HV and for /GC you have GVX/HV.
Note that the CBOE data for these indexes may be delayed and updated EOD
and may not be suitable for intraday information. (Future versions of this script may be developed to provide a realtime intraday study. )
There is a list of many volatility indexes from CBOE listed at:
www.cboe.com
(Some may not yet be available on Tradingview)
RVX Russell 2000
VXN NASDAQ
VXO S&P 100
VXD DJIA
GVX Gold
OVX OIL
VIX3M 3-Month
VIX6M S&P 500 6-Month
VIX1Y 1-Year
VXEFA Cboe EFA ETF
VXEEM Cboe Emerging Markets ETF
VXFXI Cboe China ETF
VXEWZ Cboe Brazil ETF
VXSLV Cboe Silver ETF
VXGDX Cboe Gold Miners ETF
VXXLE Cboe Energy Sector ETF
EUVIX FX Euro
JYVIX FX Yen
BPVIX FX British Pound
EVZ Cboe EuroCurrency ETF Volatility Index
Amazon VXAZN
Apple VXAPL
Goldman Sachs VXGS
Google VXGOG
IBM VXIBM

Inverted Yield Curve with VIX Fear IndexUS 2 year and US 10 year comparison, inverted yield curve with VIX. I use this on a weekly chart with 2 moving averages, the 40 week (ma200 daily) and the 520 week (10 year median).
The bottom histogram is the VIX and the plot is the yield curve. When the VIX is above a certain level (you can set it in settings) and the ýield curve is close to or at inversion the background goes red.
The last seven recessions were preceded by an inverted yield curve. Here I combined the two main fear indexes, the VIX and the run for safe US treasuries (Inverted Yield Curve).
This is preset to the 2 year and 10 year US bond, weekly, and the normal VIX ticker but you can set it to whatever you like.
Published with source code for anyone to modify. Please comment below if you do so! This is the second in a series of indicators I intend to publish as a package of economic recoverty/recession symptom indicators.
Follow me for updates, next one up is commodities with dr Copper and oil!

Gap finder (gold minds)This tool highlights where gaps happens and outlines in the chart where the gap zones are. If there is a gap up there is a green line, a gap down it is red. The gap zone is highlighted in blue. You can choose the size of your gap with the input menu to the desired size. Feel free to ask comment below. Made for the Gold Minds group

COT Net Positions
Plots the COT net positions from the legacy report data from Quandl. Plots the commercial, non commercial and non reportables. Each plot can be hidden as needed.
I've tried to capture the basic dollar based currencies and the futures such as corn, wheat, rice, oil, hogs etc. The symbols required a little translation to match what Quandl is expecting but I think I got most of them. Please let me know of any issues with these.
Part of a suite of COT related indicators based on the excellent book "the commitment of traders bible" by Stephen Briese.
I have the COT Index, Momentum, Strength and Open Interest waiting in the wings.
Currently working on a trading strategy based around these indicators,
Would love to hear if you are interested in this or have some COT trading ideas to share.
B3 Directional Trend IndexB3 Directional Trend Index ~ All about the trend! William Blau is the designer of this gem, and IMHO it is the best trend finder of all the lagging indicators out there I have tested. It is important to pay attention to the slope and thickness of the line, and its relationship to zero. A reversion to the zero may look momentous, but in fact it could reverse when it reaches mean, only to turn back around. You can see this in March and April of this silver futures daily chart. Makes for a great instrument on anything you consider trendy, like crude oil for example. The default user inputs are set to my liking, as I find them to be great on all charts and resolutions. You may read around to find more about this on the internet, or its mentioned in Krausz's work. Also, imprtant to remember when no trend, trend finders like this sufffer, so be wise as to what market condition you are in. Rangy and within Range = no, On the Move = yes.

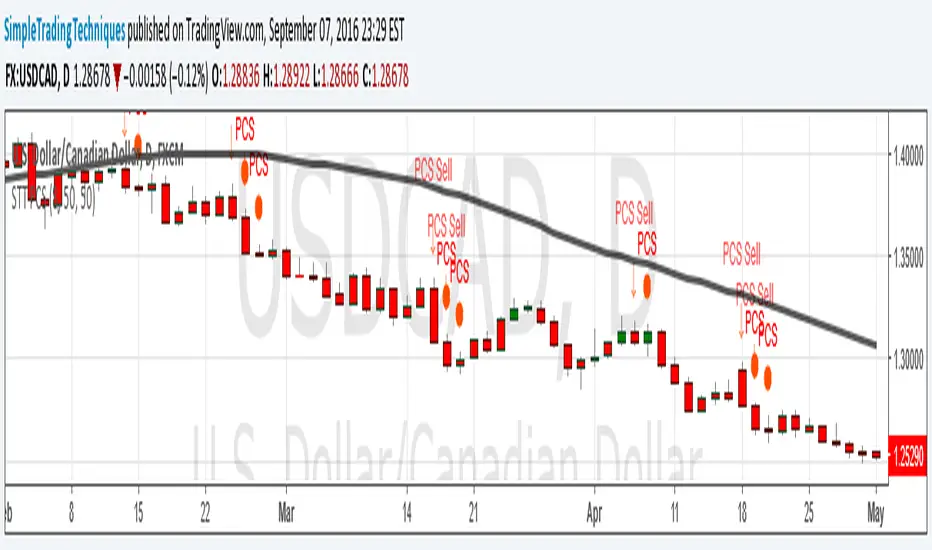
ENGULFING CANDLESTICK STRATEGY(i) Arrow represent trade setup
(ii) Circle represent triggering of the trade
--------------------------------------------------------------------
1. Where to place stop loss?
2. Where to exit the trade?
3. How to protect gains in your trade?
4. How to apply money management rule?
5. How to trade gap opening?
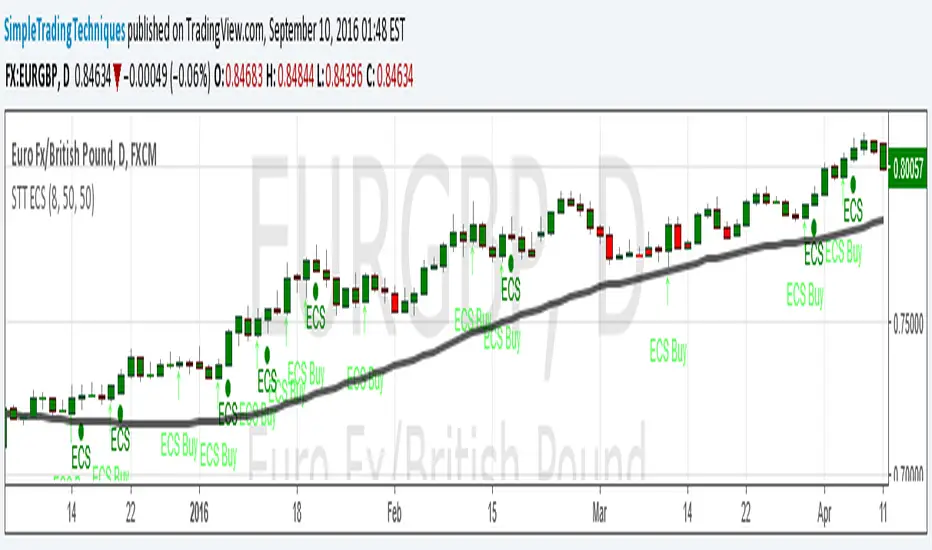
PULLBACK CANDLESTICK STRATEGY BY SIMPLE TRADING TECHNIQUESArrow represent trade setup
Circle represent triggering of the trade
--------------------------------------------------------------------
1. Where to place stop loss?
2. Where to exit the trade?
3. How to protect gains in your trade?
4. How to apply money management rule?
5. How to trade gap opening?
Fractal Adaptive Moving AverageSettings:
FRAMA: blue line, SC = 252, FC = 40, length = 252
EMA: orange line, length = 50
FRAMA seems to be the evolution of the current and much-used EMA. The basic strategy is simple: long if the price crosses up the line, short or exit if vice versa.
The main difference between EMA and FRAMA is that the first one seems to lag much more than the first one, as we can see from the chart below (crude oil daily chart)
FYI
etfhq.com
quantstrattrader.wordpress.com

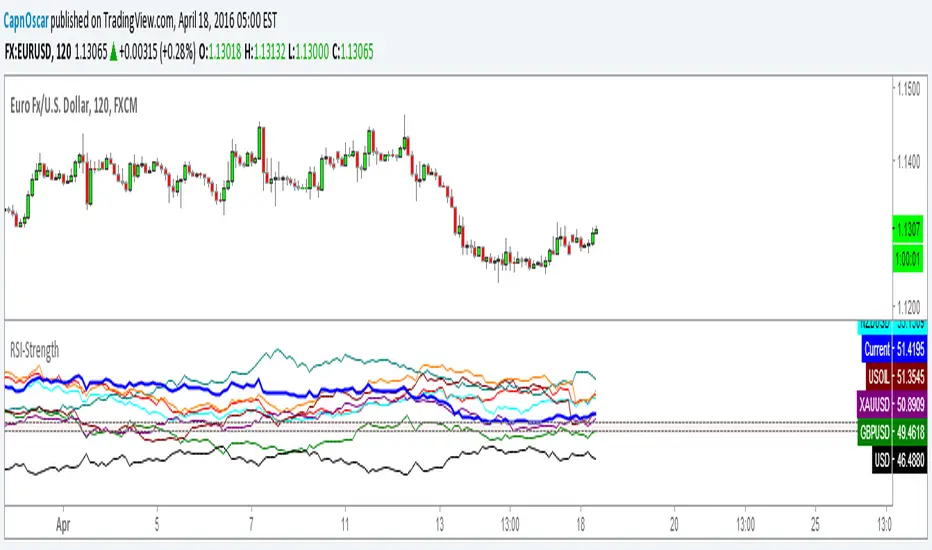
RSI-StrengthJust Quick Look to Major pairs and USD additionally Gold and Oil
You Need to tick Chart Settings / Scale / Indicator labels
Crude Roll Trade SimulatorEDIT : The screen cap was unintended with the script publication. The yellow arrow is pointing to a different indicator I wrote. The "Roll Sim" indicator is shown below that one. Yes I could do a different screen cap, but then I'd have to rewrite this and frankly I don't have time. END EDIT
If you have ever wanted to visualize the contango / backwardation pressure of a roll trade, this script will help you approximate it.
I am writing this description in haste so go with me on my rough explanations.
A "roll trade" is one involving futures that are continually rolled over into future months. Popular roll trade instruments are USO (oil futures) and UVXY (volatility futures).
Roll trades suffer hits from contango but get rewarded in periods of backwardation. Use this script to track the contango / backwardation pressure on what you are trading.
That involves identifying and providing both the underlying indexes and derivatives for both the front and back month of the roll trade. What does that mean? Well the defaults simulate (crudely) the UVXY roll trade: The folks at Proshares buy futures that expire 60 days away and then sell those 30 days later as short term futures (again, this is a crude description - see the prospectus) and we simulate that by providing the Roll Sim indicator the symbols VIX and VXV along with VIXY and VIXM. We also provide the days between the purchase and sale of the rolled futures contract (in sessions, which is 22 days by my reckoning).
The script performs ema smoothing and plots both the index lines (VIX and VXV as solid lines in our case) and the derivatives (VIXY and VIXM as dotted lines in our case) with the line graphs offset by the number of sessions between the buy and sell. The gap you see represents the contango / backwardation the derivative roll trades are experiencing and gives you an idea how much movement has to happen for that gap to widen, contract or even invert. The background gets painted red in periods of backwardation (when the longer term futures cost less than when sold as short term futures).
Fortunately indexes are calibrated to the same underlying factors, so their values relative to each other are meaningful (ie VXV of 18 and VIX of 15 are based on the same calculation on premiums for S&P500 symbols, with VXV being normally higher for time value). That means the indexes graph well without and adjustments needed. Unfortunately derivatives suffer contango / backwardation at different rates so the value of VIXY vs VIXM isn't really meaningful (VIXY may take a reverse split one year while VIXM doesn't) ... what is meaningful is their relative change in value day to day. So I have included a "front month multiplier" which can be used to get the front month line "moved up or down" on the screen so it can be compared to the back month.
As a practical matter, I have come to hide the lines for the derivatives (like VIXY and VIXM) and just focus on the gap changes between the indexes which gives me an idea of what is going on in the market and what contango/backwardation pressure is likely to exist next week.
Hope it is useful to you.

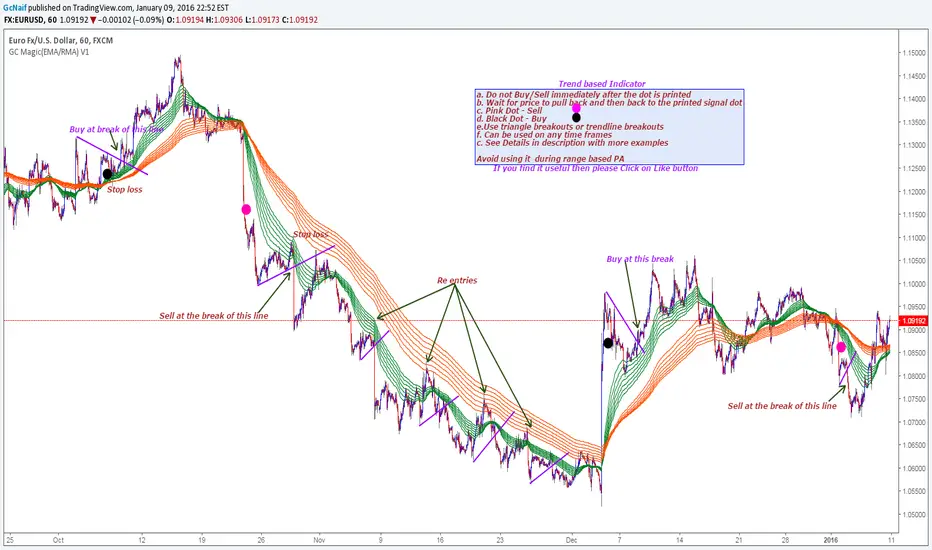
GC Magic(EMA/RMA) V1This is the second script I am posting on TV . This is a Trend based indicator with the option of using it as Exponential Moving Averages or Rsi Moving Averages.The RMA's are giving better signal than the Exponential Moving Averages. The script has the option to select either of them. Works on all time frames. The default options are working good on all time frames.
With the help of Indicator Properties following Options can be changed
a. Type of moving averages for using Guppy method
b. Option to use higher time frame Signal moving average of your choice along with higher time frame
c. Enable or disable to show signal EMA/RMA on chart .
d. Enable or disable to show Guppy EMA/RMA on chart
Indicator Properties:
1. Select to use EMA , Uncheck to use RMA: --> Check to Select EMA based Guppy or Uncheck to use RMA based Guppy
2. Fast EMA/RMA For Cross --> Fast EMA/RMA cross Length
3. Slow EMA/RMA For Cross --> Slow EMA/RMA Length
4. Signal EMA/RMA --> Moving average to use for Signal filters. This moving average will be based on the timeframe u will be selecting below
5. Time interval for Signal EMA/RMA (W, D, ) --> Which time frame moving average you want for the above Signal EMA
6. Do you want to use Signal EMA/RMA for Signals? --> Do you want to use Signal EMA as filter or just the cross of Guppy . Check to use and uncheck for just cross
7. Show Signal EMA on Chart? --> Do you want to display higher timeframe Signal EMA on chart
8. Show Guppy-Slow-Red On Chart? --> Shows/Hides Slow EMA/RMAs
9. Show Guppy-Fast-Green On Chart? --> Shows/Hides Fast EMA/RMAs
Examples:
GbpAud 15m
GbpNzd 1hr
Oil 4hr
AudUSD 1hr

[RS]Khizon (DWTI) Strategy V0Request for Khizon01:
corrected a issue with the default stoch rsi settings (14 smoothing when it should be 3), can always change back since the 14 settings were better performing at the current chart.
added option to just open buy trades or sell trades separately and close were previously swing trade occur.
added plot titles.

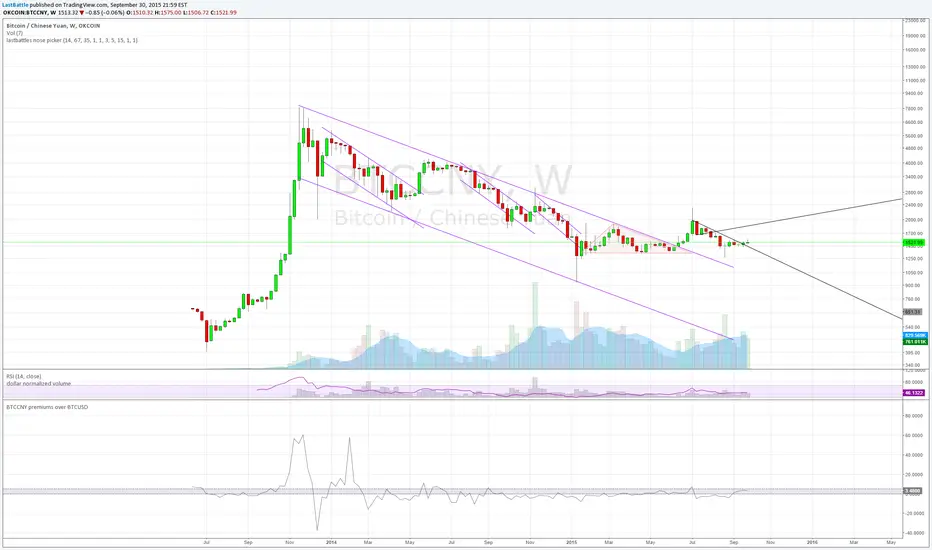
BTCCNY premiums over BTCUSD - yuan devaluationBitcoin as an alternative to capital outflows, with a market cap of just 2 billion can easily be up by multiples from the outflow of yuan from mainland China alone.
People simply do not want yuan if their purchasing power is going down over time.
Current methods of taking capital off mainland China via overseas cash withdrawals are quickly being closed out by the communist government.
------------------------------------------------------------
www.zerohedge.com
China has capped the amount of money Chinese holders of bank and credit cards can withdraw outside the country, in its latest effort to discourage people from moving badly needed capital offshore.
China’s foreign-exchange regulator put a new annual cap on overseas cash withdrawals using China UnionPay Co. bank cards, a UnionPay official said on Tuesday. Under the new rules, UnionPay cardholders can withdraw up to 50,000 yuan ($7,854) overseas during the last three months of this year, and the amount will be capped at 100,000 yuan for all of next year, the official said.
State-run UnionPay has a virtual monopoly on processing card transactions in China, meaning the limits extend to nearly all Chinese bank- and credit-card holders. It wasn’t clear when the new cap was issued.
The new cap is in addition to an existing 10,000 yuan daily withdrawal limit, part of China’s curbs on how much money can flow across its borders.
The move by China’s State Administration of Foreign Exchange is the latest by Beijing to scrutinize capital outflows.
The People’s Bank of China, the country’s central bank, said earlier this month that its foreign-exchange reserves fell by $93.9 billion, the biggest monthly drop ever, after it surprised the market on Aug. 11 with its decision to devalue the yuan by around 2%.
Key takeaway from the yuan devaluation and capital control:
The collapse of 2 bubbles: housing and stock market.
Weakness in commodities such as steel, copper and oil are seen which signals a weakening economy of which China are the core driver of that expansion since 2008. I suspect that China's GDP is never 8% as it is reported, but rather near 2~4% right now.
China have spent over 100 billion USD in US treasury proceeds to stabilize the yuan collapsing faster due to speculators. The amount of reserves spent at the current rate is unsustainable, it will take just 2 years for them to be used up completely.
Over time yuan will still be heading downwards.
[RS]The Great Dollar Basket V1UPDATE:
fixed the string for gold and silver was using NZDUSD string.
changed oil and gas instruments to support intraday values.
added option to smooth the series.
added option to show/hide groups of series.

Binary option trading by two previous barsThis simple script uses the idea of inertia of the market. if 2 previous candles have the same color, current meant to have that too. Following this signal is equal to buying a binary option on the start of the bar (week here). Signals are shown as arrows on the series. The color of the bar shows the outcome of the current option: yellow is success, black is failure. The same outcomes are at the bottom of the chart. The blue line is the total revenue of all options so far. Can be used as template for strategy simulation.

Patrick's Buy HistogramSet up a trailing stop at about 0. Look for the red dots.and that's a good point to enter a long trade.

Opening Range Breakout with 2 Profit Targets.Opening Range Breakout with 2 Profit Targets.
Updated Indicator now works on all Symbols with Many Different Session Options.
***Known PineScript Issue…While the Opening Range is being Formed the lines only adjust for that individual bar. Just reset Indicator after Opening Range Completes.
***All Times are Based on New York Time
Session Options Forex U.S. Banks Open (8:00), Gold U.S. Open (8:20), Oil U.S. Open (9:00), U.S. Cash Session - Stocks (9:30), NY Forex Open (17:00) , Europe Open (02:00), or if you choose Setting 0 the Session Runs from 00:00 to 00:00 (Midnight to Midnight).
***Ability to use 60 minute Opening Range, 30 minute, 15 minute, and many other options.
***However you can manually change the times in the Inputs Tab to adjust for any session you prefer. This is useful for Day Light Savings Adjustments. Also the default times work if your charts are set to EST Time. If you use A different time zone in your settings you need to Adjust the times in the inputs tab.
Initially Opening Range High and Low plot as Yellow Lines. If Price Goes Above Opening Range then Line Turns Green. If Price Goes Below Opening Range Line Turns Red.
By default the First Profit Target is 1/2 the Width of the Opening Range and the 2nd Profit Target is 1 Times the Opening Range. However these are Adjustable in the Inputs Tab.
By Default the Opening Range Length is 1 Hour. However, you can Change the Opening Range Length to 15 min, 30 min, 2 hours etc. in the Inputs Tab.
Plots a 1 Above or Below Candle when 1st Profit Target is Achieved, and a 2 when 2nd Profit Target is Achieved.

_CM_BarRange_PercentileI know a Trader that went 18 months without a losing trade. This Trader averaged trading 700-800 contracts per month in the Futures markets.
The was not his only system but here were his rules.
He looked at the 60 minute bar and calculated the ranges of the bars over the last 3 months. IF the range of the Bar was Greater Than the 99th Percentile, He would Fade that move or take the trade in the opposite direction.
Thought process is If the Price Bar is Greater Than the 99th Percentile then typically the market reverses. This happens a lot of times at news events. If you’ve studied the markets long enough you know if a Nes based event causes a Huge Move, which we define as Greater than the 99th Percentile, the Market typically moves in the opposite direction.
***This is dependent on the Instrument your trading and the time frame your trading. Some Instruments and time frames this signals a continuation move.
I also added in the Low of the Range based on the 99th Percentile. Often times Low Range Bars…especially if they appear at the top of a swing move, or the bottom of a swing move…create a high probability entry once the High or Low of the bar is taken out in the opposite direction of the previous move…The Low Range bars show indecision after a strong move and create great reversal opportunities.
Works on All Time Frames…again depending on the instrument your trading.
On instruments that MOVE or have High Volatility like Crude and Oil you can get great signals on 1 minute bars.
***Code includes ability to pick ham many bars you want your Look Back Period To Be.
***You can change the percentages to use the 99th Percentile, or 95th percentile, etc…
***The Green Line is the Value of the High Range Percentile.
***The Red Line is the Value of the Low Range Percentile.
***Plots a Magenta Cross on the Red Line if the Range is Below the Low Range Percentile.
***Plots a yellow Cross on the Green Line if the Range is Greater Than the High Range Percentile.
***The Aqua line is the Midpoint of the Range. Or the Average Price Move.
***Colors the Price Bar Yellow if the Range exceeds the High Range Percentile.
***Colors The Bar Magenta if the Range is Less Than the Low Range Percentile
***All parameters can be turned on or off via Check Boxes in the Inputs Tab
