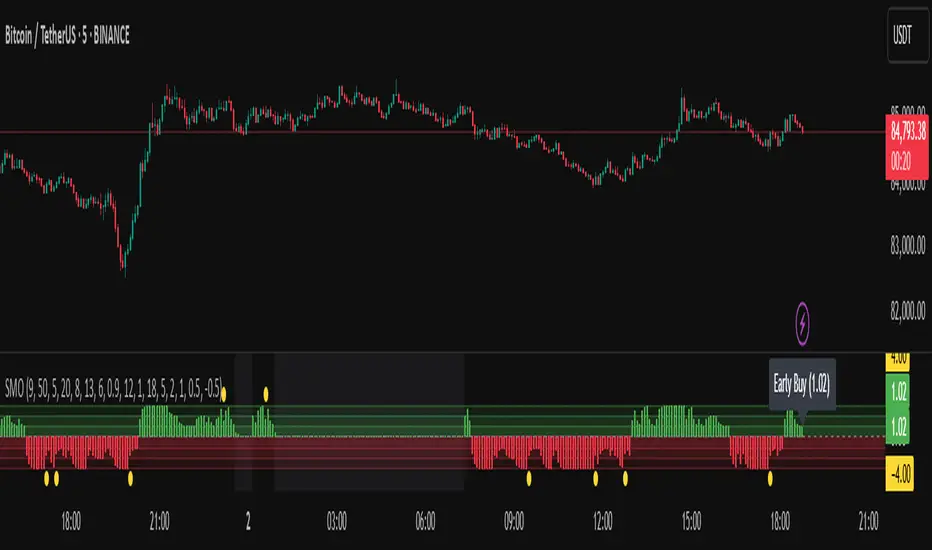
Sentiment Master Oscillator[BullByte]
The Sentiment Master Oscillator is a modern market sentiment indicator designed for traders seeking to identify early trend shifts and potential reversals with clarity. This oscillator combines multiple technical tools—RSI, MACD, EMAs, ADX, ATR, and volume filters—to deliver layered signals that help you assess market momentum in a clear and simplified manner.
Key Features:
- Multi-Indicator Approach :
Integrates RSI (with a smoothing function), MACD, and two EMAs to gauge momentum and trend direction. The oscillator also includes ADX and ATR filters to ensure that only markets with sufficient directional strength and volatility generate signals.
- Dynamic Signal Zones :
The oscillator produces a raw value ranging roughly from -3 to +3 (adjustable via a scaling factor). Positive readings suggest bullish conditions, while negative readings indicate bearish trends. Visual zones (Early, Confirmed, Strong) are clearly marked with color-coded horizontal lines to help you interpret the strength of the signal at a glance.
- Adaptive Smoothing :
For those who prefer quicker, more responsive signals (ideal for scalping), an adaptive smoothing option is available. When enabled, it applies a shorter smoothing period to the oscillator; otherwise, a more conservative base period is used.
- Reversal Alerts :
Yellow dots are plotted on the chart to highlight potential reversal points. These alerts are triggered when the oscillator crosses specific thresholds, coupled with volume and ATR conditions, signaling that a top or bottom may be forming.
- Customizable Filters :
- ATR Filter :Ensures that the market's volatility is above a set threshold before signaling.
- ADX Filter :Confirms sufficient trend strength.
- Volume Filter : Requires that trading volume surges above a multiple of its simple moving average, filtering out low-volume noise.
- Clear Signal Messaging :
Based on the combined signals from various indicators, the script categorizes market sentiment into actionable messages such as "Early Buy", "Confirmed Buy", "Strong Buy", "Early Sell", "Confirmed Sell", and "Strong Sell". A "Grey Zone" label is used when the oscillator is near neutral, indicating that no clear trend is present.
How to Use :
1. Entry and Exit Decisions : Use the different signal stages (Early, Confirmed, Strong) as guides for your entries and exits.
2. Trend Confirmation : Rely on the multi-indicator setup for added confirmation of prevailing market conditions before executing trades.
3. Reversal Cues : Pay attention to the reversal dots for potential turning points in the market, which can be used to adjust positions or initiate trades.
Disclaimer:
This indicator is intended for educational and informational purposes only. It should not be taken as financial advice. Always use appropriate risk management and combine it with your analysis before making any trading decisions. Past performance is not indicative of future results.
By adhering to TradingView's publishing guidelines, the BullByte Sentiment Master is designed to provide transparency, simplicity, and robust analysis tools to enhance your trading strategy. Enjoy a clearer view of market sentiment and make more informed trading decisions!
חפש סקריפטים עבור "RSI MACD"
XGBoost Approximation Indicator with HTF Filter Ver. 3.2XGBoost Approx Indicator with Higher Timeframe Filter Ver. 3.2
What It Is
The XGBoost Approx Indicator is a technical analysis tool designed to generate trading signals based on a composite of multiple indicators. It combines Simple Moving Average (SMA), Relative Strength Index (RSI), MACD, Rate of Change (ROC), and Volume to create a composite indicator score. Additionally, it incorporates a higher timeframe filter (HTF) to enhance trend confirmation and reduce false signals.
This indicator helps traders identify long (buy) and short (sell) opportunities based on a weighted combination of trend-following and momentum indicators.
How to Use It Properly
Setup and Configuration:
Add the indicator to your TradingView chart.
Customize input settings based on your trading strategy. Key configurable inputs include:
HTF filter (default: 1-hour)
SMA, RSI, MACD, and ROC lengths
Custom weightings for each component
Thresholds for buy and sell signals
Understanding the Signals:
Green "Long" Label: Appears when the composite indicator crosses above the buy threshold, signaling a potential buy opportunity.
Red "Short" Label: Appears when the composite indicator crosses below the sell threshold, signaling a potential sell opportunity.
These signals are filtered by a higher timeframe SMA trend to improve accuracy.
Alerts:
The indicator provides alert conditions for long and short entries.
Traders can enable alerts in TradingView to receive real-time notifications when a new signal is triggered.
Safety and Best Practices
Use in Conjunction with Other Analysis: Do not rely solely on this indicator. Combine it with price action, support/resistance levels, and fundamental analysis for better decision-making.
Adjust Settings for Your Strategy: The default settings may not suit all markets or timeframes. Test different configurations before trading live.
Backtest Before Using in Live Trading: Evaluate the indicator’s past performance on historical data to assess its effectiveness in different market conditions.
Avoid Overtrading: False signals can occur, especially in low volatility or choppy markets. Use additional confirmation (e.g., trendlines or moving averages).
Risk Management: Always set stop-loss levels and position sizes to limit potential losses.

Multiple AVWAP [OmegaTools]The Multiple AVWAP indicator is a sophisticated trading tool designed for professional traders who require precision in volume-weighted price tracking. This indicator allows for the deployment of multiple Anchored Volume Weighted Average Price (AVWAP) calculations simultaneously, offering deep insights into price movements, dynamic support and resistance levels, and trend structures across multiple timeframes.
This indicator caters to both institutional and retail traders by integrating flexible anchoring methods, multi-timeframe adaptability, and enhanced visualization features. It also includes deviation bands for statistical analysis, making it a comprehensive volume-based trading solution.
Key Features & Functionalities
1. Multiple AVWAP Configurations
Users can configure up to four distinct AVWAP calculations to track different market conditions.
Supports various anchoring methods:
Fixed: A traditional AVWAP that starts from a defined historical point.
Perpetual: A rolling VWAP that continuously adjusts over time.
Extension: An extension-based AVWAP that projects from past calculations.
High Volume: Anchors AVWAP to the highest volume bar within a specified period.
None: Option to disable AVWAP calculation if not required.
2. Advanced Deviation Bands
Implements standard deviation bands (1st and 2nd deviation) to provide a statistical measure of price dispersion from the AVWAP.
Serves as a dynamic method for identifying overbought and oversold conditions relative to VWAP pricing.
Deviation bands are customizable in terms of visibility, color, and transparency.
3. Multi-Timeframe Support
Users can assign different timeframes to each AVWAP calculation for macro and micro analysis.
Helps in identifying long-term institutional trading levels alongside short-term intraday trends.
4. Z-Score Normalization Mode
Option to standardize oscillator values based on AVWAP deviations.
Converts price movements into a statistical Z-score, allowing traders to measure price strength in a normalized range.
Helps in detecting extreme price dislocations and mean-reversion opportunities.
5. Customizable Visual & Aesthetic Settings
Fully customizable line colors, transparency, and thickness to enhance clarity.
Users can modify AVWAP and deviation band colors to distinguish between different levels.
Configurable display options to match personal trading preferences.
6. Oscillator Mode for Trend & Momentum Analysis
The indicator converts price deviations into an oscillator format, displaying AVWAP strength and weakness dynamically.
This provides traders with a momentum-based perspective on volume-weighted price movements.
User Guide & Implementation
1. Configuring AVWAPs for Optimal Use
Choose the mode for each AVWAP instance:
Fixed (set historical point)
Perpetual (rolling, continuously updated AVWAP)
Extension (projection from past AVWAP levels)
High Volume (anchored to highest volume bar)
None (disables the AVWAP line)
Adjust the length settings to fine-tune calculation sensitivity.
2. Utilizing Deviation Bands for Market Context
Activate deviation bands to see statistical boundaries of price action.
Monitor +1 / -1 and +2 / -2 standard deviation levels for extended price movements.
Consider price action outside of deviation bands as potential mean-reversion signals.
3. Multi-Timeframe Analysis for Institutional-Level Insights
Assign different timeframes to each AVWAP to compare:
Daily VWAP (institutional trading levels)
Weekly VWAP (swing trading trends)
Intraday VWAPs (short-term momentum shifts)
Helps identify where institutional liquidity is positioned relative to price.
4. Activating the Oscillator for Momentum & Bias Confirmation
The oscillator converts AVWAP deviations into a normalized value.
Use overbought/oversold levels to determine strength and potential reversals.
Combine with other indicators (RSI, MACD) for confluence-based trading decisions.
Trading Applications & Strategies
5. Trend Confirmation & Institutional VWAP Tracking
If price consistently holds above the primary AVWAP, it signals a bullish trend.
If price remains below AVWAP, it indicates selling pressure and a bearish trend.
Monitor retests of AVWAP levels for potential trend continuation or reversal.
6. Dynamic Support & Resistance Levels
AVWAP lines act as dynamic floating support and resistance zones.
Price bouncing off AVWAP suggests continuation, whereas breakdowns indicate a shift in momentum.
Look for confluence with high-volume zones for stronger trade signals.
7. Mean Reversion & Statistical Edge Trading
Prices that deviate beyond +2 or -2 standard deviations often revert toward AVWAP.
Mean reversion traders can fade extended moves and target AVWAP re-tests.
Helps in identifying exhaustion points in trending markets.
8. Institutional Liquidity & Volume Footprints
Institutions often execute large trades near VWAP zones, causing price reactions.
Tracking multi-timeframe AVWAP levels allows traders to anticipate key liquidity areas.
Use higher timeframe AVWAPs as macro support/resistance for swing trading setups.
9. Enhancing Momentum Trading with AVWAP Oscillator
The oscillator provides a momentum-based measure of AVWAP deviations.
Helps in confirming entry and exit timing for trend-following trades.
Useful for pairing with stochastic oscillators, MACD, or RSI to validate trade decisions.
Best Practices & Trading Tips
Use in Conjunction with Volume Analysis: Combine with volume profiles, OBV, or CVD for increased accuracy.
Adjust Timeframes Based on Trading Style: Scalpers can focus on short-term AVWAP, while swing traders benefit from weekly/daily AVWAP tracking.
Backtest Different AVWAP Configurations: Experiment with different anchoring methods and lookback periods to optimize trade performance.
Monitor Institutional Order Flow: Identify key VWAP zones where institutional traders may be active.
Use with Other Technical Indicators: Enhance trading confidence by integrating with moving averages, Bollinger Bands, or Fibonacci retracements.
Final Thoughts & Disclaimer
The Multiple AVWAP indicator provides a comprehensive approach to volume-weighted price tracking, making it ideal for professional traders. While this tool enhances market clarity and trade decision-making, it should be used as part of a well-rounded trading strategy with risk management principles in place.
This indicator is provided for informational and educational purposes only. Trading involves risk, and past performance is not indicative of future results. Always conduct your own analysis and due diligence before executing trades.
OmegaTools - Enhancing Market Clarity with Precision Indicators

SMA Trend Filter Oscillator (Adaptive)The "SMA Trend Filter Oscillator (Adaptive)" indicator is a technical analysis tool that helps traders determine the direction and strength of a trend based on an adaptive Simple Moving Average (SMA). The oscillator calculates the difference between the closing price and the SMA value, allowing for the visualization of price deviation from the average and the assessment of current market dynamics.
Key Features of the Indicator:
Adaptation to Time Frame: The indicator automatically adjusts the SMA length based on the current time frame, making it versatile for use across different time intervals. For example:
Monthly Time Frame: SMA with a length of 50.
Weekly Time Frame: SMA with a length of 40.
Daily Time Frame: SMA with a length of 20.
Hourly Time Frame: SMA with a length of 10.
Intraday Time Frames: SMA with a length of 5 (for time frames up to 15 minutes) or 7 (for others).
SMA-Based Oscillator: The oscillator is calculated as the difference between the closing price and the SMA value. This allows:
Bullish Trend Identification: When the oscillator is above zero (price is above SMA).
Bearish Trend Identification: When the oscillator is below zero (price is below SMA).
Visualization: The oscillator is displayed as a histogram, where:
Green Color indicates a bullish trend.
Red Color indicates a bearish trend.
The Zero Line (Gray) serves as a reference for trend reversal.
How to Use the Indicator:
Trend Identification: If the oscillator is above zero and colored green, it signals a bullish trend. If it is below zero and colored red, it indicates a bearish trend.
Trend Strength: The larger the oscillator value (in either direction), the stronger the trend. Small oscillator values (close to zero) may indicate sideways movement or weak trend.
Entry and Exit Points:
Buy: When the oscillator crosses the zero line from below to above (transition from red to green).
Sell: When the oscillator crosses the zero line from above to below (transition from green to red).
Signal Filtering: Use the indicator in combination with other technical analysis tools (e.g., RSI, MACD, or support/resistance levels) to confirm signals.
Advantages of the Indicator:
Adaptability: Automatic adjustment of SMA length to the current time frame makes it versatile.
Simplicity: Intuitive histogram visualization allows for quick assessment of market conditions.
Flexibility: Can be used on any market (stocks, forex, cryptocurrencies) and time frame.
Limitations:
Lag: Like any SMA-based indicator, it can lag due to the use of average values.
False Signals: In sideways markets (flat), the indicator may generate false signals.
Risk Management:
Always set stop-losses and take-profits to minimize losses.
Test the indicator on historical data before using it on a live account.
The "SMA Trend Filter Oscillator (Adaptive)" is a powerful tool for traders seeking to quickly evaluate trends and their strength. Its adaptability and simplicity make it suitable for both novice and experienced traders.
Индикатор "SMA Trend Filter Oscillator (Adaptive)" — это инструмент технического анализа, который помогает трейдерам определять направление тренда и его силу на основе адаптивной скользящей средней (SMA). Осциллятор рассчитывает разницу между ценой закрытия и значением SMA, что позволяет визуализировать отклонение цены от среднего значения и оценивать текущую рыночную динамику.
Основные особенности индикатора:
Адаптация к таймфрейму
Индикатор автоматически подстраивает длину SMA в зависимости от текущего таймфрейма, что делает его универсальным для использования на различных временных интервалах. Например:
Месячный таймфрейм (Monthly): SMA с длиной 50.
Недельный таймфрейм (Weekly): SMA с длиной 40.
Дневной таймфрейм (Daily): SMA с длиной 20.
Часовой таймфрейм (Hourly): SMA с длиной 10.
Внутридневные таймфреймы (Intraday): SMA с длиной 5 (для таймфреймов до 15 минут) или 7 (для остальных).
Осциллятор на основе SMA
Осциллятор рассчитывается как разница между ценой закрытия и значением SMA. Это позволяет:
Определять бычий тренд, когда осциллятор выше нуля (цена выше SMA).
Определять медвежий тренд, когда осциллятор ниже нуля (цена ниже SMA).
Визуализация
Осциллятор отображается в виде гистограммы, где:
Зелёный цвет указывает на бычий тренд.
Красный цвет указывает на медвежий тренд.
Линия нуля (серая) служит ориентиром для определения смены тренда.
Как использовать индикатор:
Определение тренда
Если осциллятор находится выше нуля и окрашен в зелёный цвет, это сигнализирует о бычьем тренде.
Если осциллятор находится ниже нуля и окрашен в красный цвет, это указывает на медвежий тренд.
Сила тренда
Чем больше значение осциллятора (в положительную или отрицательную сторону), тем сильнее тренд.
Небольшие значения осциллятора (близкие к нулю) могут указывать на боковое движение или слабость тренда.
Точки входа и выхода
Покупка (Buy): Когда осциллятор пересекает нулевую линию снизу вверх (переход из красной зоны в зелёную).
Продажа (Sell): Когда осциллятор пересекает нулевую линию сверху вниз (переход из зелёной зоны в красную).
Фильтрация сигналов
Используйте индикатор в сочетании с другими инструментами технического анализа (например, RSI, MACD или уровнями поддержки/сопротивления) для подтверждения сигналов.
Преимущества индикатора:
Адаптивность: Автоматическая настройка длины SMA под текущий таймфрейм делает индикатор универсальным.
Простота: Интуитивно понятная визуализация в виде гистограммы позволяет быстро оценить рыночную ситуацию.
Гибкость: Может использоваться на любых рынках (акции, форекс, криптовалюты) и таймфреймах.
Ограничения:
Запаздывание: Как и любой индикатор на основе SMA, он может запаздывать из-за использования средних значений.
Ложные сигналы: В условиях бокового движения (флэта) индикатор может генерировать ложные сигналы.
Управление рисками: Всегда устанавливайте стоп-лоссы и тейк-профиты, чтобы минимизировать потери.
Тестирование: Перед использованием на реальном счёте протестируйте индикатор на исторических данных.
Индикатор "SMA Trend Filter Oscillator (Adaptive)" — это мощный инструмент для трейдеров, которые хотят быстро оценить тренд и его силу. Его адаптивность и простота делают его подходящим как для начинающих, так и для опытных трейдеров

Power Trend [MacAlgo]Description:
The Power Trend Indicator is a sophisticated technical analysis tool that overlays on your trading charts to identify prevailing market trends. It utilizes a combination of ATR-based trend calculations, moving averages, volume analysis, and momentum indicators to generate reliable buy and sell signals. Additionally, it offers customizable settings to adapt to various trading styles and timeframes.
Key Features:
Adaptive ATR Calculation: Automatically adjusts the ATR (Average True Range) period and multiplier based on the selected timeframe for more accurate trend detection.
Dynamic Trend Lines: Plots continuous trend lines with color-coded bars to visually represent bullish and bearish trends.
Buy/Sell Signals: Generates standard and power buy/sell signals to help you make informed trading decisions.
Volume Analysis: Incorporates average buy and sell volumes to identify strong market movements.
Multiple Timeframe Support: Automatically adjusts the indicator's timeframe or allows for manual selection to suit your trading preferences.
Highlighting: Highlights trending bars for easy visualization of market conditions.
Alerts: Customizable alert conditions to notify you of potential trading opportunities in real-time.
How it Works:
1. ATR-Based Trend Calculation:
ATR Period & Multiplier: Calculates ATR based on user-defined periods and multipliers, dynamically adjusting according to the chart's timeframe.
Trend Determination: Identifies trends as bullish (1) or bearish (-1) based on price movements relative to ATR-based upper (up) and lower (dn) trend lines.
2. Moving Averages:
EMA & SMA: Calculates exponential and simple moving averages to smooth price data and identify underlying trends.
AlphaTrend Line: Combines a 50-period EMA and a 30-period SMA on a 4-hour timeframe to create the AlphaTrend line, providing a robust trend reference.
3. Volume Analysis:
Buy/Sell Volume: Differentiates between buy and sell volumes to gauge market strength.
Average Volume: Compares current volume against average buy/sell volumes to detect significant market movements.
4. Momentum Indicators:
RSI, MACD, OBV: Incorporates Relative Strength Index (RSI), Moving Average Convergence Divergence (MACD), and On-Balance Volume (OBV) to assess momentum and confirm trend strength.
5. Signal Generation:
Standard Signals: Basic buy and sell signals based on trend crossovers.
Power Signals: Enhanced signals requiring multiple conditions (e.g., increased volume, momentum confirmation) for higher confidence trades.
Customization Options:
Tailor the Power Trend Indicator to your specific trading needs with the following settings:
ATR Period: Set the period for ATR calculation (default: 8).
ATR Multiplier: Adjust the ATR multiplier to fine-tune trend sensitivity (default: 3.0).
Source: Choose the price source (e.g., HL2, Close) for calculations.
Change ATR Calculation Method: Toggle between different ATR calculation methods.
Show Buy/Sell Signals: Enable or disable the display of buy and sell signals on the chart.
Highlighting: Turn on or off the bar highlighting feature.
Timeframe Adjustment: Choose between automatic timeframe adjustment or manually set
the indicator's timeframe.
Manual Indicator Timeframe: If manual adjustment is selected, specify the desired timeframe (default: 60 minutes).
Visual Components:
Trend Lines: Continuous lines representing the current trend, color-coded for easy identification (green for bullish, red for bearish, orange for neutral).
Bar Coloring: Bars are colored based on the current trend and its relationship to the AlphaTrend line.
Buy/Sell Triangles: Triangular markers appear on the chart to indicate buy and sell signals.
Power Signals: Larger triangles highlight strong buy and sell opportunities based on multiple confirming factors.
Highlighting: Transparent overlays highlight trending areas to enhance visual clarity.
Alerts:
Stay informed with customizable alerts that notify you of important market movements:
SuperTrend Buy/Sell: Alerts when standard buy or sell signals are generated.
Power Buy/Sell Alerts: Notifications for strong buy or sell signals based on comprehensive conditions.
Trend Direction Change: Alerts when the trend changes from bullish to bearish or vice versa.
How to Use:
Add to Chart: Apply the Power Trend Indicator to your preferred trading chart on TradingView.
Configure Settings: Adjust the input parameters to match your trading style and the timeframe you are analyzing.
Analyze Trends: Observe the trend lines, bar colors, and AlphaTrend line to understand the current market trend.
Follow Signals: Look for buy and sell signals or power signals to identify potential entry and exit points.
Set Alerts: Enable alerts to receive real-time notifications of significant trading opportunities.
Adjust as Needed: Fine-tune the settings based on market conditions and your trading experience.
Important Notes:
Backtesting: While the Power Trend Indicator is built using robust technical analysis principles, it's essential to backtest and validate its performance within your trading strategy.
Market Conditions: The indicator performs best in trending markets. In sideways or highly volatile markets, signal reliability may vary.
Risk Management: Always employ proper risk management techniques when trading based on indicator signals to protect your capital.
Disclaimer:
This indicator is intended for educational purposes only and does not provide financial advice or guarantee future performance. Trading involves risk, and past results are not indicative of future outcomes. Always conduct your own analysis and risk management.

COIN/BTC Volume-Weighted DivergenceThe COIN/BTC Volume-Weighted Divergence indicator identifies buy and sell signals by analyzing deviations between Coinbase and Bitcoin prices relative to their respective VWAPs (Volume-Weighted Average Price). This method isolates points of potential trend reversals, overextensions, or relative mispricing based on volume-adjusted price benchmarks.
The indicator leverages Coinbase’s high beta relative to Bitcoin in bull markets. A buy signal occurs when Coinbase is below VWAP (indicating undervaluation) while Bitcoin is above VWAP (signaling strong broader momentum). A sell signal is generated when Coinbase trades above VWAP (indicating overvaluation) while Bitcoin moves below VWAP (indicating weakening momentum).
This divergence logic enables traders to identify misalignment between Bitcoin-driven market trends and Coinbase’s price behavior. The indicator effectively identifies undervalued entry points and signals exits before speculative extensions are correct. It provides a systematic approach to trading during trending conditions, aligning decisions with volume-weighted price dynamics and inter-asset relationships.
How It Works
1. VWAP:
“fair value” benchmark combining price and volume.
• Above VWAP: Bullish momentum.
• Below VWAP: Bearish momentum.
2. Divergence:
• Coinbase Divergence: close - coin_vwap (distance from COIN’s VWAP).
• Bitcoin Divergence: btc_price - btc_vwap (distance from BTC’s VWAP).
3. Signals:
• Buy: Coinbase is below VWAP (potentially oversold), and Bitcoin is above VWAP (broader bullish trend).
• Sell: Coinbase is above VWAP (potentially overbought), and Bitcoin is below VWAP (broader bearish trend).
4. Visualization:
• Green triangle: Buy signal.
• Red triangle: Sell signal.
Strengths
• Combines price and volume for reliable insights.
• Highlights potential trend reversals or overextensions.
• Exploits correlations between Coinbase and Bitcoin.
Limitations
• Struggles in sideways markets.
• Sensitive to volume spikes, which may distort VWAP.
• Ineffective in strong trends where divergence persists.
Improvements
1. Z-Scores: Use statistical thresholds (e.g., ±2 std dev) for stronger signals.
2. Volume Filter: Generate signals only during high-volume periods.
3. Momentum Confirmation: Combine with RSI or MACD for better reliability.
4. Multi-Timeframe VWAP: Use intraday, daily, and weekly VWAPs for deeper analysis.
Complementary Tools
• Momentum Indicators: RSI, MACD for trend validation.
• Volume-Based Metrics: OBV, cumulative delta volume.
• Support/Resistance Levels: Enhance reversal accuracy.

Buy Low Sell High Composite Upgraded V6 [kristian6ncqq]NOTICE: This script is an upgraded and enhanced version of the original "Buy Low Sell High Composite" indicator by (published in 2017).
The original script provided a composite indicator combining multiple technical analysis metrics such as RSI, MACD, and MFI.
Why I Republished This Script
I found the original indicator to be exceptionally useful for identifying optimal accumulation zones for stocks or assets when prices are low (red area) and potential profit-taking zones when prices are high (green area).
To ensure it remains accessible and functional for modern trading strategies, I have updated and enhanced the original version with additional features and flexibility.
Intended Use
This indicator is designed for traders and investors looking to:
Accumulate stocks or assets when the price is in the low (red) zone.
Take profits or reduce positions when the price is in the high (green) zone.
The composite score provides a clear visualization of multiple technical indicators combined into a single actionable signal.
Enhancements in This Version
Updated to Pine Script v6 (from version 3).
Added input parameters for key settings (e.g., RSI length, MACD parameters, smoothing).
Introduced Chande Momentum Oscillator (CMO) and directional ADX for improved trend detection.
Implemented slope-based trend coloring for outer edges to highlight significant changes in trend direction.
Enhanced visualizations with customizable thresholds and smoothing for improved usability.
Credits
Original script: "Buy Low Sell High Composite" by , 2017.
URL to the original script: Buy Low Sell High Composite.
This script is designed to build upon the strengths of the original while adding flexibility and new features to meet the needs of modern traders.
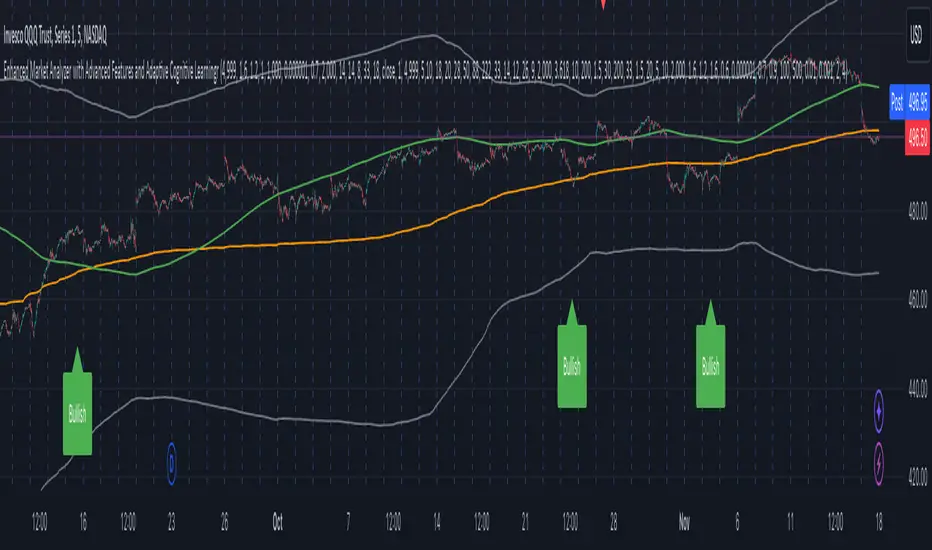
Enhanced Market Analyzer with Adaptive Cognitive LearningThe "Enhanced Market Analyzer with Advanced Features and Adaptive Cognitive Learning" is an advanced, multi-dimensional trading indicator that leverages sophisticated algorithms to analyze market trends and generate predictive trading signals. This indicator is designed to merge traditional technical analysis with modern machine learning techniques, incorporating features such as adaptive learning, Monte Carlo simulations, and probabilistic modeling. It is ideal for traders who seek deeper market insights, adaptive strategies, and reliable buy/sell signals.
Key Features:
Adaptive Cognitive Learning:
Utilizes Monte Carlo simulations, reinforcement learning, and memory feedback to adapt to changing market conditions.
Adjusts the weighting and learning rate of signals dynamically to optimize predictions based on historical and real-time data.
Hybrid Technical Indicators:
Custom RSI Calculation: An RSI that adapts its length based on recursive learning and error adjustments, making it responsive to varying market conditions.
VIDYA with CMO Smoothing: An advanced moving average that incorporates Chander Momentum Oscillator for adaptive smoothing.
Hamming Windowed VWMA: A volume-weighted moving average that applies a Hamming window for smoother calculations.
FRAMA: A fractal adaptive moving average that responds dynamically to price movements.
Advanced Statistical Analysis:
Skewness and Kurtosis: Provides insights into the distribution and potential risk of market trends.
Z-Score Calculations: Identifies extreme market conditions and adjusts trading thresholds dynamically.
Probabilistic Monte Carlo Simulation:
Runs thousands of simulations to assess potential price movements based on momentum, volatility, and volume factors.
Integrates the results into a probabilistic signal that informs trading decisions.
Feature Extraction:
Calculates a variety of market metrics, including price change, momentum, volatility, volume change, and ATR.
Normalizes and adapts these features for use in machine learning algorithms, enhancing signal accuracy.
Ensemble Learning:
Combines signals from different technical indicators, such as RSI, MACD, Bollinger Bands, Stochastic Oscillator, and statistical features.
Weights each signal based on cumulative performance and learning feedback to create a robust ensemble signal.
Recursive Memory and Feedback:
Stores and averages past RSI calculations in a memory array to provide historical context and improve future predictions.
Adaptive memory factor adjusts the influence of past data based on current market conditions.
Multi-Factor Dynamic Length Calculation:
Determines the length of moving averages based on volume, volatility, momentum, and rate of change (ROC).
Adapts to various market conditions, ensuring that the indicator is responsive to both high and low volatility environments.
Adaptive Learning Rate:
The learning rate can be adjusted based on market volatility, allowing the system to adapt its speed of learning and sensitivity to changes.
Enhances the system's ability to react to different market regimes.
Monte Carlo Simulation Engine:
Simulates thousands of random outcomes to model potential future price movements.
Weights and aggregates these simulations to produce a final probabilistic signal, providing a comprehensive risk assessment.
RSI with Dynamic Adjustments:
The initial RSI length is adjusted recursively based on calculated errors between true RSI and predicted RSI.
The adaptive RSI calculation ensures that the indicator remains effective across various market phases.
Hybrid Moving Averages:
Short-Term and Long-Term Averages: Combines FRAMA, VIDYA, and Hamming VWMA with specific weights for a unique hybrid moving average.
Weighted Gradient: Applies a color gradient to indicate trend strength and direction, improving visual clarity.
Signal Generation:
Generates buy and sell signals based on the ensemble model and multi-factor analysis.
Uses percentile-based thresholds to determine overbought and oversold conditions, factoring in historical data for context.
Optional settings to enable adaptation to volume and volatility, ensuring the indicator remains effective under different market conditions.
Monte Carlo and Learning Parameters:
Users can customize the number of Monte Carlo simulations, learning rate, memory factor, and reward decay for tailored performance.
Applications:
Scalping and Day Trading:
The fast response of the adaptive RSI and ensemble learning model makes this indicator suitable for short-term trading strategies.
Swing Trading:
The combination of long-term moving averages and probabilistic models provides reliable signals for medium-term trends.
Volatility Analysis:
The ATR, Bollinger Bands, and adaptive moving averages offer insights into market volatility, helping traders adjust their strategies accordingly.
Dynamic Market Correlation Analyzer (DMCA) v1.0Description
The Dynamic Market Correlation Analyzer (DMCA) is an advanced TradingView indicator designed to provide real-time correlation analysis between multiple assets. It offers a comprehensive view of market relationships through correlation coefficients, technical indicators, and visual representations.
Key Features
- Multi-asset correlation tracking (up to 5 symbols)
- Dynamic correlation strength categorization
- Integrated technical indicators (RSI, MACD, DX)
- Customizable visualization options
- Real-time price change monitoring
- Flexible timeframe selection
## Use Cases
1. **Portfolio Diversification**
- Identify highly correlated assets to avoid concentration risk
- Find negatively correlated assets for hedging strategies
- Monitor correlation changes during market events
2. Pairs Trading
- Detect correlation breakdowns for potential trading opportunities
- Track correlation strength for pair selection
- Monitor technical indicators for trade timing
3. Risk Management
- Assess portfolio correlation risk in real-time
- Monitor correlation shifts during market stress
- Identify potential portfolio vulnerabilities
4. **Market Analysis**
- Study sector relationships and rotations
- Analyze cross-asset correlations (e.g., stocks vs. commodities)
- Track market regime changes through correlation patterns
Components
Input Parameters
- **Timeframe**: Custom timeframe selection for analysis
- **Length**: Correlation calculation period (default: 20)
- **Source**: Price data source selection
- **Symbol Selection**: Up to 5 customizable symbols
- **Display Options**: Table position, text color, and size settings
Technical Indicators
1. **Correlation Coefficient**
- Range: -1 to +1
- Strength categories: Strong/Moderate/Weak (Positive/Negative)
2. **RSI (Relative Strength Index)**
- 14-period default setting
- Momentum comparison across assets
3. **MACD (Moving Average Convergence Divergence)**
- Standard settings (12, 26, 9)
- Trend direction indicator
4. **DX (Directional Index)**
- Trend strength measurement
- Based on DMI calculations
Visual Components
1. **Correlation Table**
- Symbol identifiers
- Correlation coefficients
- Correlation strength descriptions
- Price change percentages
- Technical indicator values
2. **Correlation Plot**
- Real-time correlation visualization
- Multiple correlation lines
- Reference levels at -1, 0, and +1
- Color-coded for easy identification
Installation and Setup
1. Load the indicator on TradingView
2. Configure desired symbols (up to 5)
3. Adjust timeframe and calculation length
4. Customize display settings
5. Enable/disable desired components (table, plot, RSI)
Best Practices
1. **Symbol Selection**
- Choose related but distinct assets
- Include a mix of asset classes
- Consider market cap and liquidity
2. **Timeframe Selection**
- Match timeframe to trading strategy
- Consider longer timeframes for strategic analysis
- Use shorter timeframes for tactical decisions
3. **Interpretation**
- Monitor correlation changes over time
- Consider multiple timeframes
- Combine with other technical analysis tools
- Account for market conditions and volatility
Performance Notes
- Calculations update in real-time
- Resource usage scales with number of active symbols
- Historical data availability may affect initial calculations
Version History
- v1.0: Initial release with core functionality
- Multi-symbol correlation analysis
- Technical indicator integration
- Customizable display options
Future Enhancements (Planned)
- Additional technical indicators
- Advanced correlation algorithms
- Enhanced visualization options
- Custom alert conditions
- Statistical significance testing

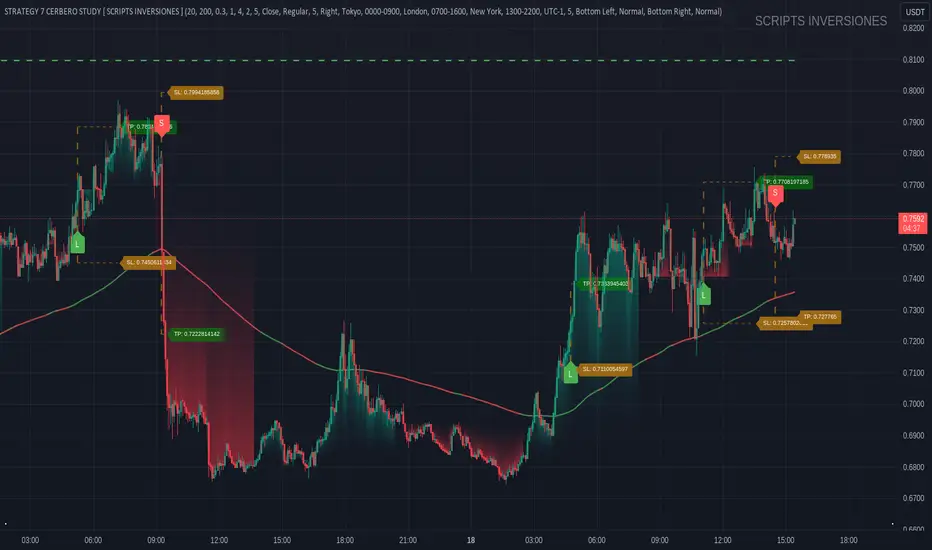
STRATEGY 7 CERBERO STUDY [ SCRIPTS INVERSIONES ]USE:
ADXCONFIG:
Purpose: Select the range for the strength required in the ADX for our alert condition. This setting allows traders to define the threshold at which the ADX indicates sufficient market momentum for trading decisions.
USETRENDLOGIC:
Function: Utilizes the trend EMA to make long entries when the price is above and short entries when it is below the EMA. This provides a simple, clear rule based on the relative position of the price to the EMA, facilitating trend-following strategies.
SELECT A VALUE FOR EMA:
Description: Choose the range for the EMA, and the alert conditions will be applied depending on whether the price is above or below when USETRENDLOGIC is activated. This allows for flexibility in setting the sensitivity of the EMA to price movements.
ACTIVATE/DEACTIVATE EMA 35 AND EMA 50:
Usage: These EMAs are used to determine the trend in shorter periods of time, providing traders with quick insights into market dynamics and potential trend shifts.
LOGIC 1:
ENABLE/DEACTIVATE STRATEGY 1/1:
Conditions: If the 1/1 strategy is activated, it will use the following setup:
Volume entry + EMA condition + BREAK
ADX > ADXCONF
DMI+/DMI- higher depending on the trend
Explanation: This strategy combines volume analysis with EMA and trend indicators to identify strong, actionable trading signals.
This image shows its use.
LOGIC 2:
ENABLE/DEACTIVATE STRATEGY 1/2:
Conditions: If the 1/2 strategy is activated, it utilizes:
Volume entry + EMA condition + BREAK
Purpose: Focuses on significant breaks in EMA levels with accompanying high volume, suggesting a strong momentum-backed entry point.
This image shows its use.
LOGIC 3:
ENABLE/DEACTIVATE STRATEGY 1/3:
Conditions: If the 1/3 strategy is activated, it involves:
Volume entry + EMA condition
RSI
ADX > ADXCONF and DMI+/DMI- higher depending on the trend
Utility: Combines volume, EMA, and RSI indicators with ADX strength to filter entries during extreme market conditions, enhancing the probability of capturing significant moves.
This image shows its use.
LOGIC 4:
ENABLE/DEACTIVATE STRATEGY 1/4:
Conditions: If the 1/4 strategy is activated, it incorporates:
Volume entry + EMA condition
RSI ABOVE/BELOW your EMA
Application: This strategy uses RSI levels in relation to an EMA to fine-tune entry points, helping to confirm momentum before entering trades.
This image shows its use.
LOGIC 5:
ENABLE/DEACTIVATE STRATEGY 1/5:
Conditions: If the 1/5 strategy is activated, it utilizes:
Volume entry + EMA condition
Function: A straightforward strategy that uses volume and EMA conditions to identify primary entry points, focusing on the basic elements of trend and momentum.
This image shows its use.
POI LOGIC (Point of Interest)
Activate/Deactivate 2/1 POI Strategy
When the 2/1 POI strategy is activated, it employs the following conditions to determine market entries:
Volume Entry + EMA Condition + POI TOUCHED + ADX > ADXCONF and DMI+/DMI- higher depending on the trend:
Volume Entry: Looks for significant volume as confirmation that there is enough interest at the current price level.
EMA Condition: A specific condition regarding the Exponential Moving Average (EMA) must be met, such as the price being above or below the EMA, depending on the anticipated direction of price movement.
POI Touched: The price must have touched a previously identified Point of Interest, indicating a level where the price has reacted before.
ADX > ADXCONF: The Average Directional Movement Index (ADX) must be greater than a set value (ADXCONF), indicating sufficient trend strength.
DMI+/DMI- higher depending on the trend: The Directional Movement Indicator Plus (DMI+) or Minus (DMI-) needs to be higher, depending on whether the trend is bullish or bearish, respectively.
This strategy is designed to capitalize on price levels where the market has shown previous reactions, using a combination of technical analysis and volume to confirm entry signals.
This image shows its use.
DIVERGENCE LOGIC
Activate/Deactivate Divergence Strategy
When the divergence strategy is activated, it employs the following conditions for making trading decisions:
Volume Entry + Divergence: This condition indicates that a market entry should be considered when there is a divergence between the price and a technical indicator (such as RSI, MACD, etc.), accompanied by significant volume.
Divergence occurs when the price of an asset moves in the opposite direction of the technical indicator, which may suggest a potential reversal in market trends. Volume plays a crucial role here, as high volume during a divergence can confirm the strength of the potential trend reversal.
This strategy aims to capitalize on moments when the market shows signs of exhaustion in a trend and is potentially gearing up to reverse, making divergences a key component in anticipating significant movements.
This image shows its use.
FOREX LOGIC
Activate/Deactivate FOREX Strategy
When the Forex strategy is activated, it uses the following conditions to execute trades:
Volume Entry + DI+ > DI- for long entries: This condition means that to consider a long position (buy), the Positive Directional Indicator (DI+) must be greater than the Negative Directional Indicator (DI-). This suggests that the market trend is moving upward, supported by sufficient trading volume backing this direction.
DI- > DI+ for short entries: For short entries (sells), the required condition is that the DI- (Negative Directional Indicator) is greater than the DI+ (Positive Directional Indicator). This indicates that the market trend is downward and that there is adequate volume confirming this bearish trend.
These conditions ensure that market entries are made with a clear confirmation of market direction based on volume and directional movement, which is crucial for increasing the probabilities of successful Forex trades.
This image shows its use.
ICT STUDY
Activate/Deactivate Strategy ICT
USAGE:
We use all these components in our indicator to provide comprehensive and effective control when trading using the ICT (Inner Circle Trader) methodology. Each element aids in visualizing and anticipating market movements more accurately, facilitating informed and strategic decision-making.
POI (Point of Interest): Used to identify critical points where the market has shown significant past activity, offering clues on potential future price reactions.
Imbalances: Crucial for spotting areas where supply or demand has been lacking, suggesting potential entry or exit points based on trend reversal or continuation.
ZigZag: Helps to eliminate market noise, allowing for clear identification of significant highs and lows, vital for trend analysis and reversal.
Supports and Resistances: Fundamental in determining price levels at which the market might stop or reverse, essential for any trading strategy.
Fibonacci: Utilized to find support and resistance levels based on mathematical proportions that naturally occur in markets, informing potential areas of interest.
Inducement: We observe these patterns to identify moments when price manipulations might be occurring, helping to avoid traps and enhance entries.
Sweep: Analyzed to understand how and where major market players are clearing accumulated orders, which can indicate significant price movements.
CHOCH (Change of Character): Used to detect a shift in price behavior, which may signal a reversal or trend change.
BOS (Break of Structure): Key for detecting when the price breaks through significant structures, suggesting changes in market direction.
Forecasting Length: Determines how far the price may reach into the future based on current analysis, crucial for planning long-term trades.
This image shows its use.
IF USE TP AND SL
Fibonacci Oscillator (Expo)█ Overview
The Fibonacci Oscillator is a multi-faceted oscillator designed to provide traders with a comprehensive understanding of market trends and retracement points. Built on the Fibonacci ratios, it combines the functionalities of popular oscillators like RSI and MACD with unique insights into the market structure. This oscillator not only helps identify trend direction but also pinpoints overbought and oversold levels, making it an essential tool for various trading strategies.
█ How to Use
Identify Trends
Use the oscillator to identify the direction of the market trend.
Identify Retracements
Use the oscillator to identify the retracements.
█ Settings
Fibonacci Settings
These settings let you customize the Fibonacci level to focus on, thereby allowing you to tailor the oscillator according to your trading preferences.
Oscillator Settings
You can also choose between different oscillator types (RSI, MACD, Histogram) and adjust their respective settings like lengths, signals, and colors.
-----------------
Disclaimer
The information contained in my Scripts/Indicators/Ideas/Algos/Systems does not constitute financial advice or a solicitation to buy or sell any securities of any type. I will not accept liability for any loss or damage, including without limitation any loss of profit, which may arise directly or indirectly from the use of or reliance on such information.
All investments involve risk, and the past performance of a security, industry, sector, market, financial product, trading strategy, backtest, or individual's trading does not guarantee future results or returns. Investors are fully responsible for any investment decisions they make. Such decisions should be based solely on an evaluation of their financial circumstances, investment objectives, risk tolerance, and liquidity needs.
My Scripts/Indicators/Ideas/Algos/Systems are only for educational purposes!

ZN Market CycleDescription
The purpose of this indicator is to create symbols that try to show the most accurate positions possible for trading. The formation of BUY/SELL symbols is based on the intersection of RSI, MACD and 6 bar moving average. Additionally, BOLLINGER bands were used to determine the lower and upper points. For example, while the price is falling, it will create an BOTTOM symbol when the price crosses the lower BOLLINGER band upwards. If this transition is accompanied by the RSI breaking its average upwards, it will produce the STRONG BOTTOM symbol. If the RSI average crosses the RSIMA direction upwards, it will produce the DEEP symbol. Of course, the scenario described above is also valid in the opposite direction. The purpose of the icons on the screen is indicated by the text above them. However, a detailed explanation of what these symbols do is given below.
Symbols
The symbols are explained one by one below.
BOTTOM: Indicates that the fall has slowed down or may have been completed.
STRONG BOTTOM: Indicates that the fall has stopped or may have been completed.
TOP: Indicates that the ascent has slowed down or may have been completed.
STRONG TOP: Indicates that the ascent has stopped or may have been completed.
BUY: Indicates the convenient location to make a buying. Buying pressure may increase after this symbol.
STRONG BUY: Indicates the most suitable location for buying. It should be considered that a strong buying wave may come after the appearance of this symbol.
SELL: Indicates the appropriate location to selling Selling pressure may increase after this symbol.
STRONG SELL: Indicates the most suitable position to selling. It should be considered that a strong selling wave may come after the appearance of this symbol.
PEAK: It indicates that the uptrend has come to an end.
DEEP: It indicates that the downtrend has come to an end.
ARROWS: Arrows show the trend direction. Since it varies a lot, it should be used to follow the trend rather than buy/sell. However, the appearance of a downward arrow shortly after a buy signal should suggest that the buy signal is fake. In this case, the buying position can be closed. This also applies to the selling process.
Best Use
This indicator should be used for SPOT trades. Regardless, since it is not possible to know exactly the direction of the market, it should be considered to buy gradually at buy signals and sell gradually at sell signals.
It should be followed for at least a 4-hour period. We do not recommend its use as the margin of error will increase in shorter time periods.
After a buy signal comes, a short decline may occur and the rise may begin. An immediate rise should not be expected after the signal arrives. Since the signals are not guaranteed to work 100%, we do not recommend you to trade with all your money.
No Repainting
Repainting is definitely not done. After the symbols appear, the closing should be expected. Once the closing occurs, the symbol will now be permanent.
Disclaimer
This indicator is for informational purposes only and should be used for educational purposes only. You may lose money if you rely on this to trade without additional information. Use at your own risk.
Version
v1.0

Price Deviation Indicator (PDI)Management
The Price Deviation Indicator (PDI) was developed by "DimArt". This indicator allows you to determine the percentage deviation of the price from its average value over a certain period of time. The larger the deviation, the higher the histogram on the indicator chart. The PDI indicator can be useful for identifying a trend reversal in combination with other technical indicators, such as RSI, MACD, and others. For example, if the RSI and MACD indicators show the beginning of a possible trend reversal, using the PDI indicator can confirm this signal by showing the deviation of the current price from the average price. This can help the trader make more accurate trading decisions based on a strong signal.
Description
To calculate the values of the "Price Deviation Indicator" (PDI), we use the following steps:
• Determine the "Period" variable, which specifies the number of bars used to calculate the average price. (Default value is 20)
• Calculate the average price over the specified period using the "sma()" (simple moving average) function.
• Calculate the percentage difference between the current price and the average price using the formula: ((close - avg_price) / avg_price) * 100 .
• Set levels to change the color of the histogram based on price deviation from the average value. "Histogram Color" is a parameter to customize the color of the histogram based on deviation levels. By default, if the deviation is more than 5%, the histogram will be red; if it is less than -5%, it will be green, and for all other deviations, it will be blue. However, this parameter can be changed to other values.
• Draw a histogram of price change relative to the average value. The "Style" parameter allows you to choose the style of the indicator (histogram). By default, the "Histogram" style is set, but you can also select "Line on Close" or "Line on Open".
Application of the Indicator
The PDI indicator is based on the assumption that the price of any asset always tends to its mean value. Using PDI on higher timeframes allows you to determine the overall market trend, whereas on smaller timeframes, situations can be found when the price is in negative territory, and the histogram starts to smoothly transition from negative to positive value. This can be a signal to buy, as the price is likely in an oversold condition and ready to change its trend. On the other hand, if the strength of the price slows down or begins to approach 0, this may indicate that the asset is overbought and starting to turn towards oversold, which is a signal to sell. A beautiful feature of the PDI indicator is its simplicity and conciseness, which allows you to quickly and easily identify a trend change and make trading decisions based on a strong signal.
Conclusion
The "Price Deviation Indicator" (PDI) can be useful in analyzing price movements in the market. It allows you to calculate the relative difference between the current price and the average price, allowing you to identify market saturation and change in trend. The indicator can be used in technical analysis to make decisions about buying or selling assets on the exchange. It can also be useful for traders of different levels of experience, as its settings can be adapted depending on the user's needs and requirements. Overall, this indicator is one of the tools that can help in analyzing price and volumes to determine possible investment prospects in assets.

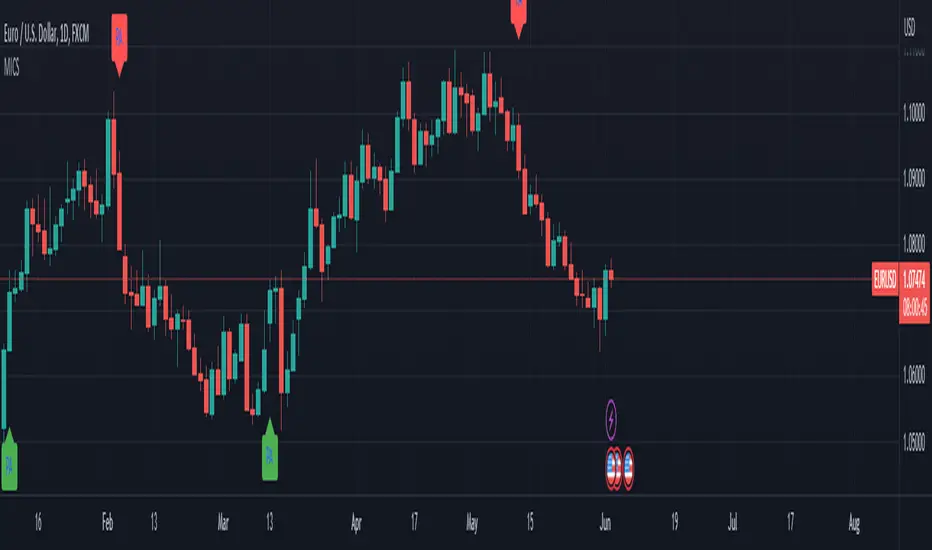
Multi-Indicator Confluence Signals (MICS) - Complete!Now with adjustable settings!
Description:
The Multi-Indicator Confluence Signals (MICS) is a comprehensive trading tool designed to simplify the process of analyzing multiple technical indicators and uncluttering your screen!
You are able to select various pre-existing indicators, including Stochastic, RSI, MACD, EMA, DMI, Bollinger Band and a our very own custom signal we created using only price action calculations which will provide a streamlined view of the market, allowing traders to focus on speed, trade execution, strategy, and chart reading.
We do this by converting the input from the above popular technical indicators and generate clear long and short signals by placing green(long) and/or red(short) arrows directly on the chart.
You have the option to choose which indicators you want to show on the screen and also the option to choose long and/or short signals and it even comes with the option to adjust the settings of each respective pre-existing indicator to your liking, even our very own price action signal!
Example of the settings you can adjust + many more.
Unclutter your screen by going from this image ...(Imagine your own drawings+the above indicators):
To this! (Only long signals displayed in the picture)
Features:
Consolidated signals:
The MICS identifies bull and bearish signals from multiple indicators and presents them in a visual arrow pointing manner, enabling traders to quickly assess potential trade opportunities.
Unique price action signals:
The price action arrows in the MICS trading tool are a unique feature that distinguish it from traditional technical indicators.
These arrows are generated solely based on recent price movement and are calculated using an algorithm that analyzes the strength of recent price action.
The algorithm also considers factors such as the length and intensity of the trend, as well as any notable support or resistance levels.
When the 'Price Action Long' or 'Price Action Short' options are enabled, the MICS will display green or red arrows respectively, indicating potential bullish or bearish signals.
These arrows complement the signals generated by other pre-existing technical indicators in the MICS .
Clutter-free charting:
By removing the need to display individual indicators on the chart, the MICS helps create a cleaner workspace, promoting better focus and decision-making.
Confluence-based trading:
The MICS is not designed to be used as a standalone trading system.
Instead, traders should utilize the signals as confluences to complement their pre-existing trade ideas, leading to more robust and well-informed strategies.
Mashup of Indicators:
Each indicator has its own strengths and weaknesses, but by combining them, the MICS can provide a more comprehensive view of the market.
For example, Stochastic and RSI are commonly used to measure overbought and oversold conditions, while MACD and EMA are used to identify trend direction. DMI, on the other hand, is used to gauge the strength of a trend, while Bollinger Bands can be used to identify potential breakouts.
By combining the signals from these indicators, the MICS can provide traders with a more nuanced view of the market, allowing them to make better-informed trading decisions, quickly!
How They Work Together:
The MICS generates signals by analyzing the input from each individual indicator.
If the indicators show a bullish trend, the MICS will display this by showing the indicators you selected in the settings with green long arrows, indicating a potential long trade.
Conversely, if the indicators show a bearish trend, the MICS will display red short arrows, indicating a potential short trade.
In addition, the MICS uses a unique price action signal generated solely based on recent price movement, calculated using an algorithm that analyzes the strength of recent price action.
This price action signal is a distinguishing feature of the MICS and complements the signals generated by the pre-existing technical indicators.
What Makes the MICS Original?
What makes the MICS unique is its emphasis on providing a clutter-free charting experience.
By displaying only clear long and short signals directly on the chart based on your own selection in the settings, the MICS eliminates the need to have multiple indicators cluttering the screen, allowing traders to concentrate on making informed decisions, quickly!
This price action signal is a also unique feature that sets the MICS apart from other technical indicators.
AI-Bank-Nifty Tech AnalysisThis code is a TradingView indicator that analyzes the Bank Nifty index of the Indian stock market. It uses various inputs to customize the indicator's appearance and analysis, such as enabling analysis based on the chart's timeframe, detecting bullish and bearish engulfing candles, and setting the table position and style.
The code imports an external script called BankNifty_CSM, which likely contains functions that calculate technical indicators such as the RSI, MACD, VWAP, and more. The code then defines several table cell colors and other styling parameters.
Next, the code defines a table to display the technical analysis of eight bank stocks in the Bank Nifty index. It then defines a function called get_BankComponent_Details that takes a stock symbol as input, requests the stock's OHLCV data, and calculates several technical indicators using the imported CSM_BankNifty functions.
The code also defines two functions called get_EngulfingBullish_Detection and get_EngulfingBearish_Detection to detect bullish and bearish engulfing candles.
Finally, the code calculates the technical analysis for each bank stock using the get_BankComponent_Details function and displays the results in the table. If the engulfing input is enabled, the code also checks for bullish and bearish engulfing candles and displays buy/sell signals accordingly.
The FRAMA stands for "Fractal Adaptive Moving Average," which is a type of moving average that adjusts its smoothing factor based on the fractal dimension of the price data. The fractal dimension reflects self-similarity at different scales. The FRAMA uses this property to adapt to the scale of price movements, capturing short-term and long-term trends while minimizing lag. The FRAMA was developed by John F. Ehlers and is commonly used by traders and analysts in technical analysis to identify trends and generate buy and sell signals. I tried to create this indicator in Pine.
In this context, "RS" stands for "Relative Strength," which is a technical indicator that compares the performance of a particular stock or market sector against a benchmark index.
The "Alligator" is a technical analysis tool that consists of three smoothed moving averages. Introduced by Bill Williams in his book "Trading Chaos," the three lines are called the Jaw, Teeth, and Lips of the Alligator. The Alligator indicator helps traders identify the trend direction and its strength, as well as potential entry and exit points. When the three lines are intertwined or close to each other, it indicates a range-bound market, while a divergence between them indicates a trending market. The position of the price in relation to the Alligator lines can also provide signals, such as a buy signal when the price crosses above the Alligator lines and a sell signal when the price crosses below them.
In addition to these, we have several other commonly used technical indicators, such as MACD, RSI, MFI (Money Flow Index), VWAP, EMA, and Supertrend. I used all the built-in functions for these indicators from TradingView. Thanks to the developer of this TradingView Indicator.
I also created a BankNifty Components Table and checked it on the dashboard.

TASC 2023.03 Every Little Bit Helps█ OVERVIEW
TASC's February 2023 edition of Traders' Tips includes an article titled "Every Little Bit Helps: Averaging The Open And Close To Reduce Noise" by John Ehlers. This code implements the numerical example from this article.
█ CONCEPTS
Using theories from digital signal processing as a starting point, John Ehlers argues that using the average of the open and close as the source time series of an indicator instead of using only the closing price can often lead to noise reduction in the output. This effect especially applies when there is no gap between the current bar's opening and the previous bar's closing prices. This trick can reduce noise in many common indicators such as the RSI, MACD, and Stochastic.
█ CALCULATIONS
Following the example presented in the original publication, this script illustrates the proposed strategy using the Relative Strength Index (RSI) as a test indicator. It plots two series:
RSI calculated using only closing prices as its source.
RSI of the same length as the first, but calculated using the average of open and close prices as its source, i.e. (open+close)/2 .
This script demonstrates that using the average of open and close as the calculation source results in a smoother indicator. To visually emphasize the advantage of this proposed trick, the script's color scheme is sensitive to both the RSI value and the difference between the two RSI data streams.
Pivot TrendLine with Divergence█ OVERVIEW
Automatically draws divergence trends on your charts.
█ CONCEPTS
Key features
• The script would find all pivot points using built-in functions.
• Then it would calculate the RSI/MACD level at those pivot bars.
• At last we're using RSI/MACD divergence as a filter to plot marks on your chart.
█ NOTICE
This script would REPAINT based on the pivot length settings. Indicators are just simple tools to demonstrate price trends, they can not predict trends.
Please keep that in mind.
Use at your own risk.
═════════════════════════════════════════════════════════════════════════
Feel free to leave comments below, this is still an experimental script.

Price Strength Index [FT]The original oscillator indicators such as MACD, RSI and Stochastic are all range-bound, it is always between 0 and 100. That makes it a useful indicator of overbought and oversold conditions. However, it is less reliable when a price is on a strong bullish/bearish trend as it may move higher/lower than the suppose range bound. When price is on a strong trend, the indicator is possibly near to max out at overbought/oversold level and it is unable to show if that momentum is still going because the indicator is tapped at 100 (overbought) or 0 (oversold).
What it does:
This indicator is based on those original oscillators and removing the range bound to give it a much accurate take of price movement. The way to use this indicator is similar to how you would use other similar oscillator (ie. RSI, MACD, Stochastic), to have a view of bullish/bearish momentum. Divergence that appear on the indicator would be shown as an important reversal signal. For example, when price shows a bearish trend that reaches a new/equal Low, the indicator presents a higher/equal Low, it may be a sign that bears are exhausted and a reversal is brewing.
There is also the option to include Volume as weight to the calculation. This may give a much clearer view of a price movement with the context of Volume. It is highly recommended to use a much lower P Length (recommend: 5), so that the indicator would calculate for less smoothing and make it easier to spot for peak/trough.
The Zero line can be used to separate between bullish/bearish area. When indicator is above it, this shows strength on bullish side and when it is below Zero, it means that price would appear more bearish. It could also be use as a mean of normal/value. When the indicator is on the extreme peak/trough, it is likely to make a reversal. Like how a rubber band would return to normal after you have stretch it too far.
Why is this indicator useful ?
It is best used to analyse for bullish/bearish momentum.
When divergence appear indicating bullish/bearish momentum is exhausted, and looking to reverse.
When price action is currently on a minor pullback and the indicator is now showing that it is making a higher Low(going Long) or lower High(going Short), indicating a possible continuation of a trend.
When indicator is on extreme peak/trough, to look for a potential reversal.
DISCLAIMER: Nothing in this content should be interpreted as financial advice or a recommendation to buy or sell any sort of security, investment, currencies or assets.

TradeChartist Ichimoku Trader ™TradeChartist Ichimoku Trader is an elegant and functional breakouts trading indicator that generates trade signals based on two types of breakouts - True Ichimoku Kumo Breakouts and Ichimoku Trade Bands Breakouts, which can be further filtered using ™TradeChartist MA Visualizer and/or using an external Filter.
===================================================================================================================
╔════════ 𝗖𝗹𝗼𝘂𝗱 𝗦𝗲𝘁𝘁𝗶𝗻𝗴𝘀 ═════════╗
Cloud Settings form the fundamental factor for this indicator to detect the breakouts. The settings for the Ichimoku Cloud is Automatic by default, but this can be changed based on the user preference from the settings under 𝐂𝐥𝐨𝐮𝐝 𝐓𝐲𝐩𝐞, which also includes a manual input option. Ichimoku traders can experiment different settings combinations under manual settings to suit their trading frequency and timeframe traded.
Ichimoku Cloud with its components can be displayed or hidden by enabling/disabling 𝐃𝐢𝐬𝐩𝐥𝐚𝐲 𝐈𝐜𝐡𝐢𝐦𝐨𝐤𝐮 𝐂𝐥𝐨𝐮𝐝. Also, Sʜᴏᴡ Iᴄʜɪᴍᴏᴋᴜ Cʀᴏssᴇs from the Cloud Settings plots tiny crosses on chart.
===================================================================================================================
╔═════════ 𝗕𝗮𝗻𝗱𝘀 𝗦𝗲𝘁𝘁𝗶𝗻𝗴𝘀 ════════╗
Even though the Ichimoku Trade Bands are derived from the Cloud Parameters, the Bᴀɴᴅ Wɪᴅᴛʜ (0.236 - 1) and Lᴏᴏᴋʙᴀᴄᴋ (5 - 200) influences the sensitivity and the width of the bands, which has an effect on the risk and reward expected from Ichimoku Trade Bands Breakout trade.
Trade Bands can be displayed or hidden by enabling/disabling 𝐃𝐢𝐬𝐩𝐥𝐚𝐲 𝐈𝐜𝐡𝐢𝐦𝐨𝐤𝐮 𝐓𝐫𝐚𝐝𝐞 𝐁𝐚𝐧𝐝𝐬. Also, the Bands mean line can be enabled or disabled using 𝐃𝐢𝐬𝐩𝐥𝐚𝐲 𝐓𝐫𝐚𝐝𝐞 𝐁𝐚𝐧𝐝𝐬 𝐌𝐞𝐚𝐧 𝐋𝐢𝐧𝐞 check box and its line width can be changed using Tʀᴀᴅᴇ Bᴀɴᴅs Mᴇᴀɴ Lɪɴᴇ Wɪᴅᴛʜ dropdown.
===================================================================================================================
╔═════════ 𝗠𝗔 𝗩𝗶𝘀𝘂𝗮𝗹𝗶𝘇𝗲𝗿 ═════════╗
MA Visualizer is a powerful and very useful original ™TradeChartist visual method to plot Moving Averages of the close price of the security for user specified look back period in a visually appealing style in the form of colour coded bands. MA Visualizer not only helps the trader spot the price action of the security relative to the moving average, but also paints a visual picture of the trend strength, which must be seen and used on chart to appreciate its elegance. One of 15 different types of Moving Averages can be used to visualize the price action.
Activate 𝗠𝗔 𝗩𝗶𝘀𝘂𝗮𝗹𝗶𝘇𝗲𝗿 and choose the MA type from MA Vɪsᴜᴀʟɪᴢᴇʀ Tʏᴘᴇ dropdown and entering the lookback period in MA Vɪsᴜᴀʟɪᴢᴇʀ ᴘᴇʀɪᴏᴅ input box. MA Visualizer colour theme can be be changed from MA Vɪsᴜᴀʟɪᴢᴇʀ Cᴏʟᴏʀ Sᴄʜᴇᴍᴇ dropdown.
The faster of the two set of bands that form the MA Visualizer reacts to price action faster and can be clearly seen from its change of colour from Bull Colour to Bear Colour or viceversa earlier than the slower set of bands. The fill colour between the bands also helps the user stay in a trade or exit a trade based on other confirmators.
===================================================================================================================
╔═══════ 𝗦𝗶𝗴𝗻𝗮𝗹𝘀 𝗮𝗻𝗱 𝗙𝗶𝗹𝘁𝗲𝗿𝘀 ═══════╗
Signal Type
True Ichimoku Kumo Breakout
Ichimoku traders mostly use the Kumo breakouts for trading based on several Bullish and Bearish conditions. For the sake of effective trade entries, trade entry plots for specific cloud events like Kumo twists, Tenkan Sen crossing Kijun Sen, price crossing cloud components etc have been intentionally ignored as Ichimoku traders often tend to visually trade them effectively.
Ichimoku Trade Bands Breakout
In addition to the True Kumo Breakouts, users of this script will be able to trade Ichimoku Trade Bands Breakouts. Ichimoku Trade Bands is an original ™TradeChartist model designed to detect early trend changes based on the Ichimoku settings. These bands are comprised of three plots - an upper band, a lower band and a mean line, namely and all are derived from the Ichimoku settings. The bands act as a filter and a breakout from bands' extreme boundaries signals a change in trend. The settings of the bands can be derived automatically or using manual input based on Ichimoku Cloud parameters, accessed from the indicator settings.
The Breakout Trade Entries can be further filtered by use of MA Visualizer or by using an external filter connected to the script.
===================================================================================================================
╔═════════ 𝗙𝗶𝗹𝘁𝗲𝗿 𝗦𝗲𝘁𝘁𝗶𝗻𝗴𝘀 ═════════╗
Filters are normally used to reduce noise in the Trade Entry Signals and they can be quite effective in helping the trader stay in trade and to minimize unproductive trade entries. Ichimoku Trader enables the user to use upto two trade filters - MA Visualizer and /or External Filter respectively.
Moving Averages are very effective trade filters and if the right Moving Average is used with right lookback period based on trade type and timeframe traded, they can be very effective in filtering trades.
Enabling 𝐔𝐬𝐞 𝐌𝐀 𝐕𝐢𝐬𝐮𝐚𝐥𝐢𝐳𝐞𝐫 𝐚𝐬 𝐓𝐫𝐚𝐝𝐞 𝐅𝐢𝐥𝐭𝐞𝐫 filters breakouts only when MA Visualizer agrees with the trend (which can be visualized using the fill colour between the MA Visualizer plots.
Enabling Fɪʟᴛᴇʀ Eᴀʀʟʏ Vɪsᴜᴀʟɪᴢᴇʀ Bʀᴇᴀᴋᴏᴜᴛs in addition filters breakouts even if price closed above the upper MA Visualizer plot without having to agree with fill colour.
In addition to MA Visualizer Filter, and external filter like RSI, MACD etc. can also be used by connecting to Ichimoku Trader under ╔═══ 𝗣𝗹𝘂𝗴 𝗙𝗶𝗹𝘁𝗲𝗿 𝗵𝗲𝗿𝗲 ═══ 🔌 dropdown by enabling 𝐔𝐬𝐞 𝐄𝐱𝐭𝐞𝐫𝐧𝐚𝐥 𝐅𝐢𝐥𝐭𝐞𝐫 𝐚𝐬 𝐓𝐫𝐚𝐝𝐞 𝐅𝐢𝐥𝐭𝐞𝐫. The external filter can be used as the only filter or in addition to MA Visualizer filter.
To get the external filter to work, Sɪɢɴᴀʟ Tʏᴘᴇ must be set right. For plots that are not oscillatory like Moving Averages, Super Trend etc., choose type as Non Oscillatory and for Oscillators like RSI, CCI, MACD etc., choose type as Oscillatory .
For Oscillators, levels must be specified for Fɪʟᴛᴇʀ Lᴇᴠᴇʟ ғᴏʀ ʟᴏɴɢs and Fɪʟᴛᴇʀ Lᴇᴠᴇʟ ғᴏʀ sʜᴏʀᴛs , especially if the Oscillator doesnt have 0 as mid line, like RSI. Even for 0 mid oscillators like CCI, filter levels like 100/-100 work effectively to filter noise.
Use 𝐓𝐫𝐚𝐝𝐞 𝐙𝐨𝐧𝐞𝐬 𝐁𝐚𝐜𝐤𝐠𝐫𝐨𝐮𝐧𝐝 𝐅𝐢𝐥𝐥 under 𝗨𝘀𝗲𝗳𝘂𝗹 𝗘𝘅𝘁𝗿𝗮𝘀 to paint the trade zones background. It helps visually see the effect of filters on the breakout entries and also the trade performance.
===================================================================================================================
╔═════════ 𝗨𝘀𝗲𝗳𝘂𝗹 𝗘𝘅𝘁𝗿𝗮𝘀 ═════════╗
Ichimoku Trader also includes the following useful extras
𝐓𝐫𝐚𝐝𝐞 𝐙𝐨𝐧𝐞𝐬 𝐁𝐚𝐜𝐤𝐠𝐫𝐨𝐮𝐧𝐝 𝐅𝐢𝐥𝐥 paints the trade zones in green and red as mentioned above.
Sʜᴏᴡ Hɪɢʜs ᴀɴᴅ Lᴏᴡs plots the highest highs of the Bull Zone and the lowest lows of the Bear Zone to help spot the wicks, support and resistance.
Tᴀᴋᴇ Pʀᴏғɪᴛ Bᴀʀs helps detect the volatility exhaustion prices and plots $ signs to help the trader take profits or move stop loss levels to secure gains or to reduce losses.
Vɪsᴜᴀʟɪᴢᴇʀ Cᴏʟᴏʀ Bᴀʀs paints the price bars with trend intensity and the user can opt from one of two themes under Bᴀʀ Cᴏʟᴏʀ Sᴄʜᴇᴍᴇ (Chilli and Flame).
The bar colors can be inverted by enabling Iɴᴠᴇʀᴛ Bᴀʀ Cᴏʟᴏʀs to see reverse bias with respect to the current trade direction.
===================================================================================================================
╔═════════ 𝗔𝗹𝗲𝗿𝘁𝘀 ═════════╗
Alerts can be created for Long and Short entries by using Once Per Bar Close as Alert Frequency. Entries are generated on Real time bars based on Breakout and filter conditions. It is recommended to wait for bar close before taking a position based on Ichimoku Trader Trade Entries.
The indicator does not repaint and can be confidently used for alerts and trade entries without worrying about signals disappearing.
™TradeChartist Ichimoku Trader 𝗧𝗿𝗲𝗻𝗱 𝗜𝗱𝗲𝗻𝘁𝗶𝗳𝗶𝗲𝗿 can also be connected to ™TradeChartist Plug and Trade to generate entries along with Targets, Stop Loss plots etc. Target and Stop Loss alerts can be created using Plug and Trade's Alerts system.
===================================================================================================================
There are several combinations of settings that can be tested on the security traded based on timeframe and risk/reward expectations. The indicator can be used for trade entries with filter combinations or can be used as standalone Visualizer for trend confirmations, levels etc. Following are a few examples using the Visualizer.
╔════════ 𝗘𝘅𝗮𝗺𝗽𝗹𝗲 𝗖𝗵𝗮𝗿𝘁𝘀 ════════╗
1. BTC-USDT 1hr True Ichimoku Kumo Breakout with no filters.
2. BTC-USDT 1hr Ichimoku Trade Bands (Default) Breakout with no filters.
3. BTC-USDT 1hr Ichimoku Trade Bands (Default) Breakout using 200 period Hull MA Visualizer filter.
4. AAPL 4hr Ichimoku Trade Bands (Default) Breakout using 200 period VIDYA MA Visualizer filter. Note: VIDYA is normally used for long term trades.
5. GBP-USD 5m True Ichimoku Kumo Breakout using 144 period TEMA MA Visualizer filter and Money Flow Index connected as external filter with 80/20 Filter values.
6. XAU-USD 1hr Ichimoku Trade Bands (Default) Breakout using 144 period TEMA MA Visualizer and Keltner Channels basis line as external non-oscillatory filter, connected to ™TradeChartist Plug and Trade using Ichimoku Trader 𝗧𝗿𝗲𝗻𝗱 𝗜𝗱𝗲𝗻𝘁𝗶𝗳𝗶𝗲𝗿.
7. SHITPERP 1hr Ichimoku Trade Bands (0.618 Band Width and Lookback 89 periods) using 50 period Zero-Lag EMA Visualizer Filter.
===================================================================================================================
Best Practice: Test with different settings first using Paper Trades before trading with real money
===================================================================================================================
This is not a free to use indicator. Get in touch with me (PM me directly if you would like trial access to test the indicator)
Premium Scripts - Trial access and Information
Trial access offered on all Premium scripts.
PM me directly to request trial access to the scripts or for more information.
===================================================================================================================
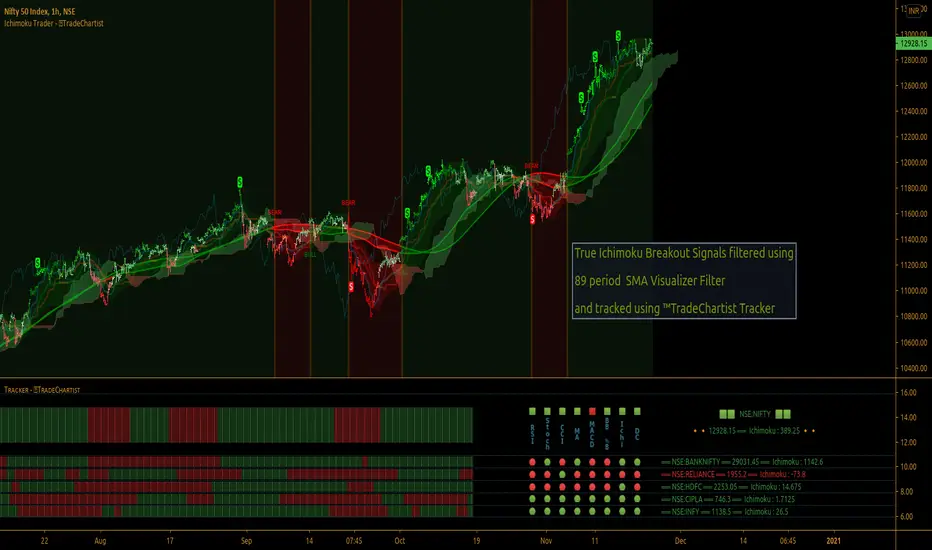
[astropark] MACD, RSI, StochRSI, CCIHi Followers,
here it is a new script, which unifies many very useful oscillator just in one: RSI + MACD + Stochastic RSI + CCI
This is not a public indicator, so send me a private message in order to get access to this script.
Do you like my scripts? Offer me a coffee , a beer, a pizza or whatever :)
BTC jar: 1K5kuYQPEqoNo6GRmJbHWMPmqwKM5S3oRR
ETH jar: 0x091b541a6dd6fe08c4e7bd909baafb2fce9b975e
LTC jar: LSVoAChsZrVsvbNyUfdpxtFpDAUSaUTUig
XRP jar: (XRP deposit tag) 103997763 (XRP deposit address) rEb8TK3gBgk5auZkwc6sHnwrGVJH8DuaLh
PS: Do you need a customization or do you need a dev who implements your strategy? send me a private message ;-)
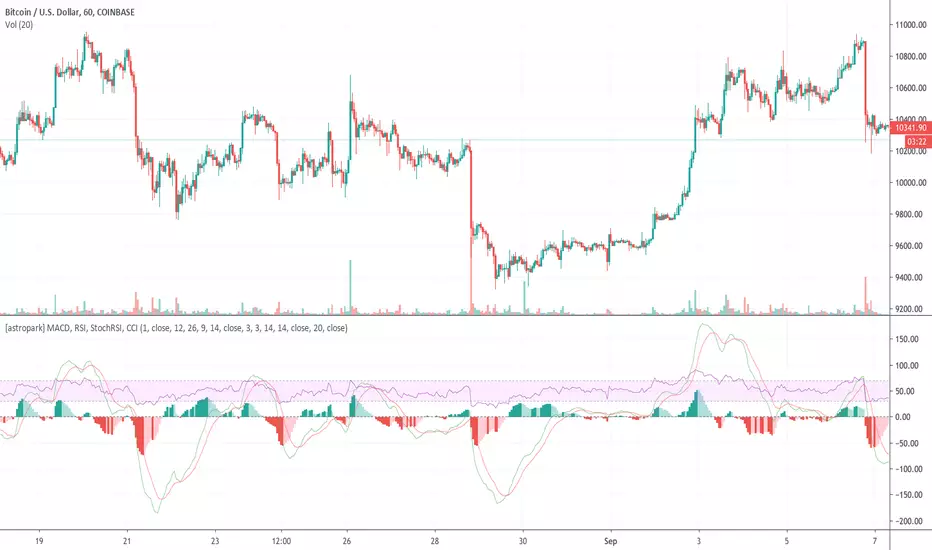
Super Exit indicators [대탈출지표]I use RVI, RSI, MACD, AROON to decide where to exit.
Check it out which one is right to you
RVI : relative vigor index
- exit signal when crossunder
RSI
- You can choose the trigger value, default is 70
- You can also choose the trigger option, crossover or crossunder
MACD
- Exit signal is generated when crossunder
Aroon
- Exit signal is generated when Up is under 50 and Down is over 50
PpSignal RSI MACD Adaptive Trima MA Just a simple MACD (Moving Aveage Convergence Divergence) indicator made of RSI, calc with TRIMA Moving Average, but this time with adaptive period for the moving averages.
As usual, you can play with settings to find your best parameters to your own trading style.
Converted from a MQL4 version to prorealtime, by a request in the Spanish forum.

