Reversal + Confirm ZonesThis script is written in Pine Script (version 5) for TradingView and creates an indicator called **"Reversal + Confirm Zones"**. It overlays visual zones on a price chart to identify potential reversal points and confirmation signals for trading. The indicator combines **Bollinger Bands** and **RSI** to detect overbought/oversold conditions (reversal zones) and uses **EMA crosses** and **MACD zero-line crosses** to confirm bullish or bearish trends. Below is a detailed explanation:
---
### **1. Purpose**
- The script highlights:
- **Reversal Zones**: Areas where the price might reverse due to being overbought (green) or oversold (red).
- **Confirmation Zones**: Areas where a trend reversal is confirmed using EMA and MACD signals (green for bullish, red for bearish).
- It provides visual backgrounds and alerts to assist traders in spotting potential trade setups.
---
### **2. Components**
The script is divided into two main parts: **Reversal Logic** and **Confirmation Logic**.
---
### **3. Reversal Logic (Red & Green Zones)**
#### **Bollinger Bands**
- **Parameters**:
- Length: 20 periods.
- Source: Closing price (`close`).
- Multiplier: 2.0 (standard deviations).
- **Calculation**:
- `basis`: 20-period Simple Moving Average (SMA).
- `dev`: 2 times the standard deviation of the price over 20 periods.
- `upper`: `basis + dev` (upper band).
- `lower`: `basis - dev` (lower band).
- **Purpose**: Identifies when the price moves outside the normal range (beyond 2 standard deviations).
#### **Relative Strength Index (RSI)**
- **Parameters**:
- Length: 14 periods.
- Low Threshold: 30 (oversold).
- High Threshold: 70 (overbought).
- **Calculation**: `rsiValue = ta.rsi(close, rsiLength)`.
- **Purpose**: Measures momentum to confirm overbought or oversold conditions.
#### **Zone Conditions**
- **Red Zone (Oversold)**:
- Condition: `close < lower` (price below lower Bollinger Band) AND `rsiValue < rsiLowThreshold` (RSI < 30).
- Visual: Light red background (`color.new(color.red, 80)`).
- Alert: "Deep Oversold Signal triggered!".
- **Green Zone (Overbought)**:
- Condition: `close > upper` (price above upper Bollinger Band) AND `rsiValue > rsiHighThreshold` (RSI > 70).
- Visual: Light green background (`color.new(color.green, 80)`).
- Alert: "Deep Overbought Signal triggered!".
#### **Interpretation**
- Red Zone: Suggests the price is oversold and may reverse upward.
- Green Zone: Suggests the price is overbought and may reverse downward.
---
### **4. Confirmation Logic (EMA and MACD Crosses)**
#### **Exponential Moving Averages (EMAs)**
- **Parameters**:
- Short EMA Length: 9 periods (user adjustable).
- Long EMA Length: 21 periods (user adjustable).
- **Calculation**:
- `emaShort = ta.ema(close, emaShortLength)`.
- `emaLong = ta.ema(close, emaLongLength)`.
- **Conditions**:
- **Bullish EMA Cross**: `emaCrossBullish = ta.crossover(emaShort, emaLong)` (9 EMA crosses above 21 EMA).
- **Bearish EMA Cross**: `emaCrossBearish = ta.crossunder(emaShort, emaLong)` (9 EMA crosses below 21 EMA).
#### **MACD**
- **Parameters**:
- Fast Length: 12 periods (user adjustable).
- Slow Length: 26 periods (user adjustable).
- Signal Smoothing: 9 periods (user adjustable).
- **Calculation**:
- ` = ta.macd(close, macdFastLength, macdSlowLength, macdSignalSmoothing)`.
- Only the MACD line and signal line are used; the histogram is ignored (`_`).
- **Conditions**:
- **Bullish MACD Cross**: `macdCrossBullish = ta.crossover(macdLine, 0)` (MACD crosses above zero).
- **Bearish MACD Cross**: `macdCrossBearish = ta.crossunder(macdLine, 0)` (MACD crosses below zero).
#### **Combined Confirmation Conditions**
- **Bullish Confirmation**:
- Condition: `bullishConfirmation = emaCrossBullish and macdCrossBullish`.
- Visual: Very light green background (`color.new(color.green, 90)`).
- Meaning: A bullish trend is confirmed when the 9 EMA crosses above the 21 EMA AND the MACD crosses above zero.
- **Bearish Confirmation**:
- Condition: `bearishConfirmation = emaCrossBearish and macdCrossBearish`.
- Visual: Very light red background (`color.new(color.red, 90)`).
- Meaning: A bearish trend is confirmed when the 9 EMA crosses below the 21 EMA AND the MACD crosses below zero.
---
### **5. Visual Outputs**
- **Reversal Zones**:
- Red background for oversold conditions.
- Green background for overbought conditions.
- **Confirmation Zones**:
- Light green background for bullish confirmation.
- Light red background for bearish confirmation.
- Note: The script does not plot the Bollinger Bands, EMAs, or MACD lines—only the background zones are visualized.
---
### **6. Alerts**
- **Deep Oversold Alert**: Triggers when the red zone condition is met.
- **Deep Overbought Alert**: Triggers when the green zone condition is met.
- No alerts are set for the confirmation zones (EMA/MACD crosses).
---
### **7. How It Works**
1. **Reversal Detection**:
- The script uses Bollinger Bands and RSI to flag extreme price levels (red for oversold, green for overbought).
- These zones suggest potential reversals but are not confirmed yet.
2. **Trend Confirmation**:
- EMA crosses (9/21) and MACD zero-line crosses provide confirmation of a trend direction.
- Bullish confirmation (green) occurs when both indicators align upward.
- Bearish confirmation (red) occurs when both indicators align downward.
3. **Trading Strategy**:
- Look for a red zone (oversold) followed by a bullish confirmation for a potential long entry.
- Look for a green zone (overbought) followed by a bearish confirmation for a potential short entry.
---
### **8. How to Use**
1. Add the script to TradingView.
2. Adjust inputs (EMA lengths, MACD settings) if desired.
3. Monitor the chart:
- Red zones indicate oversold conditions—watch for a potential upward reversal.
- Green zones indicate overbought conditions—watch for a potential downward reversal.
- Light green/red backgrounds confirm the trend direction after a reversal zone.
4. Set up alerts for oversold/overbought conditions to catch reversal signals early.
---
### **9. Key Features**
- **Dual Purpose**: Combines reversal detection (Bollinger Bands + RSI) with trend confirmation (EMA + MACD).
- **Visual Simplicity**: Uses background colors instead of plotting lines, keeping the chart clean.
- **Customizable**: Allows users to tweak EMA and MACD periods.
- **Alerts**: Notifies users of extreme conditions for timely action.
---
### **10. Limitations**
- No plotted indicators (e.g., Bollinger Bands, EMAs, MACD) for visual reference—relies entirely on background shading.
- Confirmation signals (EMA/MACD) may lag behind reversal zones, potentially missing fast reversals.
- No alerts for confirmation zones, limiting real-time notification of trend confirmation.
This script is ideal for traders who want a straightforward way to spot potential reversals and confirm them with trend-following indicators, all overlaid on the price chart.
חפש סקריפטים עבור "Relative Strength Index (RSI)"

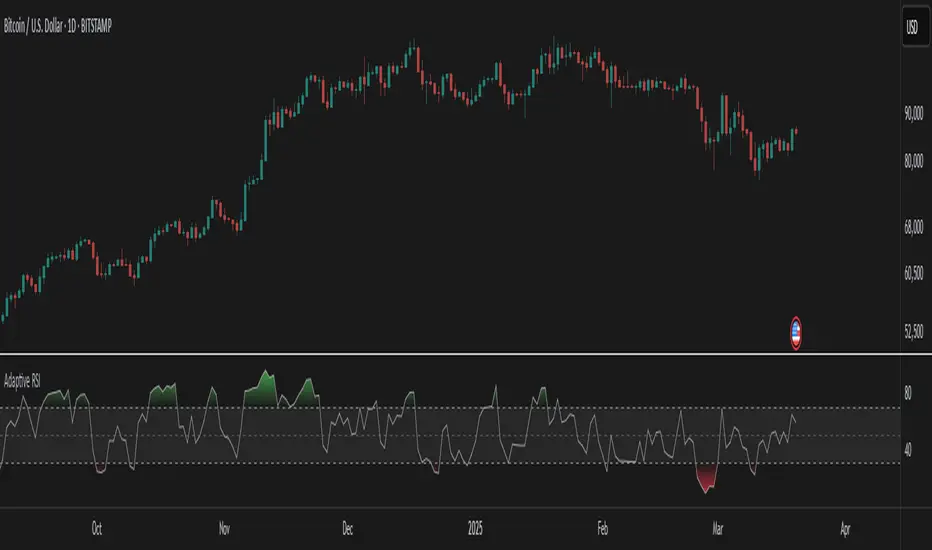
Ehlers Adaptive RSIThe Ehlers Adaptive RSI improves on the traditional RSI by dynamically adjusting its period based on market conditions.
Problem with the Classic RSI:
The traditional Relative Strength Index (RSI) uses a fixed period (e.g., 14), making it slow to react in volatile markets and too sensitive in stable conditions.
How the Adaptive RSI Solves This:
Instead of a fixed period, this version automatically adapts based on market volatility using a combination of ATR (Average True Range) and EMA (Exponential Moving Average).
Key Benefits:
More Responsive – Quickly adapts to market shifts, reducing lag.
Less Noise – Filters out unnecessary fluctuations in stable trends.
Self-Adjusting – No need to manually change RSI settings for different market conditions.
Better Signal Accuracy – Helps detect real trend reversals without false alarms.
This script is for informational and educational purposes only. It does not constitute financial advice, and past performance does not guarantee future results. Use it at your own risk.
MACD Sniper [trade_lexx]📈 MACD Sniper — Improve your trading strategy with accurate signals!
Introducing the MACD Sniper , an advanced trading indicator designed for a comprehensive analysis of market conditions. This indicator combines MACD (Moving Average Convergence Divergence) with various types of moving averages (SMA, EMA, WMA, VWMA, KAMA, HMA, ZLEMA, TEMA, ALMA, DEMA), providing traders with a powerful tool for generating buy and sell signals. It is ideal for traders who need an advantage in detecting changes in trends and market conditions.
🔍 How the signals work
1. Histogram signals:
— A buy signal is generated when the MACD histogram is below zero and begins to grow after the minimum number of falling histogram columns, which are indicated in the indicator menu. This indicates that selling pressure has decreased, the market is oversold and ready for a rebound. The signals are displayed as green triangles labeled "H" under the histogram graph. On the main chart, buy signals are displayed as green triangles labeled "Buy" under candlesticks.
— A sell signal is generated when the MACD histogram is above zero and begins to fall after the minimum number of growing histogram columns, which are indicated in the indicator menu. This indicates that the buying pressure has decreased, the market is overbought and ready for correction. The signals are displayed as red triangles labeled "H" above the histogram graph. On the main chart, the sell signals are displayed as red triangles with the word "Sell" above the candlesticks.
2. Moving Average Crossing Signals (MA):
— A buy signal is generated when the Fast Moving Average (MACD) crosses the Slow Moving Average (Signal Line) from bottom to top. This indicates a possible upward reversal of the market. The signals are displayed as green triangles labeled "MA" under the MACD chart. On the main chart, buy signals are displayed as green triangles labeled "Buy" under candlesticks.
— A sell signal is generated when the Fast Moving Average (MACD) crosses the slow Moving Average (Signal Line) from top to bottom. This indicates a possible downward reversal of the market. The signals are displayed as red triangles labeled "MA" above the MACD chart. On the main chart, the sell signals are displayed as red triangles with the word "Sell" above the candlesticks.
🔧 Signal filtering
— Minimum number of bars between signals
This filter allows the user to set the minimum number of bars that must pass between the generation of two consecutive signals. This helps to avoid frequent false alarms and improves the quality of the generated signals. Setting this parameter allows you to filter out the noise in the market and make the signals more reliable. For example, if the value is set to 5, then a new signal will be generated only after 5 bars have passed since the previous signal.
— "Wait for the opposite signal" mode
In this mode, Buy and Sell signals are generated only after receiving the opposite signal. This means that a buy signal will be generated only after the previous sell signal, and vice versa. This approach adds an additional level of filtering and helps to avoid false positives. This is especially useful in conditions of high market volatility, when false signals often occur.
— RSI filter
The Relative Strength Index (RSI) is used for additional filtering of buy and sell signals. The RSI helps determine whether a market is overbought or oversold. The user can set overbought and oversold levels, and signals will be generated only when the RSI is in the specified ranges. For example, a buy signal will be generated only if the RSI is in the range between 10 and 30 (oversold), and a sell signal if the RSI is in the range between 70 and 90 (overbought). This helps to avoid false signals in extreme market conditions.
🔌 Connector Histogram, MA, Combined 🔌
These parameters allow you to connect the indicator to trading strategies and test the signals throughout the trading history. This makes the indicator an even more powerful tool for traders who want to test the effectiveness of their strategies on historical data.
Connector Histogram provides the ability to connect signals based on the MACD histogram to trading strategies.
Connector MA allows you to connect signals based on the intersection of moving averages (MA) of the MACD, which can also be used for automatic trading or strategy testing.
The combined connector combines signals based on both a histogram and the intersection of moving averages, making the analysis more comprehensive and reliable, which is especially useful for traders seeking to improve the quality of their trading decisions.
🔔 Alerts
The indicator provides the ability to set up notifications for buy and sell signals, which allows traders to keep abreast of important market events without having to constantly monitor the chart. Users can set up notifications that will alert them when buy or sell signals appear, helping them respond to market changes in a timely manner and make informed decisions. These notifications can be configured for various types of signals, such as signals based on the MACD histogram, moving average crossings, or all at once, which makes the indicator a more convenient and functional tool for active traders.
🎨 Customizable Appearance
Customize the appearance of the MACD Sniper according to your preferences to make the analysis more convenient and visually pleasing. In the indicator settings section, you can change the colors of the buy and sell signals so that they stand out on the chart and are easily visible. For example, buy signals can be green, and sell signals can be red. These settings allow traders to adapt the indicator to their individual needs, making it more flexible and user-friendly.
🔧 How it works
The MACD Sniper indicator starts by calculating the MACD values and moving averages for a specific period in order to assess market conditions. For this, fast and slow moving averages are used, as well as a signal line, which are calculated based on the set parameters. The indicator then analyzes the MACD histogram to determine whether the difference between the fast and slow moving averages is rising or falling. Based on this analysis, buy and sell signals are generated. Additionally, the indicator uses the RSI filter to filter out false signals in overbought or oversold market conditions. The user can set the minimum number of bars between the signals and the "Wait for the opposite signal" mode for additional filtering. The indicator dynamically adjusts to changes in the market, providing relevant signals in real time.
📚 Quick guide to using the MACD Sniper
— Add the indicator to your favorites by clicking on the rocket icon. Adjust the parameters such as the length of periods for fast and slow moving averages, the type of moving average (SMA, EMA, WMA, VWMA, KAMA, HMA, ZLEMA, TEMA, ALMA, DEMA) and the length of the signal line, according to your trading style, or leave all settings as default.
— Adjust the signal filters to improve their quality and avoid false alarms
— Turn on notifications so that you don't miss important trading opportunities and don't constantly sit at the chart. This will allow you to keep abreast of all key market events and respond to them in a timely manner, without being distracted from other business.
— Use signals, they will help you determine the optimal entry and exit points of positions.
— Use the Connector for deeper analysis and verification of the effectiveness of signals, connect them to your trading strategies. This will allow you to test signals throughout your trading history and evaluate their accuracy based on historical data.
— Include the indicator in your trading strategy and run testing to see how buy and sell signals have worked in the past.
— Analyze the test results to determine how reliable the signals are and how they can improve your trading strategy. This will help you make more informed decisions and increase your trading efficiency.

Crypto Fear & Greed Score [Underblock]Crypto Fear & Greed Score - Methodology & Functioning
Introduction
The Crypto Fear & Greed Score is a comprehensive indicator designed to assess market sentiment by detecting extreme conditions of panic (fear) and euphoria (greed). By combining multiple technical factors, it helps traders identify potential buying and selling opportunities based on the emotional state of the market.
This indicator is highly customizable, allowing users to adjust weight parameters for RSI, volatility, Bitcoin dominance, and trading volume, making it adaptable to different market conditions.
Key Components
The indicator consists of two primary sub-scores:
Fear Score (Panic) - Measures the intensity of fear in the market.
Greed Score (Euphoria) - Measures the level of overconfidence and excessive optimism.
The difference between these two values results in the Net Score, which indicates the dominant market sentiment at any given time.
1. Relative Strength Index (RSI)
The indicator utilizes multiple RSI timeframes to measure momentum and overbought/oversold conditions:
RSI 1D (Daily) - Captures medium-term sentiment shifts.
RSI 4H (4-hour) - Identifies short-term market movements.
RSI 1W (Weekly) - Helps detect long-term overbought/oversold conditions.
2. Volatility Analysis
High volatility is often associated with fear and panic-driven selling.
Low volatility in bullish markets may indicate complacency and overconfidence.
3. Bitcoin Dominance (BTC.D)
Bitcoin dominance provides insights into capital flow between Bitcoin and altcoins:
Rising BTC dominance suggests fear as investors move into BTC for safety.
Declining BTC dominance indicates increased risk appetite and potential market euphoria.
4. Buying and Selling Volume
The indicator analyzes both buying and selling volume, ensuring a clearer confirmation of market sentiment.
High buying volume in uptrends reinforces bullish momentum.
Spikes in selling volume indicate panic and possible market bottoms.
Calculation Methodology
The indicator allows users to adjust weight parameters for each component, making it adaptable to different trading strategies. The formulas are structured as follows:
Fear Score (Panic Calculation)
Fear Score = (1 - RSI_1D) * W_RSI1D + (1 - RSI_4H) * W_RSI4H + (1 - Dominance) * W_Dominance + Volatility * W_Volatility + Sell Volume * W_SellVolume
Greed Score (Euphoria Calculation)
Greed Score = RSI_1D * W_RSI1D + RSI_4H * W_RSI4H + Dominance * W_Dominance + (1 - Volatility) * W_Volatility + Buy Volume * W_BuyVolume
Net Fear & Greed Score
Net Score = (Greed Score - Fear Score) * 100
Interpretation:
Above 70: Extreme greed -> possible overbought conditions.
Below -70: Extreme fear -> potential buying opportunity.
Near 0: Neutral market sentiment.
Trend Reversal Detection
The indicator includes two moving averages for enhanced trend detection:
Short-term SMA (50-periods) - Reacts quicklier to changes in sentiment.
Long-term SMA (200-periods) - Captures broader trend reversals.
How Crossovers Work:
Short SMA crossing above Long SMA -> Potential bullish reversal.
Short SMA crossing below Long SMA -> Possible bearish trend shift.
Alerts for SMA crossovers help traders act on momentum shifts in real-time.
Customization and Visualization
The Net Score dynamically changes color: green for greed, red for fear.
Users can adjust weightings directly from settings, avoiding manual script modifications.
Reference levels at 70 and -70 provide clarity on extreme market conditions.
Conclusion
The Crypto Fear & Greed Score provides a powerful and objective measure of market sentiment, helping traders navigate extreme conditions effectively.
🟢 If the Net Score is below -70, panic may present a buying opportunity.
🔴 If the Net Score is above 70, excessive euphoria may indicate a selling opportunity.
⚖️ Neutral values suggest a balanced market sentiment.
By customizing weight parameters and utilizing trend reversal alerts, traders can gain a deeper insight into market psychology and make more informed trading decisions. 🚀

Red & Green Zone ReversalOverview
The “Red & Green Zone Reversal” indicator is designed to visually highlight potential reversal zones on your chart by using a combination of Bollinger Bands and the Relative Strength Index (RSI).
It overlays on the chart and provides background color cues—red for oversold conditions and green for overbought conditions—along with corresponding alert triggers.
Key Components
Overlay: The indicator is set to overlay the chart, meaning its visual cues (colored backgrounds) are drawn directly on the price chart.
Bollinger Bands Calculation
Period: A 20-period simple moving average (SMA) is calculated from the closing prices.
Standard Deviation Multiplier: A multiplier of 2.0 is applied.
Bands Defined:
Basis: The 20-period SMA.
Deviation: Calculated as 2 times the standard deviation over the same period.
Upper Band: Basis plus the deviation.
Lower Band: Basis minus the deviation.
RSI Calculation
Period: The RSI is computed over a 14-period span using the closing prices.
Thresholds:
Oversold Threshold: 30 (used for the red zone condition).
Overbought Threshold: 70 (used for the green zone condition).
Zone Conditions
Red Zone (Oversold):
Criteria: The price is below the lower Bollinger Band and the RSI is below 30.
Purpose: Highlights a situation where the asset may be deeply oversold, signaling a potential reversal to the upside.
Green Zone (Overbought):
Criteria: The price is above the upper Bollinger Band and the RSI is above 70.
Purpose: Indicates that the asset may be overbought, potentially signaling a reversal to the downside.
Visual and Alert Components
Background Coloring:
Red Background: Applied when the red zone condition is met (using a semi-transparent red).
Green Background: Applied when the green zone condition is met (using a semi-transparent green).
Alerts:
Red Alert: An alert condition titled “Deep Oversold Alert” is triggered with the message “Deep Oversold Signal triggered!” when the red zone criteria are satisfied.
Green Alert: Similarly, an alert condition titled “Deep Overbought Alert” is triggered with the message “Deep Overbought Signal triggered!” when the green zone criteria are met.
Important Disclaimers
Not Financial Advice:
This indicator is provided for informational and analytical purposes only. It does not constitute trading advice or a recommendation to buy or sell any asset. Traders should use it as one of several tools in their analysis and should perform their own due diligence.
Risk Management:
Trading inherently involves risk. Past performance is not indicative of future results. Always implement appropriate risk management and use stop losses where necessary.
Summary
In summary, the “Red & Green Zone Reversal” indicator uses Bollinger Bands and RSI to detect extreme market conditions. It visually marks oversold (red) and overbought (green) conditions directly on the chart and offers alert conditions to help traders monitor these potential reversal points.
Enjoy!!

Multi timeframe RSIMulti-Timeframe RSI Indicator
This indicator displays the Relative Strength Index (RSI) from multiple timeframes—1 minute, 5 minutes, 15 minutes, and 30 minutes—on a single chart. Designed for intraday scalpers and short-term traders, it provides a comprehensive view of momentum across different timeframes, helping traders make more informed decisions.
✨ Why Use This Indicator?
✔ Enhanced Confirmation – Identify trends and momentum shifts with RSI signals from multiple timeframes.
✔ Perfect for Scalping & Intraday Trading – Quickly spot overbought/oversold conditions across different timeframes.
✔ Multi-Timeframe Confluence – Align entries and exits with stronger confirmation by analyzing RSI across short-term charts.
✔ Customizable & Easy to Use – Adjust RSI settings to suit your trading style.
This is a must-have tool for traders looking to refine their entries and exits with a multi-timeframe perspective! 🚀

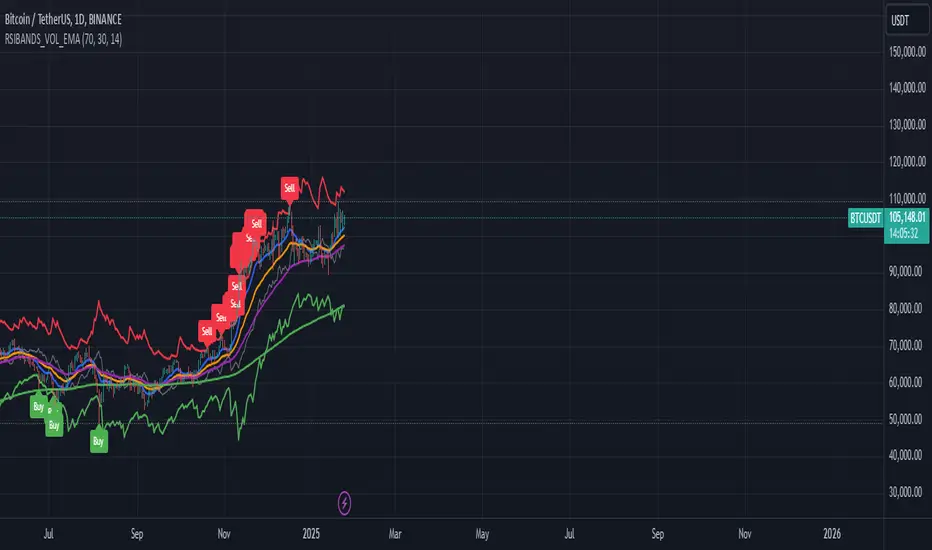
RSI Bands with Volume and EMAThis script is a comprehensive technical analysis tool designed to help traders identify key market signals using RSI bands, volume, and multiple Exponential Moving Averages (EMAs). It overlays the following on the chart:
RSI Bands: The script calculates and plots two bands based on the Relative Strength Index (RSI), indicating overbought and oversold levels. These bands act as dynamic support and resistance zones:
Resistance Band (Upper Band): Plotted when the RSI exceeds the overbought level, typically indicating a potential sell signal.
Support Band (Lower Band): Plotted when the RSI falls below the oversold level, typically indicating a potential buy signal.
Midline: The average of the upper and lower bands, acting as a neutral reference.
Buy/Sell Labels: Labels are dynamically added to the chart when price reaches the overbought or oversold levels.
A "Buy" label appears when the price reaches the oversold (lower) band.
A "Sell" label appears when the price reaches the overbought (upper) band.
Volume Indicator: The script visualizes trading volume as histograms, with red or green bars representing decreasing or increasing volume, respectively. The volume height is visually reduced for better clarity and comparison.
Exponential Moving Averages (EMAs): The script calculates and plots four key EMAs (12, 26, 50, and 200) to highlight short-term, medium-term, and long-term trends:
EMA 12: Blue
EMA 26: Orange
EMA 50: Purple
EMA 200: Green
The combined use of RSI, volume, and EMAs offers traders a multi-faceted view of the market, assisting in making informed decisions about potential price reversals, trends, and volume analysis. The script is particularly useful for identifying entry and exit points on charts like BTC/USDT, although it can be applied to any asset.
Multiple Values TableThis Pine Script indicator, named "Multiple Values Table," provides a comprehensive view of various technical indicators in a tabular format directly on your trading chart. It allows traders to quickly assess multiple metrics without switching between different charts or panels.
Key Features:
Table Position and Size:
Users can choose the position of the table on the chart (e.g., top left, top right).
The size of the table can be adjusted (e.g., tiny, small, normal, large).
Moving Averages:
Calculates the 5-day Exponential Moving Average (5DEMA) using daily data.
Calculates the 5-week and 20-week EMAs (5WEMA and 20WEMA) using weekly data.
Indicates whether the current price is above or below these moving averages in percentage terms.
Drawdown and Williams VIX Fix:
Computes the drawdown from the 365-day high to the current close.
Calculates the Williams VIX Fix (WVF), which measures the volatility of the asset.
Shows both the current WVF and a 2% drawdown level.
Relative Strength Index (RSI):
Displays the current RSI and compares it to the RSI from 14 days ago.
Indicates whether the RSI is increasing, decreasing, or flat.
Stochastic RSI:
Computes the Stochastic RSI and compares it to the value from 14 days ago.
Indicates whether the Stochastic RSI is increasing, decreasing, or flat.
Normalized MACD (NMACD):
Calculates the Normalized MACD values.
Indicates whether the MACD is increasing, decreasing, or flat.
Awesome Oscillator (AO):
Calculates the AO on a daily timeframe.
Indicates whether the AO is increasing, decreasing, or flat.
Volume Analysis:
Displays the average volume over the last 22 days.
Shows the current day's volume as a percentage of the average volume.
Percentile Calculations:
Calculates the current percentile rank of the WVF and ATH over specified periods.
Indicates the percentile rank of the current volume percentage over the past period.
Table Display:
All these values are presented in a neatly formatted table.
The table updates dynamically with the latest data.
Example Use Cases:
Comprehensive Market Analysis: Quickly assess multiple indicators at a glance.
Trend and Momentum Analysis: Identify trends and momentum changes based on various moving averages and oscillators.
Volatility and Drawdown Monitoring: Track volatility and drawdown levels to manage risk effectively.
This script offers a powerful tool for traders who want to have a holistic view of various technical indicators in one place. It provides flexibility in customization and a user-friendly interface to enhance your trading experience.

RSI to Price RatioThe RSI to Price Ratio is a technical indicator designed to provide traders with a unique perspective by analyzing the relationship between the Relative Strength Index (RSI) and the underlying asset's price. Unlike traditional RSI, which is viewed on a scale from 0 to 100, this indicator normalizes the RSI by dividing it by the price, resulting in a dynamic ratio that adjusts to price movements. The histogram format makes it easy to visualize fluctuations, with distinct color coding for overbought (red), oversold (green), and neutral (blue) conditions.
This indicator excels in helping traders identify potential reversal zones and trend continuation signals. Overbought and oversold levels are dynamically adjusted using the price source, making the indicator more adaptive to market conditions. Additionally, the ability to plot these OB/OS thresholds as lines on the histogram ensures traders can quickly assess whether the market is overstretched in either direction. By combining RSI’s momentum analysis with price normalization, this tool is particularly suited for traders who value precision and nuanced insights into market behavior. It can be used as a standalone indicator or in conjunction with other tools to refine entry and exit strategies.
Bollinger Bands + RSI StrategyThe Bollinger Bands + RSI strategy combines volatility and momentum indicators to spot trading opportunities in intraday settings. Here’s a concise summary:
Components:
Bollinger Bands: Measures market volatility. The lower band signals potential buying opportunities when the price is considered oversold.
Relative Strength Index (RSI): Evaluates momentum to identify overbought or oversold conditions. An RSI below 30 indicates oversold, suggesting a buy, and above 70 indicates overbought, suggesting a sell.
Strategy Execution:
Buy Signal : Triggered when the price falls below the lower Bollinger Band while the RSI is also below 30.
Sell Signal : Activated when the price exceeds the upper Bollinger Band with an RSI above 70.
Exit Strategy : Exiting a buy position is considered when the RSI crosses back above 50, capturing potential rebounds.
Advantages:
Combines price levels with momentum for more reliable signals.
Clearly defined entry and exit points help minimize emotional trading.
Considerations:
Can produce false signals in very volatile or strongly trending markets.
Best used in markets without a strong prevailing trend.
This strategy aids traders in making decisions based on technical indicators, enhancing their ability to profit from short-term price movements.

Price Movement Predictor (PMP)The Price Movement Predictor (PMP) is a versatile trading indicator designed to assist traders in identifying potential buy and sell opportunities in the market. This indicator utilizes a combination of technical analysis tools to generate signals based on the relative strength index (RSI) and moving averages, ensuring a robust and strategic approach to trading.
Key Features:
RSI-Based Signal Generation:
The indicator monitors the RSI to identify overbought and oversold conditions in the market.
A buy signal is generated when the RSI drops below a predefined oversold threshold, indicating potential upward price movement.
Conversely, a sell signal is triggered when the RSI exceeds a specified overbought level, suggesting a possible price decline.
Moving Average Confirmation:
The indicator employs two moving averages: a short-term and a long-term moving average.
Buy and sell signals are confirmed only after a crossover event occurs, ensuring that trades are entered in alignment with market trends.
The short moving average crossing above the long moving average confirms a buy signal, while a crossover below confirms a sell signal.
Take Profit and Stop Loss Management:
The PMP includes adjustable take profit and stop loss levels, which are automatically calculated based on user-defined percentages.
Labels indicating the take profit (TP) and stop loss (SL) levels are plotted on the chart, helping traders manage their risk effectively.
Alerts are available for both TP and SL conditions, allowing traders to stay informed about their trade outcomes.
User-Friendly Interface:
The indicator provides an intuitive setup with adjustable parameters for moving average lengths, RSI levels, and TP/SL ratios.
Clear buy and sell signals are displayed directly on the chart, making it easy for traders to act on potential opportunities.
Usage:
The Price Movement Predictor is ideal for traders who seek a systematic approach to identify trading opportunities and manage risk. By combining RSI signals with moving average crossovers, the indicator helps filter out false signals and enhances the accuracy of trade entries. It is suitable for various trading styles, including day trading, swing trading, and long-term investing.

Stochastic Trendlines with Breakouts [Jamshid] - EnhancedStochastic Trendlines with Breakouts - Enhanced Version
This advanced Stochastic Trendlines with Breakouts script combines several powerful features to provide enhanced breakout detection based on the Stochastic Oscillator and additional confirmation signals. This script is designed to help traders identify key trend reversals, breakout points, and pivot levels with more accuracy by integrating advanced filters such as RSI confirmation, moving average trend filtering, volatility filtering, divergence detection, and multi-timeframe analysis.
Key Features:
Stochastic Oscillator-Based Breakouts:
Automatically detects breakouts based on the smoothed Stochastic Oscillator values (%K and %D), providing insights into overbought and oversold conditions.
Customizable overbought and oversold levels, with a mid-level (50) line for additional reference.
Trendlines on Pivot Points:
Automatically plots dynamic trendlines based on pivot highs and lows of the smoothed Stochastic %K, helping to visualize potential reversal points.
RSI Confirmation (Optional):
Filters breakout signals using the Relative Strength Index (RSI) to confirm breakouts only when the RSI is below 50 for downtrend breakouts and above 50 for uptrend breakouts.
Visual confirmation with a green "RSI Conf." label displayed on the chart when the RSI condition is met.
Moving Average Filter (Optional):
Confirms breakout signals in the direction of a user-defined Moving Average (MA) to trade in the overall market trend direction.
MA length is fully customizable.
Stochastic Divergence Filter (Optional):
Detects bullish or bearish divergence between the price and Stochastic Oscillator values, adding an extra layer of confirmation.
Multi-Timeframe Confirmation (Optional):
Confirms breakouts by checking the Stochastic %K and %D values from a higher timeframe. This helps in avoiding false signals by aligning with the broader market trend.
The higher timeframe can be customized to any timeframe (e.g., daily, weekly, etc.).
Volatility Filter (Optional):
Uses the ATR (Average True Range) to filter out breakouts during periods of low volatility, ensuring signals are only triggered when there is sufficient price movement.
ATR length and multiplier are fully customizable.
Custom Alerts:
Alerts are available for new trendline detections (both pivot high and pivot low) and for confirmed breakout signals. These alerts help traders stay informed in real-time without needing to monitor the chart continuously.
How to Use:
Customize the Stochastic Oscillator settings, such as %K smoothing and %D line parameters, to fit your trading strategy.
Enable or disable additional filtering features (RSI, MA, divergence, MTF, volatility) as needed.
Set up alerts for specific breakout conditions directly in TradingView to stay notified when breakout signals are triggered.
This script is designed for traders who are looking for precision breakout signals with added layers of confirmation to avoid false breakouts and enhance trading accuracy.

Gold Scalping Strategy with Precise EntriesThe Gold Scalping Strategy with Precise Entries is designed to take advantage of short-term price movements in the gold market (XAU/USD). This strategy uses a combination of technical indicators and chart patterns to identify precise buy and sell opportunities during times of consolidation and trend continuation.
Key Elements of the Strategy:
Exponential Moving Averages (EMAs):
50 EMA: Used as the shorter-term moving average to detect the recent price trend.
200 EMA: Used as the longer-term moving average to determine the overall market trend.
Trend Identification:
A bullish trend is identified when the 50 EMA is above the 200 EMA.
A bearish trend is identified when the 50 EMA is below the 200 EMA.
Average True Range (ATR):
ATR (14) is used to calculate the market's volatility and to set a dynamic stop loss based on recent price movements. Higher ATR values indicate higher volatility.
ATR helps define a suitable stop-loss distance from the entry point.
Relative Strength Index (RSI):
RSI (14) is used as a momentum oscillator to detect overbought or oversold conditions.
However, in this strategy, the RSI is primarily used as a consolidation filter to look for neutral zones (between 45 and 55), which may indicate a potential breakout or trend continuation after a consolidation phase.
Engulfing Patterns:
Bullish Engulfing: A bullish signal is generated when the current candle fully engulfs the previous bearish candle, indicating potential upward momentum.
Bearish Engulfing: A bearish signal is generated when the current candle fully engulfs the previous bullish candle, signaling potential downward momentum.
Precise Entry Conditions:
Long (Buy):
The 50 EMA is above the 200 EMA (bullish trend).
The RSI is between 45 and 55 (neutral/consolidation zone).
A bullish engulfing pattern occurs.
The price closes above the 50 EMA.
Short (Sell):
The 50 EMA is below the 200 EMA (bearish trend).
The RSI is between 45 and 55 (neutral/consolidation zone).
A bearish engulfing pattern occurs.
The price closes below the 50 EMA.
Take Profit and Stop Loss:
Take Profit: A fixed 20-pip target (where 1 pip = 0.10 movement in gold) is used for each trade.
Stop Loss: The stop-loss is dynamically set based on the ATR, ensuring that it adapts to current market volatility.
Visual Signals:
Buy and sell signals are visually plotted on the chart using green and red labels, indicating precise points of entry.
Advantages of This Strategy:
Trend Alignment: The strategy ensures that trades are taken in the direction of the overall trend, as indicated by the 50 and 200 EMAs.
Volatility Adaptation: The use of ATR allows the stop loss to adapt to the current market conditions, reducing the risk of premature exits in volatile markets.
Precise Entries: The combination of engulfing patterns and the neutral RSI zone provides a high-probability entry signal that captures momentum after consolidation.
Quick Scalping: With a fixed 20-pip profit target, the strategy is designed to capture small price movements quickly, which is ideal for scalping.
This strategy can be applied to lower timeframes (such as 1-minute, 5-minute, or 15-minute charts) for frequent trade opportunities in gold trading, making it suitable for day traders or scalpers. However, proper risk management should always be used due to the inherent volatility of gold.

TPS Short Strategy by Larry ConnersThe TPS Short strategy aims to capitalize on extreme overbought conditions in an ETF by employing a scaling-in approach when certain technical indicators signal potential reversals. The strategy is designed to short the ETF when it is deemed overextended, based on the Relative Strength Index (RSI) and moving averages.
Components:
200-Day Simple Moving Average (SMA):
Purpose: Acts as a long-term trend filter. The ETF must be below its 200-day SMA to be eligible for shorting.
Rationale: The 200-day SMA is widely used to gauge the long-term trend of a security. When the price is below this moving average, it is often considered to be in a downtrend (Tushar S. Chande & Stanley Kroll, "The New Technical Trader: Boost Your Profit by Plugging Into the Latest Indicators").
2-Period RSI:
Purpose: Measures the speed and change of price movements to identify overbought conditions.
Criteria: Short 10% of the position when the 2-period RSI is above 75 for two consecutive days.
Rationale: A high RSI value (above 75) indicates that the ETF may be overbought, which could precede a price reversal (J. Welles Wilder, "New Concepts in Technical Trading Systems").
Scaling-In Mechanism:
Purpose: Gradually increase the short position as the ETF price rises beyond previous entry points.
Scaling Strategy:
20% more when the price is higher than the first entry.
30% more when the price is higher than the second entry.
40% more when the price is higher than the third entry.
Rationale: This incremental approach allows for an increased position size in a worsening trend, potentially increasing profitability if the trend continues to align with the strategy’s premise (Marty Schwartz, "Pit Bull: Lessons from Wall Street's Champion Day Trader").
Exit Conditions:
Criteria: Close all positions when the 2-period RSI drops below 30 or the 10-day SMA crosses above the 30-day SMA.
Rationale: A low RSI value (below 30) suggests that the ETF may be oversold and could be poised for a rebound, while the SMA crossover indicates a potential change in the trend (Martin J. Pring, "Technical Analysis Explained").
Risks and Considerations:
Market Risk:
The strategy assumes that the ETF will continue to decline once shorted. However, markets can be unpredictable, and price movements might not align with the strategy's expectations, especially in a volatile market (Nassim Nicholas Taleb, "The Black Swan: The Impact of the Highly Improbable").
Scaling Risks:
Scaling into a position as the price increases may increase exposure to adverse price movements. This method can amplify losses if the market moves against the position significantly before any reversal occurs.
Liquidity Risk:
Depending on the ETF’s liquidity, executing large trades in increments might affect the price and increase trading costs. It is crucial to ensure that the ETF has sufficient liquidity to handle large trades without significant slippage (James Altucher, "Trade Like a Hedge Fund").
Execution Risk:
The strategy relies on timely execution of trades based on specific conditions. Delays or errors in order execution can impact performance, especially in fast-moving markets.
Technical Indicator Limitations:
Technical indicators like RSI and SMA are based on historical data and may not always predict future price movements accurately. They can sometimes produce false signals, leading to potential losses if used in isolation (John Murphy, "Technical Analysis of the Financial Markets").
Conclusion
The TPS Short strategy utilizes a combination of long-term trend filtering, overbought conditions, and incremental shorting to potentially profit from price reversals. While the strategy has a structured approach and leverages well-known technical indicators, it is essential to be aware of the inherent risks, including market volatility, liquidity issues, and potential limitations of technical indicators. As with any trading strategy, thorough backtesting and risk management are crucial to its successful implementation.

RSI Buy/Sell SignalsThis Pine Script is designed to plot Buy and Sell signals based on the Relative Strength Index (RSI) for both 15-minute and hourly timeframes. It calculates the RSI values for the current 15-minute chart and requests the hourly RSI data for comparison. Buy signals are generated when the RSI crosses above 60 in either timeframe, while sell signals occur when the RSI crosses below 40. The script also plots visual markers on the chart, indicating buy signals with green labels below the price bars and sell signals with red labels above the price bars. Additionally, it allows for alert conditions, notifying the user when a buy or sell signal is triggered.

RSI TrendsThis TradingView script combines RSI trend analysis with FVG (Fair Value Gap) detection to identify potential buy and sell opportunities in financial markets. The script is customizable and provides extensive visual feedback directly on the chart, enhancing both strategic entry and exit points for traders. Raw code of FVG was taken from LuxAlgo
Features
FVG Detection: Identifies Fair Value Gaps (FVG), and provides options to display these gaps based on user settings.
RSI Trend Bars: Utilizes the Relative Strength Index (RSI) to paint bars indicating overbought and oversold conditions. This helps traders understand current market sentiment and potential reversal points.
Customizable Settings: Users can customize the timeframe, FVG types, and RSI thresholds. This flexibility allows the script to be adapted to various trading styles and timeframes.
Historical Analysis: Option to display or hide historical FVGs, helping users analyze past market behavior without cluttering the chart.
Alert System: Integrated alerts for detected buy and sell signals based on RSI conditions and the presence or absence of FVGs. This feature notifies traders of potential trading opportunities.
Trading Signals
Buy, Buy+, and Buy++ Signals: These signals are triggered based on overbought conditions without corresponding bearish FVG presence, with increasing stringency for higher tiers of buy signals.
Sell, Sell+, and Sell++ Signals: These signals are based on oversold conditions devoid of bullish FVG presence, with each subsequent plus sign indicating a higher level of confirmation required to trigger the signal.
Use Case
Ideal for traders who rely on technical analysis and are looking for an automated way to spot potential buy and sell points using both price action gaps and momentum indicators.
Customization
All input parameters are adjustable directly from the indicator's settings panel, making it easy to tailor the tool to your trading needs and preferences.

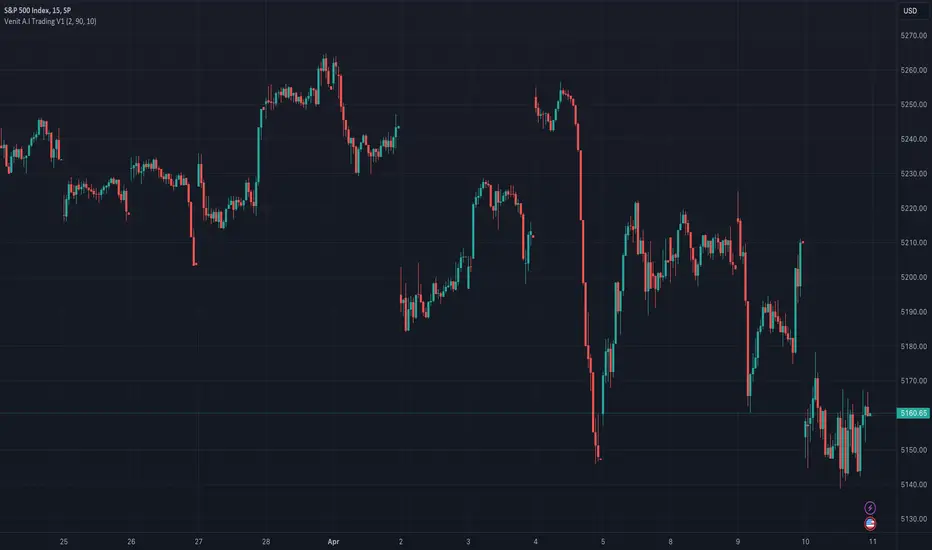
Venit A.I Trading V1RSI indicatorThis indicator is designed to provide buy and sell signals based on the Relative Strength Index (RSI). Here's a breakdown of its components and functionality:
1. **Input Parameters**:
- `Period`: This parameter allows the user to adjust the period used in calculating the RSI.
- `Upper Threshold` and `Lower Threshold`: These parameters define the overbought and oversold levels for the RSI.
- `Imverse Algorithm`: This parameter allows the user to toggle between different algorithms for generating buy and sell signals.
- `Show Lines`: This parameter toggles the visibility of lines on the chart indicating buy and sell signals.
- `Show Labels`: This parameter toggles the visibility of labels on the chart indicating buy and sell signals.
2. **RSI Calculation**:
- The RSI is calculated using the specified period (`myPeriod`), typically representing the closing prices of the asset.
3. **Buy and Sell Conditions**:
- Buy conditions are determined based on whether the RSI crosses below the lower threshold (`myThresholdDn`), indicating potential oversold conditions.
- Sell conditions are determined based on whether the RSI crosses above the upper threshold (`myThresholdUp`), indicating potential overbought conditions.
- The choice of buy and sell conditions can be toggled using the `Imverse Algorithm` parameter.
4. **Position Tracking**:
- The indicator maintains a variable `myPosition` to track the current position (buy or sell) based on the generated signals.
- If a buy signal occurs (`buy` condition is true), `myPosition` is set to 0. If a sell signal occurs (`sell` condition is true) or the previous position was a buy, `myPosition` is set to 1. Otherwise, `myPosition` remains unchanged.
5. **Visualization**:
- Buy and sell signals are plotted on the chart using shapes (`plotshape`) based on the `myLineToggle` and `myLabelToggle` parameters.
- Lines are drawn on the chart to visually represent buy and sell signals.
- Labels are placed on the chart indicating buy and sell signals.
6. **Alerts**:
- The indicator provides alerts for buy and sell signals using the `alertcondition` function.
Overall, this indicator aims to provide traders with signals based on RSI movements, helping them identify potential buying and selling opportunities in the market. The flexibility in parameters allows users to customize the indicator based on their trading preferences and strategies.
Kzx | RSI + Div + MACDComponents Description:
Relative Strength Index (RSI):
Purpose: Measures the magnitude of recent price changes to evaluate overbought or oversold conditions in the price of a stock or other asset.
Implementation: The script allows users to set the length of the RSI calculation and defines overbought and oversold levels, which can be visually represented on the chart. Additional features include options to fill and/or color the background of the chart when overbought or oversold levels are reached.
Divergence (Div):
Purpose: Identifies instances where the price of an asset is moving in the opposite direction of a momentum indicator, such as the RSI in this script. Divergences can signal potential trend reversals.
Implementation: The script provides options for users to define the conditions under which divergences are identified, including the source of price tops/bottoms, detection limits, and the maximum lookback period for divergence analysis. It visually highlights these divergences on the chart.
Moving Average Convergence Divergence (MACD):
Purpose: Tracks the relationship between two moving averages of a security's price. The MACD is used to identify trend direction, momentum, and potential reversal points through crossovers.
Implementation: The script calculates the MACD line and its signal line. It plots buy or sell markers based on crossovers between these two lines, indicating potential entry or exit points.
Script Category:
Category: Technical Analysis / Indicators and Strategies
Subcategory: Oscillators (for RSI and MACD) and Trend Analysis (for Divergence)
Usage:
The script is designed for traders and analysts who rely on technical analysis to make informed decisions in the financial markets. By integrating RSI, divergence detection, and MACD analysis into a single script, users can gain a more nuanced understanding of market conditions, potentially improving their trading strategies.
Customization and Visualization:
Users can customize various parameters, including lengths for RSI and MACD, overbought/oversold levels, divergence detection criteria, and visual aspects like colors and marker sizes.
The script provides visual cues directly on the price chart, making it easy to spot potential buy/sell signals, overbought/oversold conditions, and divergences without the need to switch between different indicators.

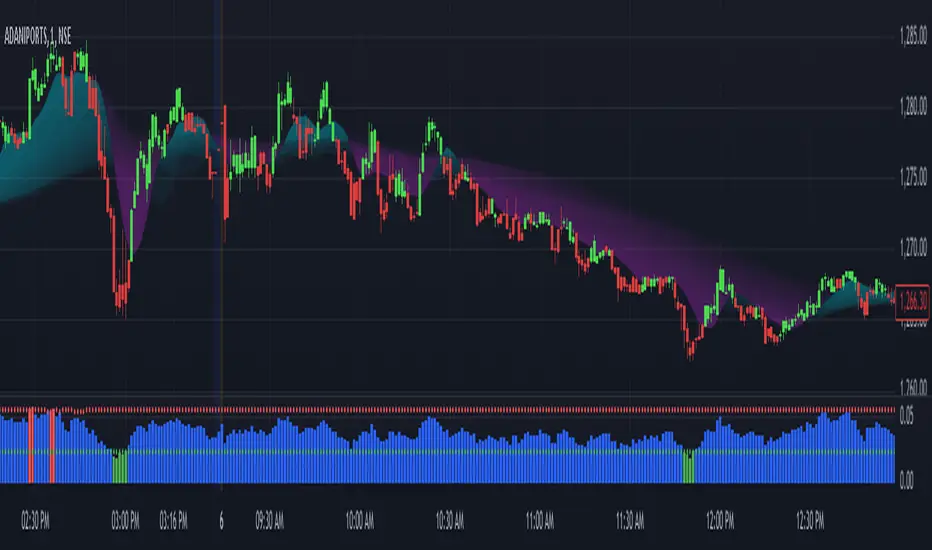
Market Trend Indicator (FinnoVent)The Market Trend Indicator (FinnoVent) is a comprehensive trading tool designed to provide clear visual cues for market trends on TradingView charts. This indicator combines the principles of Exponential Moving Averages (EMAs), Bollinger Bands, the Average Directional Index (ADX), and the Relative Strength Index (RSI) to offer a nuanced view of market movements.
How It Works:
Trend Identification with EMAs: The indicator uses two EMAs (3-period and 30-period) to identify the primary trend. An upward trend is signaled when the 3-period EMA crosses above the 30-period EMA, while a downward trend is indicated when the 3-period EMA crosses below the 30-period EMA.
Sideways Market Detection: To identify sideways trends, the indicator employs Bollinger Bands, ADX, and RSI. A sideways (or consolidating) market condition is identified when:
The price is between the middle 60% of the Bollinger Bands (avoiding the top and bottom 20%).
The ADX is below 30, indicating a lack of a strong trend.
The RSI is between 40 and 60, suggesting a neutral market momentum.
Visual Representation:
Bar Colors: The indicator colors the price bars on the chart based on the identified trend:
Green Bars: Indicate an upward trend.
Red Bars: Indicate a downward trend.
Grey Bars: Indicate a sideways or consolidating market.
How to Use:
Trend Following: Use the colored bars as a guide for trend following. Green bars suggest a potential entry for a long position, while red bars may indicate opportunities for short positions.
Sideways Market Caution: Grey bars signal a sideways market. In such conditions, traders might exercise caution and avoid trend-following strategies, as the market lacks a clear direction.
Complementary Analysis: While the Market Trend Indicator (FinnoVent) provides valuable insights, it's recommended to use it in conjunction with other forms of analysis (like fundamental analysis, other technical indicators, or price action) for comprehensive decision-making.
Suitable for: This indicator is versatile and can be applied to various timeframes and trading instruments, including stocks, forex, commodities, and indices.
Important Notes:
The indicator is designed to minimize repainting but always consider the latest data for the most accurate analysis.
Like all indicators, it is not foolproof. It works best when combined with a solid trading plan and risk management strategies.
RMI Trend SniperThe "RMI Trend Sniper" is a powerful trend-following indicator designed to help traders identify potential buy and sell signals in the market.
It combines elements of the Relative Strength Index (RSI) and the Money Flow Index (MFI) to provide a comprehensive view of market momentum and strength.
🔷 Key Features:
🔹 Customizable Settings : Tailor the indicator to your trading preferences with customizable input parameters, including RSI and MFI lengths, threshold levels, and visual settings.
🔹 Momentum Signals : The indicator generates clear bullish and bearish momentum signals, allowing you to spot potential trend reversals or continuations.
🔹 The positive condition considers the previous RMI value, current RMI value, and positive change in the 5-period exponential moving average (EMA) of the closing price.
🔹 The negative condition looks at the current RMI value and negative change in the 5-period EMA.
🔹 Visual Bands : Visualize market volatility with dynamically plotted bands around the Range Weighted Moving Average (RWMA), providing insights into potential price fluctuations.
🔹 Candlestick Coloring : Easily identify bullish and bearish conditions with color-coded candlesticks, helping you make informed trading decisions.
The "RMI Trend Sniper" is a versatile tool suitable for traders of all experience levels. Whether you are a novice or an experienced trader, this indicator can help you enhance your technical analysis and improve your trading strategies.

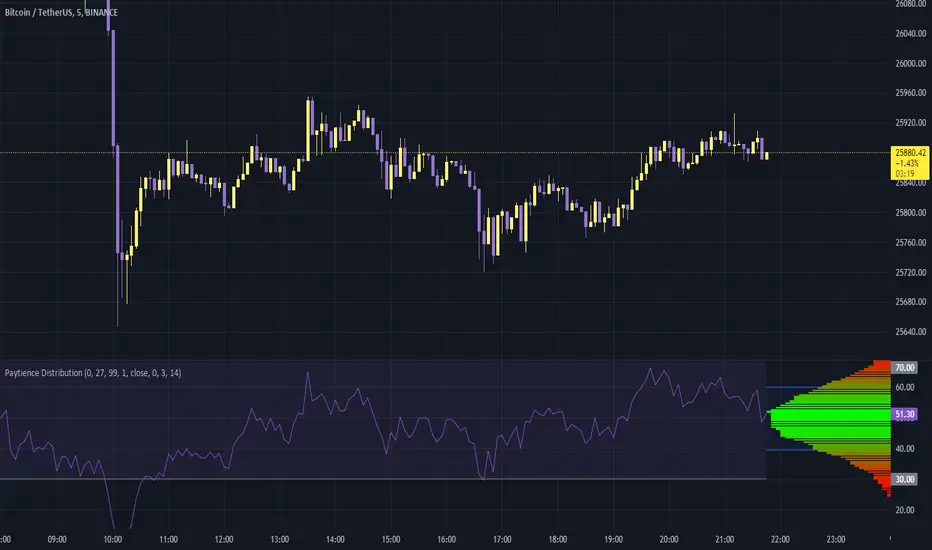
Paytience DistributionPaytience Distribution Indicator User Guide
Overview:
The Paytience Distribution indicator is designed to visualize the distribution of any chosen data source. By default, it visualizes the distribution of a built-in Relative Strength Index (RSI). This guide provides details on its functionality and settings.
Distribution Explanation:
A distribution in statistics and data analysis represents the way values or a set of data are spread out or distributed over a range. The distribution can show where values are concentrated, values are absent or infrequent, or any other patterns. Visualizing distributions helps users understand underlying patterns and tendencies in the data.
Settings and Parameters:
Main Settings:
Window Size
- Description: This dictates the amount of data used to calculate the distribution.
- Options: A whole number (integer).
- Tooltip: A window size of 0 means it uses all the available data.
Scale
- Description: Adjusts the height of the distribution visualization.
- Options: Any integer between 20 and 499.
Round Source
- Description: Rounds the chosen data source to a specified number of decimal places.
- Options: Any whole number (integer).
Minimum Value
- Description: Specifies the minimum value you wish to account for in the distribution.
- Options: Any integer from 0 to 100.
- Tooltip: 0 being the lowest and 100 being the highest.
Smoothing
- Description: Applies a smoothing function to the distribution visualization to simplify its appearance.
- Options: Any integer between 1 and 20.
Include 0
- Description: Dictates whether zero should be included in the distribution visualization.
- Options: True (include) or False (exclude).
Standard Deviation
- Description: Enables the visualization of standard deviation, which measures the amount of variation or dispersion in the chosen data set.
- Tooltip: This is best suited for a source that has a vaguely Gaussian (bell-curved) distribution.
- Options: True (enable) or False (disable).
Color Options
- High Color and Low Color: Specifies colors for high and low data points.
- Standard Deviation Color: Designates a color for the standard deviation lines.
Example Settings:
Example Usage RSI
- Description: Enables the use of RSI as the data source.
- Options: True (enable) or False (disable).
RSI Length
- Description: Determines the period over which the RSI is calculated.
- Options: Any integer greater than 1.
Using an External Source:
To visualize the distribution of an external source:
Select the "Move to" option in the dropdown menu for the Paytience Distribution indicator on your chart.
Set it to the existing panel where your external data source is placed.
Navigate to "Pin to Scale" and pin the indicator to the same scale as your external source.
Indicator Logic and Functions:
Sinc Function: Used in signal processing, the sinc function ensures the elimination of aliasing effects.
Sinc Filter: A filtering mechanism which uses sinc function to provide estimates on the data.
Weighted Mean & Standard Deviation: These are statistical measures used to capture the central tendency and variability in the data, respectively.
Output and Visualization:
The indicator visualizes the distribution as a series of colored boxes, with the intensity of the color indicating the frequency of the data points in that range. Additionally, lines representing the standard deviation from the mean can be displayed if the "Standard Deviation" setting is enabled.
The example RSI, if enabled, is plotted along with its common threshold lines at 70 (upper) and 30 (lower).
Understanding the Paytience Distribution Indicator
1. What is a Distribution?
A distribution represents the spread of data points across different values, showing how frequently each value occurs. For instance, if you're looking at a stock's closing prices over a month, you may find that the stock closed most frequently around $100, occasionally around $105, and rarely around $110. Graphically visualizing this distribution can help you see the central tendencies, variability, and shape of your data distribution. This visualization can be essential in determining key trading points, understanding volatility, and getting an overview of the market sentiment.
2. The Rounding Mechanism
Every asset and dataset is unique. Some assets, especially cryptocurrencies or forex pairs, might have values that go up to many decimal places. Rounding these values is essential to generate a more readable and manageable distribution.
Why is Rounding Needed? If every unique value from a high-precision dataset was treated distinctly, the resulting distribution would be sparse and less informative. By rounding off, the values are grouped, making the distribution more consolidated and understandable.
Adjusting Rounding: The `Round Source` input allows users to determine the number of decimal places they'd like to consider. If you're working with an asset with many decimal places, adjust this setting to get a meaningful distribution. If the rounding is set too low for high precision assets, the distribution could lose its utility.
3. Standard Deviation and Oscillators
Standard deviation is a measure of the amount of variation or dispersion of a set of values. In the context of this indicator:
Use with Oscillators: When using oscillators like RSI, the standard deviation can provide insights into the oscillator's range. This means you can determine how much the oscillator typically deviates from its average value.
Setting Bounds: By understanding this deviation, traders can better set reasonable upper and lower bounds, identifying overbought or oversold conditions in relation to the oscillator's historical behavior.
4. Resampling
Resampling is the process of adjusting the time frame or value buckets of your data. In the context of this indicator, resampling ensures that the distribution is manageable and visually informative.
Resample Size vs. Window Size: The `Resample Resolution` dictates the number of bins or buckets the distribution will be divided into. On the other hand, the `Window Size` determines how much of the recent data will be considered. It's crucial to ensure that the resample size is smaller than the window size, or else the distribution will not accurately reflect the data's behavior.
Why Use Resampling? Especially for price-based sources, setting the window size around 500 (instead of 0) ensures that the distribution doesn't become too overloaded with data. When set to 0, the window size uses all available data, which may not always provide an actionable insight.
5. Uneven Sample Bins and Gaps
You might notice that the width of sample bins in the distribution is not uniform, and there can be gaps.
Reason for Uneven Widths: This happens because the indicator uses a 'resampled' distribution. The width represents the range of values in each bin, which might not be constant across bins. Some value ranges might have more data points, while others might have fewer.
Gaps in Distribution: Sometimes, there might be no data points in certain value ranges, leading to gaps in the distribution. These gaps are not flaws but indicate ranges where no values were observed.
In conclusion, the Paytience Distribution indicator offers a robust mechanism to visualize the distribution of data from various sources. By understanding its intricacies, users can make better-informed trading decisions based on the distribution and behavior of their chosen data source.
Philpose's Binary Turbo 1.2Hello there,
I'm thrilled to introduce my very first TradingView indicator - "Philpose's Binary Turbo 1.0." This indicator isn't just another tool; it's my unique take on binary options trading, powered by the Relative Strength Index (RSI).
Differences from Other Indicators:
This indicator is designed for traders who prefer short-term trading, as it uses a 1-minute timeframe.
It assumes that RSI crossovers of overbought and oversold levels can be used to generate binary options signals.
Users should backtest and evaluate the indicator's performance in different market conditions and consider risk management strategies.
Custom Logic: This indicator implements a custom trading logic based on RSI crossovers of overbought and oversold levels. Many indicators on TradingView use standard indicators, but this script incorporates unique logic.
Signal Tracking: It tracks and displays the last buy and sell signals on the chart. This visual representation can be helpful for traders to see when signals were generated.
Streak Tracking: The script keeps track of winning and losing streaks, which can provide traders with insights into their trading performance over time.
Table Summary: It creates a table summarizing various statistics related to the signals generated, such as total signals, wins, losses, and streaks. This tabular representation can be useful for traders to assess the indicator's performance.
How to Use:
To use this indicator effectively, follow these steps:
Add the Indicator: Copy and paste the script into TradingView's Pine Script editor. Then, apply the indicator to the chart.
Customize Parameters: Adjust the RSI parameters (period, overbought, and oversold levels) and the minimum bars between signals according to your trading strategy and preferences.
Interpret Signals: Buy signals are generated when the RSI crosses above the oversold level, and sell signals occur when it crosses below the overbought level.
Analyze Streaks: Keep an eye on the win and loss streaks to assess the indicator's performance and your trading strategy.
Review Table: The table at the top-right corner of the chart provides a summary of important statistics related to signals, wins, losses, and streaks.
Markets and Conditions:
The script can be used in various financial markets, including stocks, forex, commodities, and indices. However, it's important to note that binary options trading has a distinct risk profile and is available on certain platforms. Therefore, you should ensure that your chosen binary options platform supports TradingView indicators and that you understand the specific conditions of binary options trading.
Conditions for Use:
This indicator is designed for traders who prefer short-term trading, as it uses a 1-minute timeframe.
It assumes that RSI crossovers of overbought and oversold levels can be used to generate binary options signals.
Users should backtest and evaluate the indicator's performance in different market conditions and consider risk management strategies.
Please exercise caution when using any trading indicator or strategy, especially in binary options trading, as it involves a high level of risk, and you may lose your entire investment. It's advisable to thoroughly test any strategy on a demo account before trading with real funds and to seek the advice of a qualified financial advisor if you are unsure about your trading decisions.

Multiple Ticker Stochastic RSIThe Stochastic RSI is a technical indicator ranging between 0 and 100, based on applying the Stochastic oscillator formula to a set of relative strength index (RSI). Unlike the original Stochastic RSI indicator, this allows you to define up to two additional tickers for which all three will be averaged and outputted visually looking like a standard Stochastic RSI indicator. Potential buy and sell visuals are included, as well as alerts. Please note that this indicator is not meant to be used by itself.
