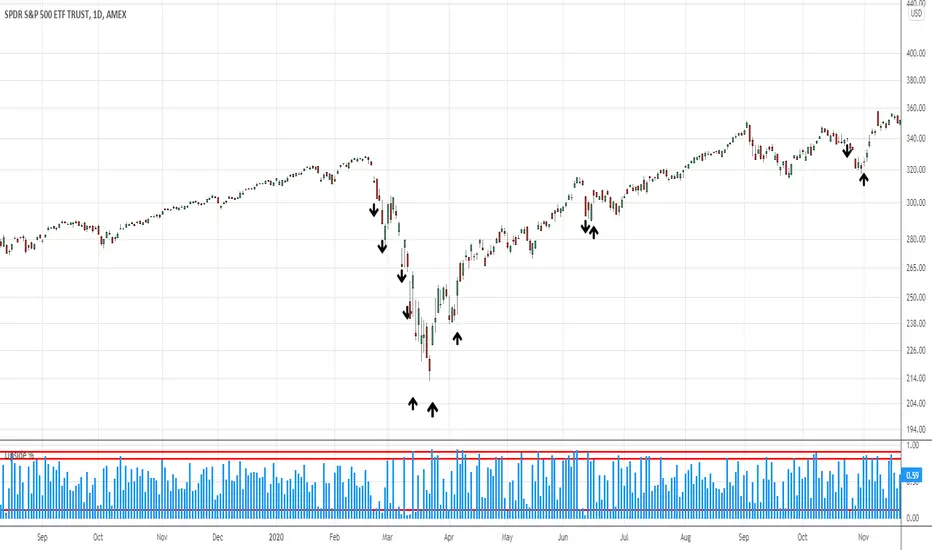
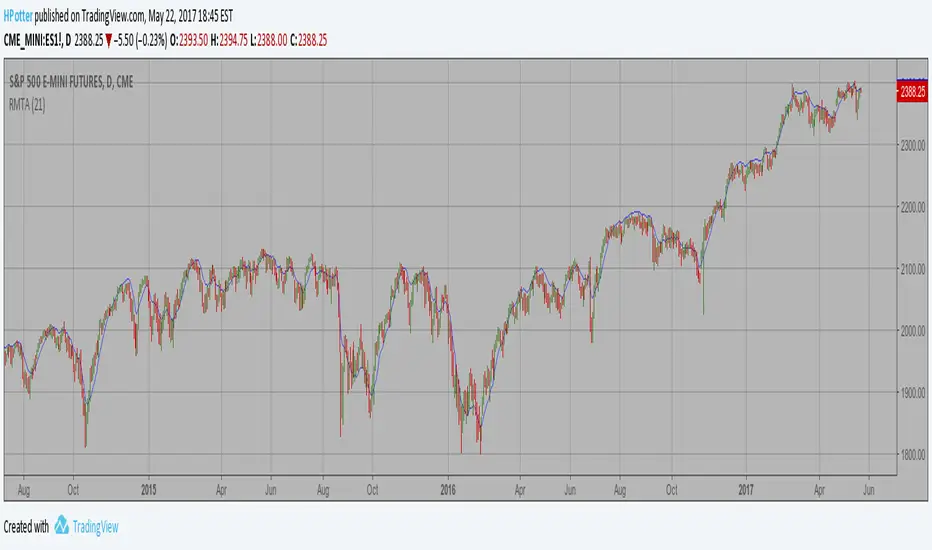
UpVol/TVol NYSE Lowry Upside DaysTakes Tradingviews Upside Volume for NYSE and divides it by Total Volume on NYSE.
Tradingview's data source generally has different volume figures than say the Wall Street Journal. Therefore, this indicator is an estimate.
10% upside volume shows extreme panic and is consistent with market sell offs.
90% upside days, following a decline, are often occur within a week or so of significant market bottoms.
Recommend using columns as the plot type.
Based on research of LowryResearch Corp.
חפש סקריפטים עבור "TAKE"

Average True Range Pivot(2) High and ATR tick colorsTakes original colored ATR tick code from Autarch_Capital and adds pivot (2) high. In image the green upticks are thickened to make them easier to see. Can change in settings.


Opening Range Breakout (15 mins Range)Take the guesswork out of your trading with the Opening Range Breakout Pro script. This tool automatically marks the high and low of the first 15 minutes of the NYSE session, then highlights the first candle to break out above or below this range—removing ambiguity from your trade entries.
The opening range is one of the most powerful concepts in day trading. By identifying the price range set during the market’s first minutes, you gain a clear framework for your trades. When price breaks out above the range, it often signals a strong bullish move; a break below signals bearish momentum. This script visually marks these moments, so you can react quickly and confidently.
Why use Opening Range Breakout Pro?
• Defined Entry and Exit Points: The script gives you clear, objective breakout levels—no more guessing when to enter a trade.
• Removes Emotional Trading: With visual cues for breakouts, you can follow a systematic approach and avoid hesitation or FOMO.
• Backtested, Time-Tested Strategy: The opening range breakout has been used by professional traders for decades to capture early trends and maximize profit potential.
• High Reward Potential: By capitalizing on the volatility and momentum of the opening session, traders often catch the best moves of the day.
• Easy to Use: Just add to your chart—no configuration needed. The script works on any NYSE stock, on a 5-minute chart.
How it works:
• Draws the opening 15-minute high and low as orange lines.
• Labels the range prices for quick reference.
• Marks the first candle to close above the range with an orange ▲, and the first to close below with an orange ▼.
Take control of your trading day, remove uncertainty, and trade with confidence—just like the pros.

Log Distance From MA + RibbonTaken inspiration from @dkncrypto from his "Percentage Distance from MA" indicator.
I did a couple of very simple modifications.
I added exotic calculations so that it works properly in charts that reach the zero value (like the yield curve).
I also added a ribbon. It is now clearer when price is under resistance when compared to the deviation of it's trend.
The standard price ribbon describes support/resistance levels based on absolute vertical price distance.
The ribbon on the indicator I built describes support/resistance levels based around the trend of the price.
One could couple it with the KST-Based MACD indicator I built.
In my future analyses, I will consider skipping the standard price ribbon and consult the Distance-From-MA ribbon.
Tread lightly, for this is hallowed ground.
-Father Grigori

Quick and Simple - WPR+RSI+CCITake a look.
Couple of confluencial reversal signals from popular indicators (W%R, RSI & CCI). I can only say this shows how random the "stanard tools" are and how the market makers "play" these kind of tools to their advantage.
That said. It's better tha average, but not top-class, so expect to have to take signals with other confluence. DON'T take the plots or signals as buy / sell signals, they are just confluencial movements from these indicators based on how they should be "traditionally" used. Instead, use it as a guide as to what other traders may be thinking, or as a pull-back identifier.
Included 100 period ema as basic trend filter.
Not my normal type of script + been away for some time so be kind, lol :)
You might find it useful however so sharing.
More stuff to follow :)

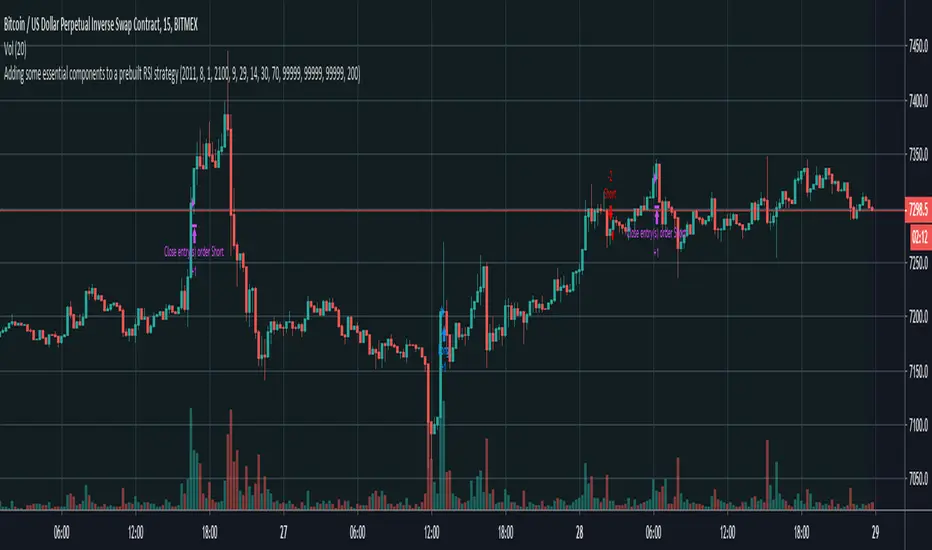
Adding some essential components to a prebuilt RSI strategy v4Taken from and just updated to compile in version 4. Added notes for users on where to swap out RSI component with their setup components to signal a long or short position.
SCDTM IndexTaken from Brian Beamish's IWBADT and DI scripts/concepts. A bullish reading of 3 means the 3 time frames are in agreement. Green is Bullish and Red is Bearish. In the future i'll be adding inputs to adjust the default 9/18EMA parameters as well as giving the user ability to adjust the 3 time frames from the defaults of Daily, 4Hr, and 1HR.

KAMATaken an existing strategy and converted into a study + added the Buy/ Sell arrow.
I will update this submission and give proper credit once I find the original owner. Enjoy.

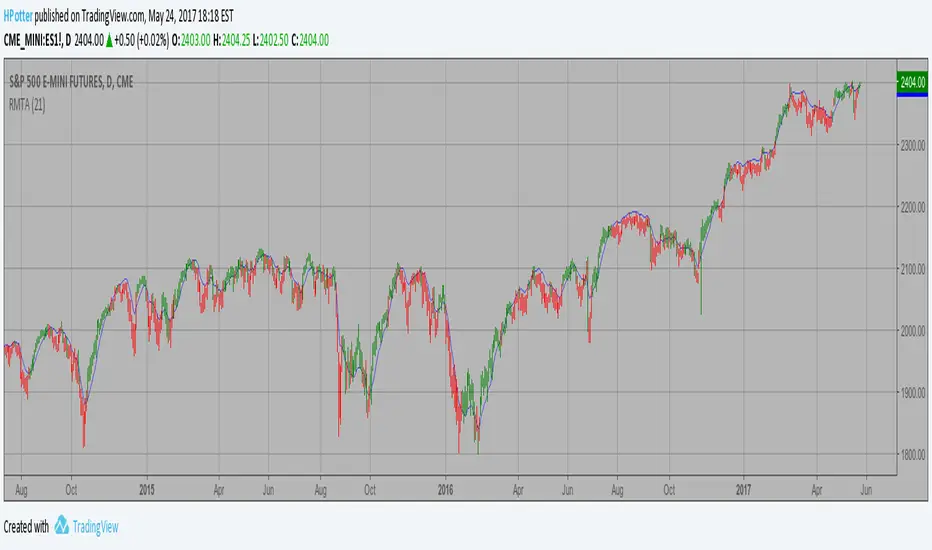
Recursive Moving Trend Average Taken from an article "The Yen Recused" in the December 1998 issue of TASC,
written by Dennis Meyers. He describes the Recursive MA in mathematical terms
as "recursive polynomial fit, a technique that uses a small number of past values
of the estimated price and today's price to predict tomorrows price."
Red bars color - short position. Green is long.
You can change long to short in the Input Settings
Please, use it only for learning or paper trading. Do not for real trading.

Recursive Moving Trend Average Strategy Taken from an article "The Yen Recused" in the December 1998 issue of TASC,
written by Dennis Meyers. He describes the Recursive MA in mathematical terms
as "recursive polynomial fit, a technique that uses a small number of past values
of the estimated price and today's price to predict tomorrows price."
Red bars color - short position. Green is long.
Recursive Moving Trend Average Taken from an article "The Yen Recused" in the December 1998 issue of TASC,
written by Dennis Meyers. He describes the Recursive MA in mathematical terms
as "recursive polynomial fit, a technique that uses a small number of past values
of the estimated price and today's price to predict tomorrows price."
Moving Average Exponential 21 & 55 CloudTake the trade after price goes into the cloud and comes back.

📋 Trading Checklist – Precision Entry SystemTake your trading discipline to the next level with this Precision Trading Checklist for TradingView. Designed for intraday traders following liquidity, structure, and Smart Money Concepts (SMC) AKA ICT Concepts, this overlay ensures you never miss a key confirmation before entering a trade.
Features:
✅ Pre-Market Preparation: Track previous session highs/lows, AM/PM sessions, and key liquidity zones.
✅ Bias & Narrative Check: Quickly confirm daily trend, price position relative to daily open, and higher timeframe confluence.
✅ Session-Specific Rules: Focused sessions like Silver Bullet (10:00–11:30), Afternoon (13:30–15:00), and Final Hour (15:00–16:00).
✅ Structure & Setup Validation: Confirm liquidity sweeps, market structure shifts, expansion candles, fair value gaps, and order blocks.
✅ Risk Management Reminders: Stop-loss, target points, risk percentage, breakeven management, and pyramiding rules.
✅ Post-Trade Journaling: Document entries, session, setup type, trade outcome, and grading for continuous improvement.
✅ Golden Rules: Visual reminders to enforce discipline, avoid emotional trades, and respect session limits.
Why Use It:
This checklist is perfect for traders who want to stay consistent, minimise mistakes, and follow a disciplined routine. Displayed as an overlay on your chart, it provides all essential checks in one glance, keeping you focused on the setup rather than scrolling through notes or separate trackers.
How to use:
Add the indicator to your chart
Click the settings/gear icon
Check off items as you complete them
The checklist on your chart updates in real-time with green checkmarks!
The checkboxes will persist as long as the indicator is on your chart,
making it perfect for tracking your pre-trade and post-trade routines!
Follow the checklist items step by step before entering trades.
Use the session-specific guidelines to filter setups.
Journal your trades post-execution for growth and analysis.

Kalman Step Signals [AlgoAlpha]Take your trading to the next level with the Kalman Step Signals indicator by AlgoAlpha! This advanced tool combines the power of Kalman Filtering and the Supertrend indicator, offering a unique perspective on market trends and price movements. Designed for traders who seek clarity and precision in identifying trend shifts and potential trade entries, this indicator is packed with customizable features to suit your trading style.
Key Features
🔍 Kalman Filter Smoothing : Dynamically smooths price data with user-defined parameters for Alpha, Beta, and Period, optimizing responsiveness and trend clarity.
📊 Supertrend Overlay : Incorporates a classic Supertrend indicator to provide clear visual cues for trend direction and potential reversals.
🎨 Customizable Appearance : Adjust colors for bullish and bearish trends, along with optional exit bands for more nuanced analysis.
🔔 Smart Alerts : Detect key moments like trend changes or rejection entries for timely trading decisions.
📈 Advanced Visualization : Includes optional entry signals, exit bands, and rejection markers to pinpoint optimal trading opportunities.
How to Use
Add the Indicator : Add the script to your TradingView favorites. Customize inputs like Kalman parameters (Alpha, Beta, Period) and Supertrend settings (Factor, ATR Period) based on your trading strategy.
Interpret the Signals : Watch for trend direction changes using Supertrend lines and directional markers. Utilize rejection entries to identify price rejections at trendlines for precision entry points.
Set Alerts : Enable the built-in alert conditions for trend changes or rejection entries to act swiftly on trading opportunities without constant chart monitoring.
How It Works
The indicator leverages a Kalman Filter to smooth raw price data, balancing responsiveness and noise reduction using user-controlled parameters. This refined price data is then fed into a Supertrend calculation, combining ATR-based volatility analysis with dynamic upper and lower bands. The result is a clear and reliable trend-detection system. Additionally, it features rejection markers for bullish and bearish reversals when prices reject the trendline, along with exit bands to visualize potential price targets. The integration of customizable alerts ensures traders never miss critical market moves.
Add the Kalman Step Signals to your TradingView charts today and enjoy a smarter, more efficient trading experience! 🚀🌟

EMA clouds Elle 4,5/8,21/34,50Take Entry close to 10 min 4/5 EMA ONLY
Daily 20/21 EMA is great pivot for bullish/bearish trend change, specially bounces!


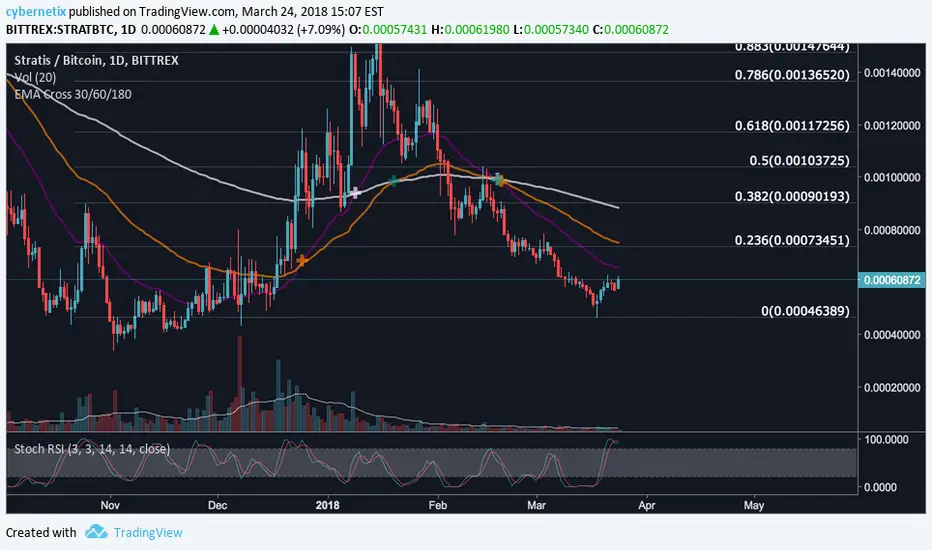
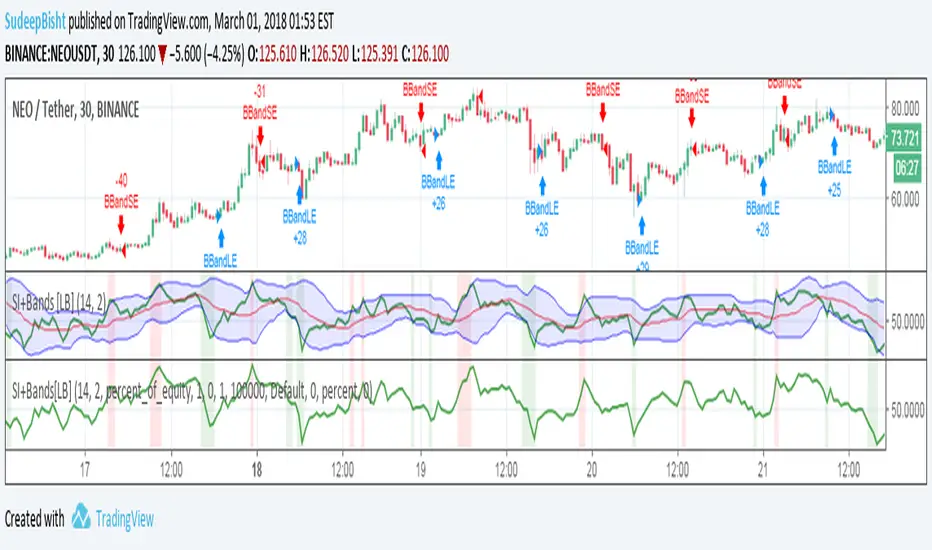
SB_RSI/MFI with Volatility Version 1.0Take on LazyBear's SB_RSI/MFI with Volatility Indicator.
The original indicator is coupled with the Bollinger Band strategy.
Original Idea:
Wanted to test the indicator with bbstrategy.
Message if you think of any modifications/ enhancements/ any opportunities. :)
Donations/Tips... :) -
BTC: 1BjswGcRR6c23pka7qh5t5k56j46cuyyy2
ETH: 0x64fed71c9d6c931639c7ba4671aeb6b05e6b3781
LTC: LKT2ykQ8QSzzfTDB6Tnsf12xwYPjgq95h4

Responsive ADX (RADX)Introducing the new Responsive ADX (RADX), running with a (length = 9) and exactly how it differs from the standard built-in ADX you see on TradingView chart.
This indicator is still a true ADX at its core — it measures trend strength from 0 to 100 and uses the classic +DI and –DI lines to show direction — but it has been carefully "tuned" to react noticeably faster while staying smooth and usable. With the length set to 9, it is one of the most responsive versions you can run without turning into noise.
How it behaves differently from the normal (Wilder) ADX
Normal ADX is lagging, now this version gives you the same trend-strength reading 4–8 bars earlier than the built-in ADX. On a daily chart that can easily be 4–8 calendar days of earlier warning. On a 4-hour chart it’s 16–32 hours earlier. That head-start is the whole point.
The ADX line rises and falls much quicker.
When a new trend actually starts, you will often see this Fast ADX cross above 18–20 while the built-in ADX is still sleeping below 15. Conversely, when a trend dies, this version drops faster, so you’re not left holding a dead trade for an extra week.
The +DI and –DI lines are almost identical to the original, but lightly smoothed with a 5-period EMA (you can turn this off). This makes the DI crossovers cleaner and reduces whipsaws without adding meaningful lag.
The final ADX smoothing uses a lightweight Hull-style technique instead of Wilder’s very slow RMA. This is the main “secret sauce” that removes roughly half the lag while keeping the line smooth and readable.
Values are realistic and tradable.
With length 9 you will typically see:
– 0–18 = flat / chop
– 15–20 = emerging trend (background starts colouring)
– 20–50 = strong trend (most people take this as confirmation)
– above 50–60 only in very powerful moves (same as normal ADX)
The aqua / purple background only appears when both conditions are met: the correct DI is on top and Fast ADX is above your chosen “weak-to-trending” level (default 18).
This prevents the background from flashing on and off in sideways markets — exactly the same logic you liked in the original Trinity ADX, but now much earlier.
In very simple terms
Think of the normal built-in ADX as a diesel truck — reliable but slow to accelerate and slow to stop. Fast Responsive ADX with length 9 is the same truck with a turbocharger — same destination and same load capacity, but it gets up to speed twice as fast and brakes earlier when the road turns.
We would recommend people who switch to this version keep the (length 9–12) because the edge in timing is obvious on the chart.
That’s it — this is a new more responsive version, still-logical ADX!

JSONWebhooksLibrary "JSONWebhooks"
TODO: add library description here
method buildWebhookJson(msg, constants)
Builds the final JSON payload from a webhookMessage type.
Namespace types: webhookMessage
Parameters:
msg (webhookMessage) : (webhookMessage) A prepared webhookMessage.
constants (CONSTANTS)
Returns: A JSON Payload.
method buildTakeProfitJson(msg)
Builds the takeProfit JSON message to be used in a webhook message.
Namespace types: takeProfitMessage
Parameters:
msg (takeProfitMessage) : (takeProfitMessage)
Returns: A JSON takeProfit payload.
method buildStopLossJson(msg, constants)
Builds the stopLoss JSON message to be used in a webhook message.
Namespace types: stopLossMessage
Parameters:
msg (stopLossMessage) : (stopLossMessage)
constants (CONSTANTS)
Returns: A JSON stopLoss payload.
CONSTANTS
Constants for payload values.
Fields:
ACTION_BUY (series string)
ACTION_SELL (series string)
ACTION_EXIT (series string)
ACTION_CANCEL (series string)
ACTION_ADD (series string)
SENTIMENT_BULLISH (series string)
SENTIMENT_BEARISH (series string)
SENTIMENT_LONG (series string)
SENTIMENT_SHORT (series string)
SENTIMENT_FLAT (series string)
STOP_LOSS_TYPE_STOP (series string)
STOP_LOSS_TYPE_STOP_LIMIT (series string)
STOP_LOSS_TYPE_TRAILING_STOP (series string)
webhookMessage
Final webhook message.
Fields:
ticker (series string)
action (series string)
sentiment (series string)
price (series float)
quantity (series float)
takeProfit (series string)
stopLoss (series float)
takeProfitMessage
Take profit message.
Fields:
limitPrice (series float)
percent (series float)
amount (series float)
stopLossMessage
Stop loss message.
Fields:
type (series string)
percent (series float)
amount (series float)
stopPrice (series float)
limitPrice (series float)
trailPrice (series float)
trailPercent (series float)
