ATR Trailing StopATR Trailing Stop (Dynamic Volatility Regimes)
==============================================
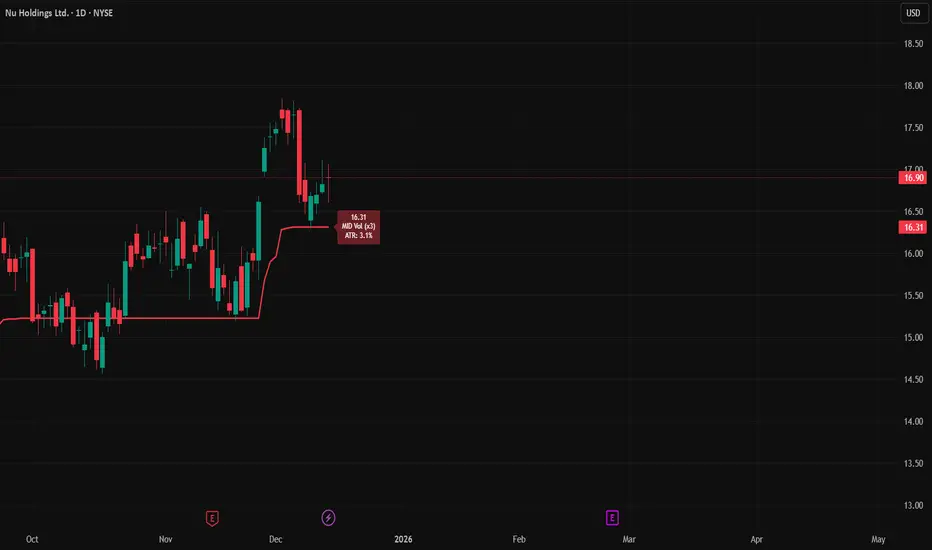
This indicator implements an adaptive ATR-based trailing stop for long positions. The stop automatically adjusts based on stock volatility, tightening during fast movements and widening during calm periods. It is designed as a trade management tool to help protect profits while staying aligned with strong trends.
How It Works
------------
* Tracks the highest high over a configurable lookback window and ensures this “top” never moves downward.
* Computes the trailing stop as:**Top – ATR × Dynamic Multiplier**
* The ATR multiplier changes depending on volatility:
* Low volatility → Wide stop (slower trailing)
* Medium volatility → Standard trailing
* High volatility → Tight stop (faster trailing)
* The trailing stop only moves upward; it never decreases.
* If price falls significantly below the stop (default: 5%), the system resets and begins trailing from a new top.
* An optional price-scale label displays:
* Current stop value
* Volatility regime (LOW / MID / HIGH)
* ATR percentage and active multiplier
Alerts
------
Two alert conditions are included:
### Trailing Stop – Near
Triggers when price moves within a user-defined percentage above the stop.
### Trailing Stop – Hit
Triggers when price touches or closes below the stop.
How to Use
----------
1. Add the indicator to any chart (daily timeframe recommended).
2. Configure:
* ATR length
* Lookback bars
* Volatility thresholds
* ATR multipliers
3. Set alerts for early warnings or stop-hit events.
4. Use the stop line as a dynamic risk-management tool to guide exit decisions and protect profits.
Notes
-----
* Designed for long-only trailing logic.
* This indicator does not generate entry signals; it is intended for stop management.
חפש סקריפטים עבור "Trailing stop"
ATR Trailing Stop by GideonMATR Trailing Stop Indicator
This ATR Trailing Stop Indicator is designed for traders who wish to enhance their exit strategies by leveraging volatility-based stops. It offers a systematic approach to trend management and risk control, enabling traders to capture extended trends while protecting their capital during market reversals. Works on Indian Indices as well.
Overview:
The ATR Trailing Stop indicator is a dynamic trend-following tool that adjusts stop levels based on market volatility. By incorporating the Average True Range (ATR), the indicator provides a flexible exit strategy that adapts to changing market conditions, helping traders lock in profits during trends and limit losses during reversals.
How It Works:
True Range and ATR Calculation:
The indicator first calculates the True Range (TR) for each bar, defined as the maximum of:
The difference between the high and low,
The absolute difference between the high and the previous close, and
The absolute difference between the low and the previous close.
Using the TR values, the ATR is computed over a user-defined period (default is 14 bars) with an option to use either a Simple Moving Average (SMA) or an Exponential Moving Average (EMA) as the smoothing method.
Trailing Stop Determination:
Two potential stop levels are calculated:
For an uptrend, the stop is determined as:
Stop = Close – (Multiplier × ATR)
For a downtrend, the stop is:
Stop = Close + (Multiplier × ATR)
The indicator maintains a persistent trailing stop that dynamically adjusts:
In an uptrend, the trailing stop only moves upward (or remains flat) to secure gains.
In a downtrend, it only moves downward, thereby protecting the position from excessive losses.
A reversal in trend is identified when the price crosses the trailing stop level, at which point the indicator flips the trend and resets the stop level accordingly.
Rationale:
Utilizing the ATR for trailing stops ensures that the stop levels are directly influenced by market volatility. This dynamic adjustment helps accommodate the natural price fluctuations of the market, providing a more adaptive risk management tool compared to fixed stop-loss levels. The approach is particularly useful in volatile markets where traditional static stops might be triggered prematurely.
Customization:
Key parameters that can be adjusted include:
ATR Period: The number of bars used to calculate the ATR.
ATR Multiplier: The factor that determines how far the trailing stop is set from the current price.
Smoothing Method: Option to choose between SMA and EMA for ATR calculation, allowing traders to tailor the sensitivity of the indicator to their specific trading style.

Market Structure Trailing Stop [BigBeluga]The Market Structure Trailing Stop indicator is an advanced tool for identifying market structure shifts, liquidity sweeps, and potential trend reversals using comprehensive volume analysis. This indicator combines the analysis of market structure pivots (CHoCH - Change of Character) with a sophisticated volume-based trailing stop logic. By evaluating delta volume at key structural points, it allows traders to identify high-probability trend continuations or reversals and manage their trades more effectively.
🔵 KEY FEATURES
● Market Structure Analysis
Pivot-Based Market Structure : The indicator identifies high and lows using user-defined periods, allowing traders to spot key market structure shifts.
Change of Character (CHoCH) : The first significant break of a market structure is marked as a CHoCH, indicating a potential trend reversal.
Break of Structure (BoS) : The indicator highlights subsequent breaks of structure after CHoCH, providing traders with crucial insights into trend strength.
● Advanced Volume Analysis
Delta Volume Evaluation : The indicator calculates delta volume (difference between up and down volume) at each ChoCh or BoS market structure point to assess the strength of the move. Identify Delta Volume from break point back to Pivot
● Trailing Stop Logic
Volume-Validated Trailing Stop : The indicator automatically plots a trailing stop if the delta volume at the UP CHoCH is positive and above the defined threshold and vice versa for Down CHoCH , allowing traders to protect their profits while riding the trend.
Trend Weakness Detection : If a subsequent BoS occurs with negative delta volume or lower volume than the input threshold, the trailing stop disappears, indicating potential trend exhaustion or reversal.
Dynamic Stop Placement : The trailing stop is dynamically adjusted based on market structure and volume, providing traders with a more adaptive stop-loss strategy.
Up Trend Trailing Stop:
Down Trend Trailing Stop:
● Liquidity Sweep Detection
Liquidity Sweep (X) Labels : The indicator identifies liquidity sweeps—points where the price temporarily reverses to sweep liquidity above or below a key level—marked with an “X” label.
Potential Reversal Zones : These liquidity sweeps are potential reversal zones, especially when accompanied by significant delta volume changes, providing traders with early warnings of potential trend reversals.
🔵 HOW TO USE
● Identifying Market Structure Shifts
Change of Character (CHoCH) : When a CHoCH occurs, the indicator calculates the total volume from the high point to the break point. If the delta volume is positive and exceeds the input threshold, a trailing stop is plotted, signaling potential trend continuation.
Break of Structure (BoS) : If BoS is enabled, subsequent breaks of structure are highlighted. If these BoS points show weaker volume or negative delta volume, the trailing stop will disappear, indicating that the trend may be losing strength.
● Using the Trailing Stop Feature
Protecting Profits : Once a CHoCH occurs and the delta volume validates the trend, the trailing stop will be plotted below (or above) the price to protect profits while allowing the trend to run.
Trend Reversal Signals : If the trailing stop disappears due to weak volume at subsequent BoS points, it may signal that the trend is losing momentum, and traders may consider closing their positions or tightening their stops manually.
● Liquidity Sweep Interpretation
Spotting Reversal Zones : Liquidity sweeps, marked with an “X” label, indicate zones where the price has swept liquidity. These areas can serve as potential reversal zones, especially when significant delta volume is observed at these points.
Early Reversal Warnings : Traders can use these liquidity sweep labels as early warnings for potential trend reversals, particularly in conjunction with other technical analysis methods.
🔵 CUSTOMIZATION
Highs and Lows Calculation : Customize the number of bars to the left and right for identifying pivots and market structure shifts.
Volume Threshold : Define the volume threshold to filter out weaker moves and focus on significant market structure shifts.
BoS and Liquidity Sweep Labels : Toggle on or off the BoS and Liquidity Sweep labels to tailor the indicator to your trading style.
Trend Color : Enable or disable trend coloring for candles to visually highlight uptrends and downtrends on the chart.
🔵 CONCLUSION
The Market Structure Trailing Stop indicator combines advanced volume analysis with market structure detection to provide traders with a powerful tool for identifying and managing trends. By leveraging delta volume at key structure points, it helps traders validate trend strength and manage their positions with a dynamic trailing stop strategy. The addition of liquidity sweep detection further enhances its utility, offering early warnings of potential trend reversals. This indicator is ideal for traders who want to gain a deeper understanding of market structure while incorporating volume-based insights into their trading strategies.

[INVX] Trailing StopDescription:
The Adjustable Trailing Stop Indicator is a practical tool designed to enhance your trading strategy by allowing for automatic modifications of stop-loss orders according to your specified parameters. This indicator provides a dynamic alternative to the traditional static stop-loss orders, assisting in managing your potential profits and curbing possible losses.
Features and Functionality:
The Trailing Stop Indicator provides three main inputs for customization:
"Trailing Stop Start Date" : This input enables you to set the start date for the trailing stop. From this date forward, the indicator begins tracking price changes and adjusts the stop-loss order in response.
"Trigger Delta (%)" : This represents the percentage for the trailing stop. It denotes the set percentage at which the stop order adjusts.
"Order" : This input determines whether the trailing stop applies to a Buy or Sell order. Depending on the selection, the indicator adjusts the stop price as the price escalates (for Sell order) or declines (for Buy order).
How Does the Trailing Stop Indicator Work?
The Trailing Stop Indicator functions by dynamically adjusting the stop price in line with market fluctuations. If the market price rises (for Sell order), the stop price automatically ascends, securing potential profits. In a declining market (for Buy order), the stop price descends according to the market.
This indicator eliminates the need for constant manual adjustments, reducing the impact of emotional trading and helping traders maintain their risk management strategy. By using this tool, traders can implement a more disciplined and systematic approach to trading.

Adaptive Trailing StopIntroduction
The ability to adapt to possible markets states is important in technical analysis, this is why making adaptive indicator might help get better results. I propose a trailing stop indicator using recursion that can adapt to the efficiency ratio. I have added alerts since it's a often requested feature.
The Indicator
Its quite classical, bands are firstly made then a trailing stop is built around them. The bands are recursive, this allow for faster calculations in general but it also allow for a faster adaptivity. An higher length or factor will make the indicator detect longer term trends, factor determine the raising power of the efficiency ratio.
When smooth is checked the trailing stop will appear smoother.
When adaptive is unchecked the indicator will still act as a trailing stop but might be more affected to ranging markets.
Set a static/trailing stop loss :
You can set your stop loss based on the indicator, a static stop loss can be set at the value of the trailing stop when you enter the market. You can also set it as trailing stop, the indicator will follow the trend thus allowing for potential profits to grow's.
Determine The Trend Direction :
You can generate buy sell signals based on the indicator position relative to the price, when the indicator is lower than the price this indicate a up trending market, when the indicator is higher than the price this indicate a down trending market. If the trailing stop move this indicate a strong current trend.
False signals with trailing stops can happen, the price might go toward the trailing stop making it generate another signal, when market is ranging and exhibiting cyclical behaviour this can affect the indicator and the user might get stuck in a series of false signals, higher length/factor values can fix that at the cost of less early signals.
Identification Of Support And Resistance
Bands during low volatility/ranging markets can return potential reversal points when crossing with the price. The indicator can also do it, even if high/low crosses are better suited to determine support and resistance levels when using a trailing stop. You can use support/resistance identification in conjonction of the current trend detected by the indicator.
Conclusion
The indicator is fully operational in fixed mode while having potential down points in adaptive mode. As you can see the code that return the bands is fully recursive and might provide a great way to create adaptive bands in the future.
I have been asked to give more detail about the indicator uses rather than the construction, i hope the showcased uses are convenient.
Note that the showcased uses can be applied to any trailing stop.
Thanks for reading.

SUPERTREND ATR WITH TRAILING STOP LOSS## THIS SCRIPT IS ON GITHUB
## MORE BACKTEST
SuperTrend is a moving stop and reversal line based on the volatility (ATR).
The strategy will ride up your stop loss when price moviment 1%.
The strategy will close your operation when the market price crossed the stop loss.
The strategy will close operation when the line based on the volatility will crossed
The strategy has the following parameters:
+ **ATR PERIOD** - To select number of bars back to execute calculation
+ **ATR MULTPLIER** - To add a multplier factor on volatility
+ **INITIAL STOP LOSS** - Where can isert the value to first stop.
+ **POSITION TYPE** - Where can to select trade position.
+ **BACKTEST PERIOD** - To select range.
## DISCLAIMER
1. I am not licensed financial advisors or broker dealers. I do not tell you when or what to buy or sell. I developed this software which enables you execute manual or automated trades multiple trades using TradingView. The software allows you to set the criteria you want for entering and exiting trades.
2. Do not trade with money you cannot afford to lose.
3. I do not guarantee consistent profits or that anyone can make money with no effort. And I am not selling the holy grail.
4. Every system can have winning and losing streaks.
5. Money management plays a large role in the results of your trading. For example: lot size, account size, broker leverage, and broker margin call rules all have an effect on results. Also, your Take Profit and Stop Loss settings for individual pair trades and for overall account equity have a major impact on results. If you are new to trading and do not understand these items, then I recommend you seek education materials to further your knowledge.
**YOU NEED TO FIND AND USE THE TRADING SYSTEM THAT WORKS BEST FOR YOU AND YOUR TRADING TOLERANCE.**
**I HAVE PROVIDED NOTHING MORE THAN A TOOL WITH OPTIONS FOR YOU TO TRADE WITH THIS PROGRAM ON TRADINGVIEW.**
## NOTE
I accept suggestions to improve the script.
If you encounter any problems i will be happy to share with me.
+ Authors: @exit490
+ Revision: v1.0.0
+ Date: 5-Aug-2019
+ Pinescript version: 4
## LICENSE
Copyright 2019 Mauricio Pimenta / exit490
SuperTrend with Trailing Stop Loss script may be freely distributed under the (../LICENSE).

ATR Trailing Stop (Long or Short Selectable)The ATR Trailing Stop (Long or Short Selectable) will start calculating on a set date that you specify. This is great because you want to trail the price from the breakout day or even after exceeding specific price level (can be your breakeven level or even to capture more of the upside after the price target is met).
Entry price: If you act at the close of the day, you can leave this value as 0 and it will take the close of the day for the initial protective stop-loss calculation. You can choose to add a value such as the pattern boundary and in that case it will subtract the initial protective stop-loss from the pattern boundary and not the close of the day. If you use a scaling in tactic during the day (buying in tranches intraday as the breakout takes place) and your average purchase price is different than the close of the day, you can also plug that number in to calculate the initial protective stop-loss.
This is a modified version as many followers asked for ATR trailing for short setups. Now you can select the Long/Short trade setup from the drop down menu.
ATR period: You can select the ATR period. It can be 10 day, 14 day or 30 day or any ATR period of your choice.
ATR Multiplier for Stop-loss: This is the multiplier that you want to trail the price with. From the highest level price reached it will trail the price with a 3 x ATR () distance. The higher the number, the wider the trailing stop-loss. A multiplier of 1 will trail the price so close that and adverse movement can result in triggering the stop-loss.
Custom Value for First day Trailing Stop: This is my favorite part. For aggressive risk management, your initial protective stop can be smaller than what the ATR Trailing Stop will use in its calculation after entry day. In this case you can take 1xATR () or even with FX and Futures you can apply 0.5xATR() as the first day to calculate initial protective stop. The protective stop turns into a trailing stop after the first day.
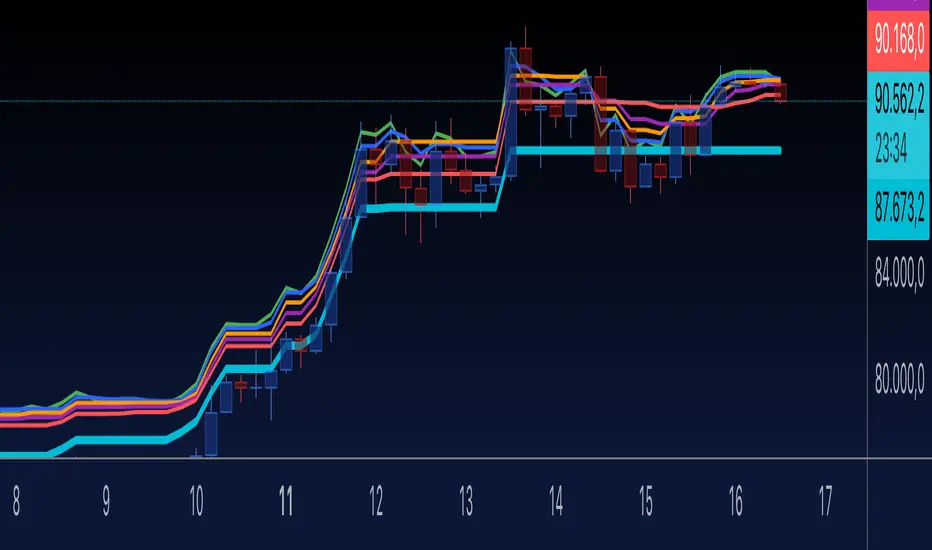
Heatmap Trailing Stop with Breakouts (Zeiierman)█ Overview
Heatmap Trailing Stop with Breakouts (Zeiierman) is a trend and breakout detection tool that combines dynamic trailing stop logic, Fibonacci-based levels, and a real-time market heatmap into a single, intuitive system.
This indicator is designed to help traders visualize pressure zones, manage stop placement, and identify breakout opportunities supported by contextual price–derived heat. Whether you're trailing trends, detecting reversals, or entering on explosive breakouts — this tool keeps you anchored in structure and sentiment.
It projects adaptive trailing stop levels and calculates Fibonacci extensions from swing-based extremes. These levels are then colored by a market heatmap engine that tracks price interaction intensity — showing where the market is "hot" and likely to respond.
On top of that, it includes breakout signals powered by HTF momentum conditions, trend direction, and heatmap validation — giving you signals only when the context is strong.
█ How It Works
⚪ Trailing Stop Engine
At its core, the script uses an ATR-based trailing stop with trend detection:
ATR Length – Defines volatility smoothing using EMA MA of true range.
Multiplier – Expands/retracts the trailing offset depending on market aggression.
Real-Time Extremum Tracking – Uses local highs/lows to define Fibonacci anchors.
⚪ Fibonacci Projection + Heatmap
With each trend shift, Fibonacci levels are projected from the new swing to the current trailing stop. These include:
Fib 61.8, 78.6, 88.6, and 100% (trailing stop) lines
Heatmap Coloring – Each level'slevel's color is determined by how frequently price has interacted with that level in the recent range (defined by ATR).
Strength Score (1–10) – The number of touches per level is normalized and averaged to create a heatmap ""score"" displayed as a colored bar on the chart.
⚪ Breakout Signal System
This engine detects high-confidence breakout signals using a higher timeframe candle structure:
Bullish Breakout – Strong bullish candle + momentum + trend confirmation + heatmap score threshold.
Bearish Breakout – Strong bearish candle + momentum + trend confirmation + heatmap score threshold.
Cooldown Logic – Prevents signals from clustering too frequently during volatile periods.
█ How to Use
⚪ Trend Following & Trail Stops
Use the Trailing Stop line to manage positions or time entries in line with trend direction. Trailing stop flips are highlighted with dot markers.
⚪ Fibonacci Heat Zones
The projected Fibonacci levels serve as price magnets or support/resistance zones. Watch how price reacts at Fib 61.8/78.6/88.6 levels — especially when they're glowing with high heatmap scores (more glow = more historical touches = stronger significance).
⚪ Breakout Signals
Enable breakout signals when you want to trade breakouts only under strong context. Use the "Heatmap Strength Threshold" to require a minimum score (1–10).
█ Settings
Stop Distance ATR Length – ATR period for volatility smoothing
Stop Distance Multiplier – Adjusts the trailing stop'sstop's distance from price
Heatmap Range ATR Length – Defines how far back the heatmap scans for touches
Number of Heat Levels – Total levels used in the heatmap (more = finer resolution)
Minimum Touches per Level – Defines what counts as a ""hot"" level
Heatmap Strength Threshold – Minimum average heat score (1–10) required for breakouts
Timeframe – HTF source used to evaluate breakout momentum structure
-----------------
Disclaimer
The content provided in my scripts, indicators, ideas, algorithms, and systems is for educational and informational purposes only. It does not constitute financial advice, investment recommendations, or a solicitation to buy or sell any financial instruments. I will not accept liability for any loss or damage, including without limitation any loss of profit, which may arise directly or indirectly from the use of or reliance on such information.
All investments involve risk, and the past performance of a security, industry, sector, market, financial product, trading strategy, backtest, or individual's trading does not guarantee future results or returns. Investors are fully responsible for any investment decisions they make. Such decisions should be based solely on an evaluation of their financial circumstances, investment objectives, risk tolerance, and liquidity needs.

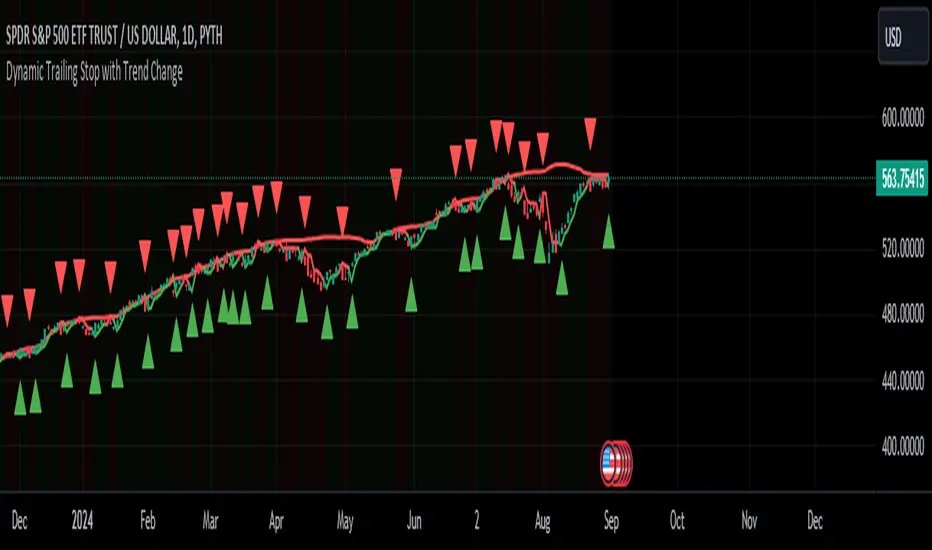
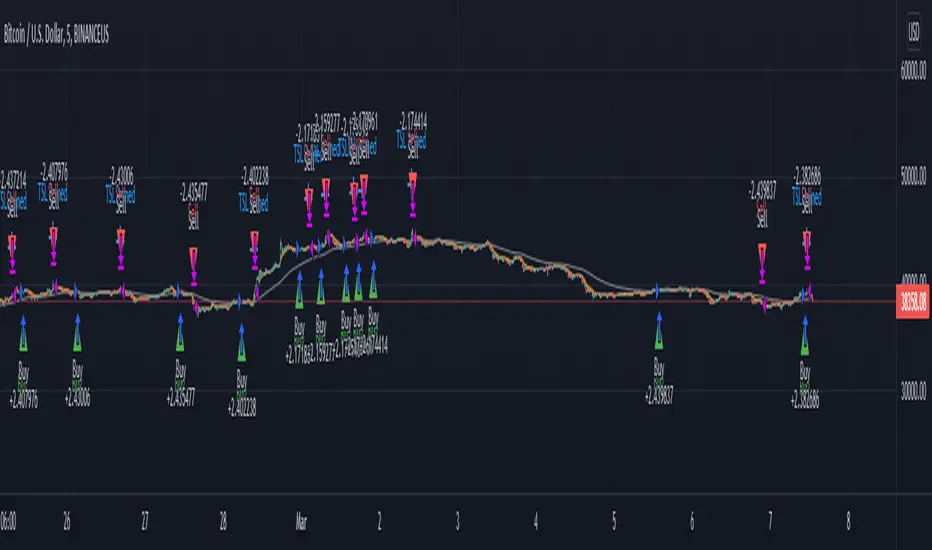
Dynamic Trailing Stop with Trend ChangeKey features of this script:
Trend Identification: Uses previous day's high/low breaks to identify trend changes.
Uptrend starts when price closes above the previous day's high.
Downtrend starts when price closes below the previous day's low.
Dynamic Trailing Stop:
In an uptrend, the stop is set to the previous day's low and trails higher.
In a downtrend, the stop is set to the previous day's high and trails lower.
Visual Indicators:
Green triangle for uptrend start, red triangle for downtrend start.
Green/red line for the trailing stop.
Background color changes to light green in uptrends, light red in downtrends.
Alerts:
Trend change alerts when a new trend is identified.
Stop hit alerts when price crosses the trailing stop, suggesting a potential exit.
This implementation allows you to:
Identify trend changes based on previous day's high/low breaks.
Trail your stop loss dynamically as the trend progresses.
Get visual and alert-based signals for trend changes and potential exit points.
For swing trading, you could:
Enter long when an uptrend starts (green triangle).
Set your initial stop loss to the trailing stop (green line).
Exit if the price closes below the trailing stop or a downtrend starts (red triangle).
(Reverse for short trades)
Remember, while this strategy can be effective, it's important to combine it with other forms of analysis and proper risk management. The effectiveness can vary depending on the volatility of the asset and overall market conditions. Always test thoroughly before using in live trading.
Fibonacci-Only StrategyFibonacci-Only Strategy
This script is a custom trading strategy designed for traders who leverage Fibonacci retracement levels to identify potential trade entries and exits. The strategy is versatile, allowing users to trade across multiple timeframes, with built-in options for dynamic stop loss, trailing stops, and take profit levels.
Key Features:
Custom Fibonacci Levels:
This strategy calculates three specific Fibonacci retracement levels: 19%, 82.56%, and the reverse 19% level. These levels are used to identify potential areas of support and resistance where price reversals or breaks might occur.
The Fibonacci levels are calculated based on the highest and lowest prices within a 100-bar period, making them dynamic and responsive to recent market conditions.
Dynamic Entry Conditions:
Touch Entry: The script enters long or short positions when the price touches specific Fibonacci levels and confirms the move with a bullish (for long) or bearish (for short) candle.
Break Entry (Optional): If the "Use Break Strategy" option is enabled, the script can also enter positions when the price breaks through Fibonacci levels, providing more aggressive entry opportunities.
Stop Loss Management:
The script offers flexible stop loss settings. Users can choose between a fixed percentage stop loss or an ATR-based stop loss, which adjusts based on market volatility.
The ATR (Average True Range) stop loss is multiplied by a user-defined factor, allowing for tailored risk management based on market conditions.
Trailing Stop Mechanism:
The script includes an optional trailing stop feature, which adjusts the stop loss level as the market moves in favor of the trade. This helps lock in profits while allowing the trade to run if the trend continues.
The trailing stop is calculated as a percentage of the difference between the entry price and the current market price.
Multiple Take Profit Levels:
The strategy calculates seven take profit levels, each at incremental percentages above (for long trades) or below (for short trades) the entry price. This allows for gradual profit-taking as the market moves in the trade's favor.
Each take profit level can be customized in terms of the percentage of the position to be closed, providing precise control over exit strategies.
Strategy Backtesting and Results:
Realistic Backtesting:
The script has been backtested with realistic account sizes, commission rates, and slippage settings to ensure that the results are applicable to actual trading scenarios.
The backtesting covers various timeframes and markets to ensure the strategy's robustness across different trading environments.
Default Settings:
The script is published with default settings that have been optimized for general use. These settings include a 15-minute timeframe, a 1.0% stop loss, a 2.0 ATR multiplier for stop loss, and a 1.5% trailing stop.
Users can adjust these settings to better fit their specific trading style or the market they are trading.
How It Works:
Long Entry Conditions:
The strategy enters a long position when the price touches the 19% Fibonacci level (from high to low) or the reverse 19% level (from low to high) and confirms the move with a bullish candle.
If the "Use Break Strategy" option is enabled, the script will also enter a long position when the price breaks below the 19% Fibonacci level and then moves back up, confirming the break with a bullish candle.
Short Entry Conditions:
The strategy enters a short position when the price touches the 82.56% Fibonacci level and confirms the move with a bearish candle.
If the "Use Break Strategy" option is enabled, the script will also enter a short position when the price breaks above the 82.56% Fibonacci level and then moves back down, confirming the break with a bearish candle.
Stop Loss and Take Profit Logic:
The stop loss for each trade is calculated based on the selected method (fixed percentage or ATR-based). The strategy then manages the trade by either trailing the stop or taking profit at predefined levels.
The take profit levels are set at increments of 0.5% above or below the entry price, depending on whether the position is long or short. The script gradually exits the trade as these levels are hit, securing profits while minimizing risk.
Usage:
For Fibonacci Traders:
This script is ideal for traders who rely on Fibonacci retracement levels to find potential trade entries and exits. The script automates the process, allowing traders to focus on market analysis and decision-making.
For Trend and Swing Traders:
The strategy's flexibility in handling both touch and break entries makes it suitable for trend-following and swing trading strategies. The multiple take profit levels allow traders to capture profits in trending markets while managing risk.
Important Notes:
Originality: This script uniquely combines Fibonacci retracement levels with dynamic stop loss management and multiple take profit levels. It is not just a combination of existing indicators but a thoughtful integration designed to enhance trading performance.
Disclaimer: Trading involves risk, and it is crucial to test this script in a demo account or through backtesting before applying it to live trading. Users should ensure that the settings align with their individual risk tolerance and trading strategy.

Consistent ATR Trailing Stop (ATR, 1m based) [nn1]This indicator implements a Consistent ATR (Average True Range) Trailing Stop that maintains uniform behavior across various chart timeframes. It's designed to provide traders with a reliable tool for setting dynamic stop-loss levels that adapt to market volatility while remaining consistent regardless of the chosen chart interval.
Key Features:
1. Consistent ATR Calculation: The indicator calculates the ATR based on 1-minute data, regardless of the current chart timeframe. This ensures that the ATR value remains consistent across different intervals (e.g., 10s, 15s, 30s, 60s), providing a stable base for the trailing stop.
2. Dynamic Trailing Stop: The trailing stop adjusts based on the ATR, moving up in uptrends and down in downtrends to protect profits while allowing room for price fluctuations.
3. Trend Detection: The indicator determines the trend based on the price's relationship to the trailing stop, switching between long and short modes as the trend changes.
4. Visual Cues: The trailing stop line changes color to indicate the current trend (green for uptrends, red for downtrends) and briefly turns yellow during trend changes. Small circles below or above the price action further highlight the current trend direction.
5. Information Display: A label shows the current ATR value and trend direction, providing at-a-glance information to the trader.
6. Trend Change Highlights: The background briefly changes color when a trend change occurs, drawing attention to potential trading opportunities or exit points.
Usage:
- ATR Length: Set the number of periods for the ATR calculation. This is based on 1-minute data, so a value of 14 represents 14 minutes of data.
- ATR Multiplier: Adjust how far the trailing stop is placed from the price. Higher values create a wider stop, allowing for more price movement before triggering.
This indicator is particularly useful for traders who:
- Use multiple timeframes in their analysis and want consistent signals across charts.
- Seek a dynamic stop-loss method that adapts to market volatility.
- Want clear visual cues for trend direction and changes.
By providing a consistent ATR-based trailing stop across different timeframes, this indicator helps traders maintain a unified approach to their trading strategy, regardless of the chart interval they are viewing.

Combining Trailing Stop and Stop loss (% of instrument price)Both a trailing stop and a stop loss are necessary tools for every trader, for locking in as much profit in any given trade, while on the other hand minimizing the risks involved in trading.
I started to write this scipt to give an answer to many traders who wanted these two tools combined, but didn't find any way to program this.
TV has some shortcomings in the built-in functions regarding this topic. You can use 'stop' and 'limit', or 'loss' and 'profit' and even functions with trailing stops. But all of these lack the flexibility of the use of percentages.
I used many ideas of the community, and with this scrip I want to give back to the community.
The strategy is just a simple crossing of two Exponential Moving Averages, so do not start trading based solely on this script.
Also keep in mind that no two assets are the same, and adjustments should be made in the configuration for every asset.
This script should be viewed as a template, just take out the chunks of code you need. A savvy programmer can undoubtedly implement a 'take profit' of 50% halfway down the trade.
The features are:
-Everything is easily adjustable through the configuration section
-2 EMA's which form the strategy to go Long or Short
-Trailing stop, which adjust itself every bar according to the configuration
-Stop loss, which uses the entry price of the trade and stays at the same level according to the configuration
-The chart provides a visual reference for the levels of both stops
Happy trading!

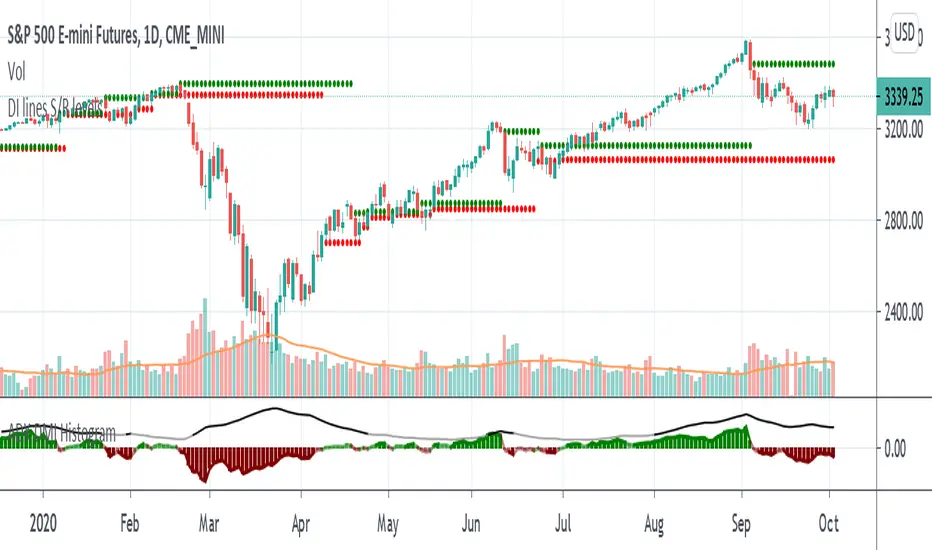
Support and Resistance levels - DMI - DI trailing stop linesThis can be used to compliment the Directional Movement Index if used as a standalone trading system. In addition to using the ADX and DI lines, a trailing stop can be used when the DI lines cross. If the plus line is above to show a buy signal, then the low of the price of when which the cross took place is used as a trailing stop. If the minus line is above to show a sell signal, then the high of the price of when which the cross took place is used as a trailing stop. This helps cut losses sooner whenever the price would end up going through these trailing stops or support/resistance levels yet the DMI system would show an upward or downward move.
[AutoView] Trailing Stop Back Testing and alerts + TP and TSThe number one request since the creation of autoview was to have alerts triggered for Take Profit, Stop Loss and Trailing Stops. Finally, we've figured it out, and as an additional bonus, this allows us to back test trailing stops in the strategy tester.
YouTube Video about this script and setup: bit.ly
This script contains 2 things people have been asking for, multiple time frames and of course, a trailing stop that can be both back tested and setup for alerts.
This strategy itself seems to perform better without the use of the Trailing Stop, so play around and monitor it before actually trying to trade it live.
View all the trades being tracked in a Google Sheets here: bit.ly
To learn more about back testing strategies, automation and AutoView join our free slack group via slack.crypto.pink
Referral Tax:
This requires 4 alerts, so you are going to have to upgrade to PRO. It'd be greatly appreciated if you signed up using our referral link.
bit.ly
1Broker
bit.ly
okcoin
bit.ly

Bitcoin Momentum StrategyThis is a very simple long-only strategy I've used since December 2022 to manage my Bitcoin position.
I'm sharing it as an open-source script for other traders to learn from the code and adapt it to their liking if they find the system concept interesting.
General Overview
Always do your own research and backtesting - this script is not intended to be traded blindly (no script should be) and I've done limited testing on other markets beyond Ethereum and BTC, it's just a template to tweak and play with and make into one's own.
The results shown in the strategy tester are from Bitcoin's inception so as to get a large sample size of trades, and potential returns have diminished significantly as BTC has grown to become a mega cap asset, but the script includes a date filter for backtesting and it has still performed solidly in recent years (speaking from personal experience using it myself - DYOR with the date filter).
The main advantage of this system in my opinion is in limiting the max drawdown significantly versus buy & hodl. Theoretically much better returns can be made by just holding, but that's also a good way to lose 70%+ of your capital in the inevitable bear markets (also speaking from experience).
In saying all of that, the future is fundamentally unknowable and past results in no way guarantee future performance.
System Concept:
Capture as much Bitcoin upside volatility as possible while side-stepping downside volatility as quickly as possible.
The system uses a simple but clever momentum-style trailing stop technique I learned from one of my trading mentors who uses this approach on momentum/trend-following stock market systems.
Basically, the system "ratchets" up the stop-loss to be much tighter during high bearish volatility to protect open profits from downside moves, but loosens the stop loss during sustained bullish momentum to let the position ride.
It is invested most of the time, unless BTC is trading below its 20-week EMA in which case it stays in cash/USDT to avoid holding through bear markets. It only trades one position (no pyramiding) and does not trade short, but can easily be tweaked to do whatever you like if you know what you're doing in Pine.
Default parameters:
HTF: Weekly Chart
EMA: 20-Period
ATR: 5-period
Bar Lookback: 7
Entry Rule #1:
Bitcoin's current price must be trading above its higher-timeframe EMA (Weekly 20 EMA).
Entry Rule #2:
Bitcoin must not be in 'caution' condition (no large bearish volatility swings recently).
Enter at next bar's open if conditions are met and we are not already involved in a trade.
"Caution" Condition:
Defined as true if BTC's recent 7-bar swing high minus current bar's low is > 1.5x ATR, or Daily close < Daily 20-EMA.
Trailing Stop:
Stop is trailed 1 ATR from recent swing high, or 20% of ATR if in caution condition (ie. 0.2 ATR).
Exit on next bar open upon a close below stop loss.
I typically use a limit order to open & exit trades as close to the open price as possible to reduce slippage, but the strategy script uses market orders.
I've never had any issues getting filled on limit orders close to the market price with BTC on the Daily timeframe, but if the exchange has relatively low slippage I've found market orders work fine too without much impact on the results particularly since BTC has consistently remained above $20k and highly liquid.
Cost of Trading:
The script uses no leverage and a default total round-trip commission of 0.3% which is what I pay on my exchange based on their tier structure, but this can vary widely from exchange to exchange and higher commission fees will have a significantly negative impact on realized gains so make sure to always input the correct theoretical commission cost when backtesting any script.
Static slippage is difficult to estimate in the strategy tester given the wide range of prices & liquidity BTC has experienced over the years and it largely depends on position size, I set it to 150 points per buy or sell as BTC is currently very liquid on the exchange I trade and I use limit orders where possible to enter/exit positions as close as possible to the market's open price as it significantly limits my slippage.
But again, this can vary a lot from exchange to exchange (for better or worse) and if BTC volatility is high at the time of execution this can have a negative impact on slippage and therefore real performance, so make sure to adjust it according to your exchange's tendencies.
Tax considerations should also be made based on short-term trade frequency if crypto profits are treated as a CGT event in your region.
Summary:
A simple, but effective and fairly robust system that achieves the goals I set for it.
From my preliminary testing it appears it may also work on altcoins but it might need a bit of tweaking/loosening with the trailing stop distance as the default parameters are designed to work with Bitcoin which obviously behaves very differently to smaller cap assets.
Good luck out there!

PCT Trailing Stoploss-Strategy
I am not a financial advisor and this is not financial advice. This is provided for illustration only for a Percent based Trailing Stoploss.
I have been looking for a Percent based Trailing Stoploss and have not been able to find one that would work for me so I wrote my own. This works in both a Strategies and Indicators I put comments inline of where to add or remove comments// depending on which one you are aiming for. The simple EMA crossovers are there just to give the strategy something to do. To use, copy the Stoploss section, the inputs at the top, and the reset under the sell section to your own script. When I first started out I found the code for removing the redundant signals and then used it in most of my scripts. For the life of me I do not remember where I got it - either in a comment in Tradingview or on a reddit post, so if you wrote that part, thank you.
About me:
I have only been working with PineScript since January 2022 and have never been much of a coder from a professional standpoint but decided to jump in and learn Pine mainly because I am a crap, emotional trader and this way I can remove that aspect of it and lose my money programmatically as opposed to making it a conscious decision :)
Bands-Trailing Stop UtilityIntroduction
Bands and trailing stops are important indicators in technical analysis, while we could think that both are different they can be in fact closely related, at least in the way they are made. Bands and trailing stops can be made from a simple central tendency estimator, like a moving average, and from a volatility estimator like standard deviation, atr...etc.
This is why i propose this utility that allow you to make bands and trailing stops from any indicator in the price chart.
How To Use
All you have to do is select the indicator you want to make bands from in the settings, so just open the Bands-Trailing Stop Utility indicator settings and select your indicator in "Source". Make sure your source indicator is not in "hide" mode.
For example here i'am using a moving average as source for the indicator. Mult control how spread the bands are from each others, by default mult = 1, if we use mult = 2 we get :
Mult can be non-integer as well as lower than 1 (when lower than 1 the bands would be closer to each others)
Error/Volatility Estimators
You can choose from a wide variety of volatility estimators, select the estimator from the "Method" scrolling parameter in settings, by default the indicator will use the running mean absolute error (MAE) which don't use length. Other estimators use length, making length = to the period of the source indicator can help get better results.
The root moving averaged squared error (RMASE) is just the square root of the simple moving average of the squared difference between the closing price and the source indicator. length control the period of the moving average of RMASE.
You can also use the average true range with period length. It might work better with low lagging moving averages.
The range is simply the difference between the highest and lowest over length periods of the source indicator.
Stdev is simply the price running standard deviation.
Trailing Stop
When the trailing stop mode is checked the bands will be replaced by a trailing stop, the trailing stop will still depend on every settings of the indicator like mult/volatility estimator...etc.
Conclusion
You might find an use to this tool if you want to make bands/trailing stops from pretty much everything. The indicator used as source for the examples is a smooth exponential averager that i could share if i see interest from peoples.
Thanks for reading !

BitMex Trailing Stop StrategyThis script is designed for those who want to use BitMex's trailing stop. It's not meant to be used as entry exits, but rather to get an idea of how wide the trailing stop needs to be. I suggest you backtest with different values. The script can also be integrated into an existing strategy which does give entry/exits to act as its stop loss.

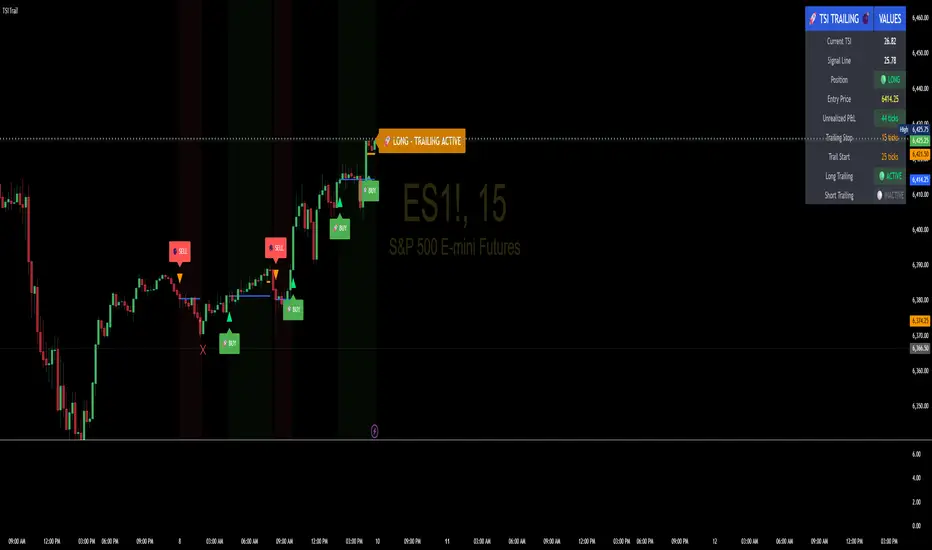
TSI Indicator with Trailing StopAuthor: ProfitGang
Type: Indicator (visual + alerts). No orders are executed.
What it does
This tool combines the True Strength Index (TSI) with a simple tick-based trailing stop visualizer.
It plots buy/sell markers from a TSI cross with momentum confirmation and, if enabled, draws a trailing stop line that “ratchets” in your favor. It also shows a compact info table (position state, entry price, trailing status, and unrealized ticks).
Signal logic (summary)
TSI is computed with double EMA smoothing (user lengths).
Signals:
Buy when TSI crosses above its signal line and momentum (TSI–Signal histogram) improves, with TSI above your Buy Threshold.
Sell when TSI crosses below its signal line and momentum weakens, with TSI below your Sell Threshold.
Confirmation: Optional “Confirm on bar close” setting evaluates signals on closed bars to reduce repaint risk.
Trailing stop (visual only)
Units are ticks (uses the symbol’s min tick).
Start Trailing After (ticks): activates the trail only once price has moved in your favor by the set amount.
Trailing Stop (ticks): distance from price once active.
For longs: stop = close - trail; it never moves down.
For shorts: stop = close + trail; it never moves up.
Exits shown on chart when the trailing line is touched or an opposite signal occurs.
Note: This is a simulation for visualization and does not place, manage, or guarantee broker orders.
Inputs you can tune
TSI Settings: Long Length, Short Length, Signal Length, Buy/Sell thresholds, Confirm on Close.
Trailing Stop: Start Trailing After (ticks), Trailing Stop (ticks), Show/Hide trailing lines.
Display: Toggle chart signals, info table, and (optionally) TSI plots on the price chart.
Alerts included
TSI Buy / TSI Sell
Long/Short Trailing Activated
Long/Short Trail Exit
Tips for use
Timeframes/markets: Works on any symbol/timeframe that reports a valid min tick. If your market has large ticks, adjust the tick inputs accordingly.
TSI view: By default, TSI lines are hidden to avoid rescaling the price chart. Enable “Show TSI plots on price chart” if you want to see the oscillator inline.
Non-repainting note: With Confirm on bar close enabled, signals are evaluated on closed bars. Intrabar previews can change until the bar closes—this is expected behavior in TradingView.
Limitations
This is an indicator for education/research. It does not execute trades, and visuals may differ from actual broker fills.
Performance varies by market conditions; thresholds and trail settings should be tested by the user.
Disclaimer
Nothing here is financial advice. Markets involve risk, including possible loss of capital. Always do your own research and test on a demo before using any tool in live trading.
— ProfitGang
ATR Trailing Stop with ATR Targets [v6]What the Indicator Does
This custom TradingView indicator is designed for active traders who want to automate and visualize their trailing stop management and target setting, using true market volatility. It combines the Average True Range (ATR) with dynamic market structure logic to:
Trail a stop-loss behind major swings in real time, using 2×ATR (adjustable) from the highest high in uptrends or the lowest low in downtrends.
Flip trading bias between bullish and bearish when the stop is breached.
Identify and plot three profit targets (at 1, 2, and 3 ATR from the breakout/flip point) after every stop-flip, helping traders scale out or set take-profits objectively.
Maintain a visible presence on your chart every bar to avoid indicator errors, with color and labeling for clear distinction between long/short phases.
How the Indicator Works
1. ATR Calculation
ATR Period and Multiplier: You select your preferred ATR length (default is 14 bars) and a multiplier (default is 2.0).
Volatility Adjustment: ATR measures the average "true" bar range, so the trailing stop and targets adapt to current volatility.
2. Trailing Stop Logic
Uptrend (bullish bias): The indicator tracks the highest high made since the last bearish-to-bullish flip and sets the stop at - .
The stop only raises (never lowers) during an uptrend, protecting gains in strong moves.
Downtrend (bearish bias): Tracks the lowest low made since the last bullish-to-bearish flip, with stop at + .
The stop only lowers (never raises) in a downtrend.
Flip Point: If price closes through the trailing stop, the current bias “flips,” and the logic reverses (bullish to bearish or vice versa). At the new close, flip price and bar index are stored for target calculation.
3. ATR Targets after Flip
After each stop flip:
Three targets—based on the new close price—are calculated and plotted:
Long flip (new bull bias): Target1 = close + 1×ATR, Target2 = close + 2×ATR, Target3 = close + 3×ATR.
Short flip (new bear bias): Target1 = close - 1×ATR, Target2 = close - 2×ATR, Target3 = close - 3×ATR.
These targets help with scaling out, partial profit-taking, or setting automated orders.
4. Visual Feedback
Trailing stop line: Green for long bias, red for short bias.
Targets: Distinct color-coded circles at 1, 2, 3 ATR levels from the most recent flip.
Flip Labels: Mark the bar and price where bias flipped (“Long Flip” or “Short Flip”) for quick pattern recognition.
Subtle background shading: Ensures TradingView's requirement for “indicator output every bar.”
How to Use This Indicator
Parameter Setup
ATR Period and Multiplier: Adjust to match the timeframe and volatility of your instrument.
Lower periods/multipliers for short-term/volatile trading.
Higher values for smoother signals or higher timeframes.
Starting Trend: Set to match the expected initial bias if the instrument has strong trend characteristics.
Trading Application
1. Daily Bias Approach
Establish your bias in line with your trading plan (e.g., only trade long if price is above the previous day's high, short below the previous day's low).
Only look for trades in the indicator's current bias direction, as expressed by the stop and background color.
2. Entry
Use the indicator as a real-time confirmation or trailing stop for your entries.
Breakout: Enter when price establishes the current bias, using the trailing stop as your risk level.
Reversal: Wait for a bias flip after an extended move; enter in the direction of the new bias.
VWAP Rebound: Combine with a VWAP bounce—enter only if the indicator bias supports your direction.
3. Exits/Targets
Trailing stop management: Move your stop according to the plotted line; exit if your stop is hit.
Profit-taking: Scale out or take profits as price approaches each ATR-based target.
Use the dynamic labeling to identify reversal flips and reset your plan if stopped or the bias changes.
4. Market Context
Filter and frame setups by watching correlated indicators (DXY, VIX, AUDJPY, put/call ratio) and upcoming news; trade only in the daily bias direction for best consistency.
5. Practical Tips
Combine this indicator with your custom watchlist and alert settings to get notified on flips or targets.
Review the last label ("Long Flip"/"Short Flip") and targets to plan partial exits.
Remember: ATR adapts to volatility, so the stop and targets stay proportionate even when price action shifts.

Turtle Trading System + ATR Trailing StopIndicator Description: Turtle ATR Trailing Stop
The **Turtle ATR Trailing Stop** is a technical indicator designed to enhance the classic Turtle Trading System by incorporating a dynamic trailing stop based on the Average True Range (ATR). This indicator is ideal for traders seeking to manage risk and lock in profits on both long and short positions in trending markets.
Key Features:
- Turtle Trading Levels: Calculates the 20-day highest high and lowest low to identify potential breakout points, a core principle of the Turtle Trading System.
- ATR-Based Trailing Stop: Utilizes a trailing stop that adjusts dynamically based on a multiple of the ATR (default multiplier: 2.0), providing a volatility-adjusted exit mechanism.
- Position Flexibility: Supports both long and short positions, with the trailing stop positioned below the highest price for long trades and above the lowest price for short trades.
- Smooth Updates: The trailing stop updates on each bar, ensuring a more responsive adjustment to price movements, rather than only on new highs or lows.
- Reset Mechanism: Automatically resets the trailing stop when the price deviates significantly (configurable threshold, default 0.1%), adapting to major trend reversals.
- Alerts: Includes customizable alerts that trigger when the price reaches the trailing stop level, notifying traders of potential exit points.
- Debugging Tools: Features an on-chart debug table displaying ATR, Close, Highest Price, Lowest Price, Potential Stop, and Trailing Stop values for real-time analysis.
How It Works:
- For **Long Positions**: The trailing stop starts below the initial close price (minus 2*ATR) and moves up as the highest price increases, locking in profits while trailing at a fixed ATR distance.
- For **Short Positions**: The trailing stop starts above the initial close price (plus 2*ATR) and moves down as the lowest price decreases, protecting against upward price movements.
- The stop resets if the price falls (for long) or rises (for short) beyond the set threshold, ensuring adaptability to new market conditions.
Customization:
- Period Settings: Adjust the length for highs/lows (default 20) and ATR period (default 14).
- ATR Multiplier: Modify the distance of the trailing stop (default 2.0).
- Reset Threshold: Fine-tune the percentage at which the stop resets (default 0.1%).
- Position Type: Switch between "Long" and "Short" modes via input settings.
Usage:
Apply this indicator to any chart in TradingView, set your preferred parameters, and monitor the trailing stop line (yellow) alongside the Turtle highs (red) and lows (blue). Use the debug table to validate calculations and set alerts to stay informed of stop triggers.
This indicator combines the trend-following strength of the Turtle System with a flexible, ATR-based stop-loss strategy, making it a powerful tool for both manual and automated trading strategies.

Multi-LTF ATR Trailing Stop - AYNETSimple Explanation of the Code
This Pine Script code implements a multi-timeframe ATR-based trailing stop indicator. It calculates and plots the trailing stop lines for up to six configurable timeframes. Users can enable or disable specific timeframes, and each trailing stop line is color-coded and labeled with the corresponding timeframe (e.g., "15m", "1H").
Key Features of the Code
Multi-Timeframe Support:
The script calculates trailing stops for six different timeframes, such as 15 minutes, 1 hour, 1 day, etc.
User Configurations:
The user can:
Select timeframes for each trailing stop (e.g., "15m", "1H").
Enable or disable each timeframe using checkboxes.
Adjust the ATR period and multiplier to customize the trailing stop calculation.
Color-Coded Lines:
Each timeframe's trailing stop is plotted with a unique color for easy distinction.
Labels for Timeframes:
Labels at the end of the lines indicate the timeframe of each trailing stop (e.g., "15m", "1H").
Summary
This code is a multi-timeframe ATR trailing stop tool that helps traders visualize and analyze trailing stops across multiple timeframes. It is customizable, dynamic, and visually intuitive, making it ideal for both trend-following and stop-loss management.
Custom ATR Trailing StopThis Script creates a custom ATR (Average True Range) trailing stop. It allows traders to set up automated stop-loss levels based on the ATR, which adjusts dynamically to market volatility. The script is designed to support both long and short trades, offering flexibility and precision in trade management.
When loading the indicator to your chart, simply click to set the trade begining time, confirm various settings and you are set.
Check tooltips for more details in the input settigns menu.
User Inputs
Trade Setup: Allows users to set the trade direction (Long or Short), the signal source for entries, and the specific bar time for the trade setup.
ATR Settings: Configurable ATR lookback period, ATR smoothing period, initial ATR multiplier for setting the stop-loss, breakeven ATR multiplier, and a manual breakeven level.
ATR Calculations
Computes the ATR and its moving average.
Determines initial and breakeven stop levels based on the ATR.
Signal Validation
Validates long or short trade signals based on the specified bar time and trade direction.
Triggers alerts when a valid trade signal is detected.
Trailing Stop Logic
For long trades, adjusts the stop-loss level dynamically based on the ATR.
For short trades, performs similar adjustments in the opposite direction.
Updates the trailing stop level to ensure it follows the price, moving closer as the price moves favorably.
Resets the trade state when the stop-loss is hit, triggering an alert.
Plotting
Plots the trailing stop levels on the chart.
Uses green for stop levels indicating profit and red for stop levels indicating a loss.
