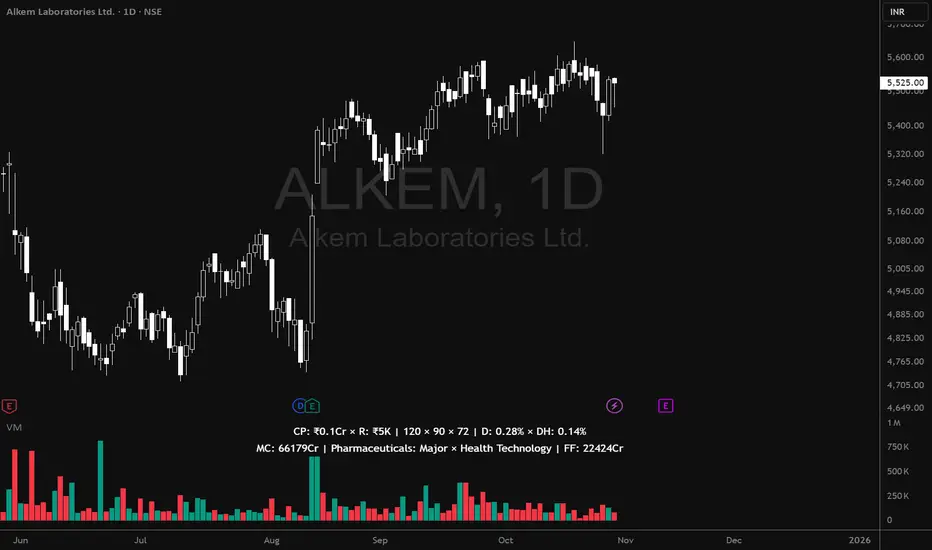
Volume MatrixVolume Matrix (VM) is a comprehensive volume and position-sizing toolkit designed to help traders interpret market participation and manage trade risk efficiently.
It combines volume analytics, risk-adjusted position sizing, and stock-specific financial data — all in a clear, visual, and automated format directly on TradingView charts.
The indicator integrates capital management, episodic volume spikes, and market capitalization data into a single, intuitive framework, giving traders an edge in both decision-making and discipline.
⚙️ Core Components & Features
🧩 1. Position Sizing & Risk Management
A dynamic risk table helps traders determine how much to trade and how much to risk per position, adapting automatically based on user inputs:
- Capital (CP): Total account size (₹ or $).
- Risk Mode (R): Choose between Percentage of capital or fixed Currency value.
- Lot Size Mode: Optional toggle to align quantities with F&O lot sizes (India-based).
- Standard Stop-Loss (SSL): Displays position quantities for three custom stop-loss levels (e.g., 0.75%, 1%, 1.25%).
- % Distance Metrics: D: Distance from day’s low/high (helps assess stop distance). DH: Distance from mid-body (useful for candle risk assessment). Auto-adjusts based on whether the trader is in Long, Short, or Both mode.
📈 Helps answer:
“How much quantity should I trade at my desired risk level?”
🔶 2. Volume Visualization
- Plots volume bars with default up/down coloring.
- Green for bullish bars.
- Red for bearish bars.
- Designed for quick visual differentiation of buying/selling pressure.
🚀 3. Episodic Pivot (EP) Detector
Identifies high-volume breakout or capitulation days, often marking significant turning points or trend initiations.
- Highlights bars where volume exceeds a custom threshold (in millions).
- Marks them visually with an orange triangle under the candle.
-Best used on daily charts to spot institutional footprints.
📊 Helps answer:
“Is today’s volume large enough to signal major institutional activity?”
🧾 4. Data Metrics Table
Displays fundamental and contextual data about the asset:
- Market Capitalization (MC): Auto-calculated using outstanding shares × price.
- Free Float (FF): Value of tradable shares in currency or Cr (INR).
- Industry × Sector × F&O Status: Shows the company’s industry and sector classification. Displays FC (Futures Contract) or NFC (Non-F&O stock).
- Customizable appearance: Choose between text/value display, text color, and background color. Flexible positioning and size control to suit any chart layout.
📚 Helps answer:
“What type of stock is this, how big is it, and does it trade in futures?”
🪄 5. User Interface Customization
- Modular UI grouped by functionality (Risk, Direction, Metrics, Volume, etc.).
- Flexible table position & size (Top/Bottom/Middle & Tiny–Huge).
- All elements are toggleable, giving full control over displayed data.
- Built to ensure visual clarity on any chart background.
| Trading Goal | How Volume Matrix Supports It |
| ------------------------------ | -------------------------------------------------------------- |
| **Risk Management** | Calculates optimal trade size and risk exposure automatically. |
| **Position Sizing Discipline** | Enforces consistent sizing across trades using SSL levels. |
| **Volume Confirmation** | Highlights institutional participation via Episodic Pivots. |
| **Stock Context Awareness** | Shows market cap, sector, and float value instantly. |
| **Efficiency** | Reduces manual work — no need for calculators or spreadsheets. |
💡 In Short
Volume Matrix simplifies trade planning, brings transparency to risk, and connects volume with context — all in one elegant visual tool.
Perfect for:
- Discretionary traders refining entries and sizing.
- Swing traders watching for volume-based pivots.
- Analysts who want price-volume fundamentals at a glance.
חפש סקריפטים עבור "VOLUME BAR"
Volume Surge Highlighter by Avinash VRThis indicator displays volume bars with custom colors based on comparison to the moving average of volume.
Red bars highlight high volume (above average), indicating strong market interest.
Grey bars indicate normal volume (below average).
It helps traders visually detect volume surges and potential breakouts or reversals in the market.
Dollar VolumeThe Dollar Volume indicator enhances traditional volume analysis by showing not only the number of shares traded, but also the actual capital exchanged per bar. Using the formula
(High+Low)/2×Volume , it calculates dollar volume to give a clearer picture of real market participation. This approach helps traders identify where significant money is flowing—an important distinction when evaluating the strength of price moves or spotting potential institutional activity.
Volume bars are color-coded based on price direction, and a 50-period Volume Moving Average (VMA)—set to 50 by default—is plotted as a baseline to define “normal” volume levels. When a bar's volume exceeds this average by a user-defined multiple (default is 2×), it is highlighted: blue by default when volume is bullish and elevated, and maroon when bearish and elevated. This makes it easy to spot unusual or high-impact volume spikes at a glance, especially during potential breakout or reversal setups.
In the top-right corner of the chart, a compact display—highlighted in purple by default—shows the current dollar volume, with the option to toggle and view the average dollar volume instead. Meanwhile, the Y-axis continues to show raw share volume, giving you access to both perspectives side by side. With its combination of real capital flow, visual volume signals, and customizable thresholds, the Dollar Volume indicator is a practical and powerful tool for confirming price action, identifying accumulation, and monitoring momentum shifts.

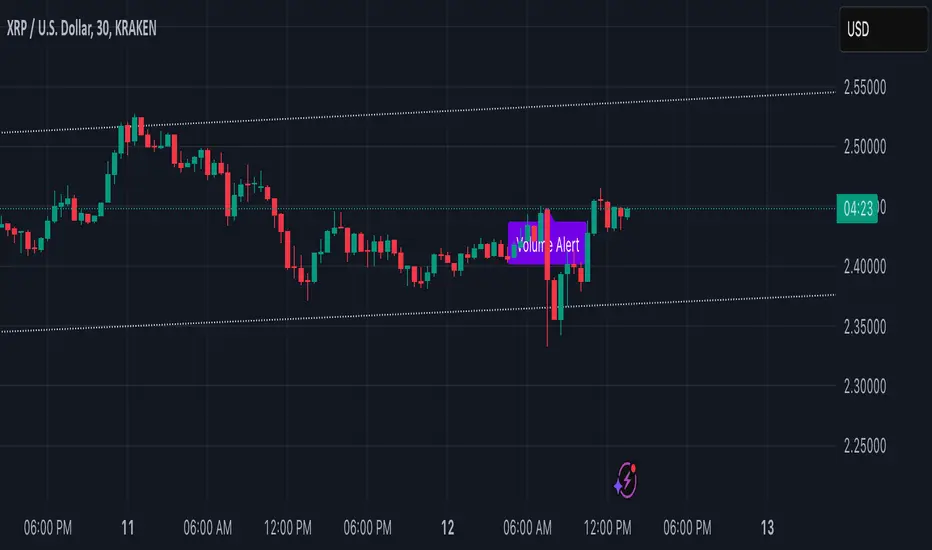
Volume Alert with Adaptive Trend - MissouriTimElevate your market analysis with our "Volume Alert with Adaptive Trend" indicator. This powerful tool combines real-time volume spike notifications with a sophisticated adaptive trend channel, providing traders with both immediate and long-term market insights. Customize your trading experience with adjustable volume alert thresholds and trend visualization options.
Features Summary
Volume Alert Features:
Volume Spike Detection:
Alerts you when volume exceeds a user-defined multiplier of the 20-period Simple Moving Average (SMA) of volume, helping identify potential market interest or significant price movements.
Visual Notification:
A "Volume Alert" label appears on the chart in a striking purple color (#7300E6) with white text, making high volume bars easily noticeable.
Customizable Sensitivity:
The volume spike threshold is adjustable, allowing you to set how sensitive the alert should be to volume changes, tailored to your trading strategy.
Alerts:
An alert condition is set to notify you when a volume spike occurs, ensuring you don't miss potential trading opportunities.
Adaptive Trend Features
Adaptive Channel:
Visualizes market trends through a dynamic channel that adjusts to price movements, offering insights into trend direction, strength, and potential reversal points.
Lookback Period:
Choose between short-term or long-term trend analysis with a toggle that adjusts the calculation period for the trend channel.
Channel Customization:
Fine-tune the trend channel with options for deviation multiplier, line styles, colors, transparency, and extension preferences to match your visual trading preferences.
Non-Repainting:
The trend lines are updated only on the current bar, ensuring the integrity of historical data for backtesting and strategy development.
Integrated Utility
Combination of Tools: This indicator marries the immediacy of volume alerts with the strategic depth of trend analysis, offering a comprehensive view of market dynamics.
User Customization: With inputs for both volume alerts and trend visualization, the indicator can be tailored to suit various trading styles, from scalping to swing trading.
This indicator ensures you're always in tune with market movements, providing crucial information at a glance to inform your trading decisions.
Follow the Volumes / Path of Least ResistanceThis indicator tracks price movements following significant volume increases. It identifies volume spikes by comparing recent average volume to a longer-term average. After a spike, it monitors price changes over a specified number of bars.
In plain English, the point of this is to “let the market show it’s hand”, vs. other common and preemptive methods of execution.
You can think of it as a better version of a volume up/down indicator which only uses opening and closing prices to identify "bullish" or "bearish" behavior.
To optimize this, I used a very small range chart, hence the small values. You will need to experiment with other values, ESPECIALLY the % change. If you do not do this, the indicator will generate a lot of noise.
The indicator has three main conditions:
1. Significant price increase, bullish: A green triangle appears below the bar.
2. Significant price decrease, bearish: A red triangle appears above the bar.
3. Price change within thresholds: A fuschia triangle appears, pointing up or down based on the overall (short-term) trend. This is common behavior during trends. A spike in volume will appear, and price simply does not budge. Volume/price is essentially declaring a new found value, in which case prices tend to follow the impulse movement (see market profile theory).
The color scheme is intuitive: green for positive moves, red for negative, and fuschia for subtle changes following the existing trend. Blue circles mark volume spikes for reference, which I recommend using only for reference, and disabling to remove unneeded noise.
Because this indicator "lags" in the sense of waiting for the market to show its hand, best opportunities are typically found on retests of the volume spikes themselves. On drives, however, the market will unlikely pullback, which (in my view) is one of its best use cases.
Bottom line, you will need to adjust the parameters to the instrument. This is not a plug and play solution, but far more accurate than those which are.
Settings, and what they mean:
Volume spike average bars: length for identification of high volumes. On smaller timeframes, such as my optimization period, you’ll want several bars. But on something such as a 5 minute or higher, only 1.
Lookback period: for identification of high volumes.
Volume Increase Threshold (%): % which constitutes a jump in volume
Bars After Spike: How long to wait for ensuing price movement. Also sensitive to the timeframe you are using. 1-2 recommended for 5m+, more for smaller range-based.
Negative Price Change Threshold (%): For red arrows (Volume + Price Movement)
Positive Price Change Threshold (%): Inverse of above
WMA Period for Stability Function: When price spikes on high volumes but does not move (price is “trapped” between negative and positive price change thresholds) the indicator marks direction (in fuchsia) in the direction of the underlying trend. This short-term MA identifies that trend.
Finally, because this indicator is volume-based, I recommend using primary instruments only and discourage its use on CFDs or other firm-generated instruments. Just use the primary. I would ignore signals off the open, which is subject to erroneous behavior. Other methods are far more effective for that.
This script is purposely uncomplicated. Feel free to play with settings and change code to suit your needs.

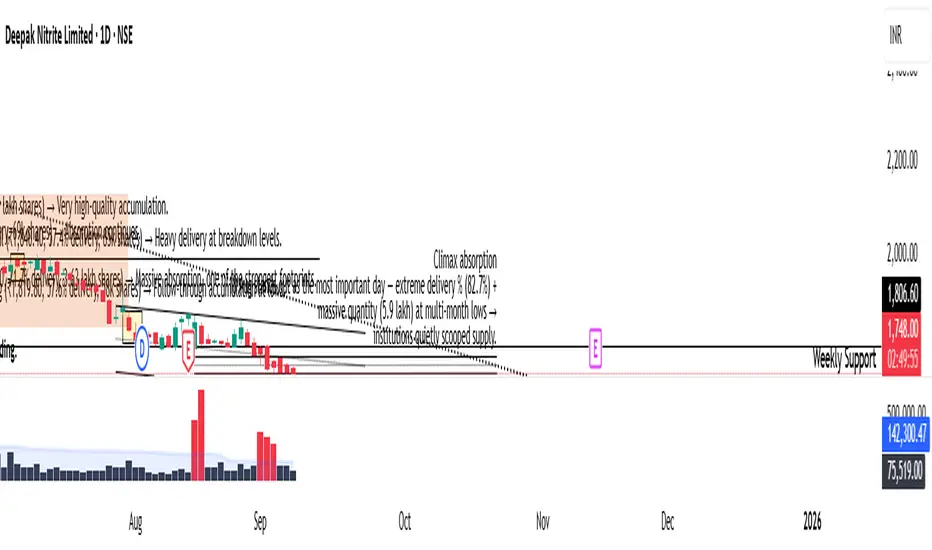
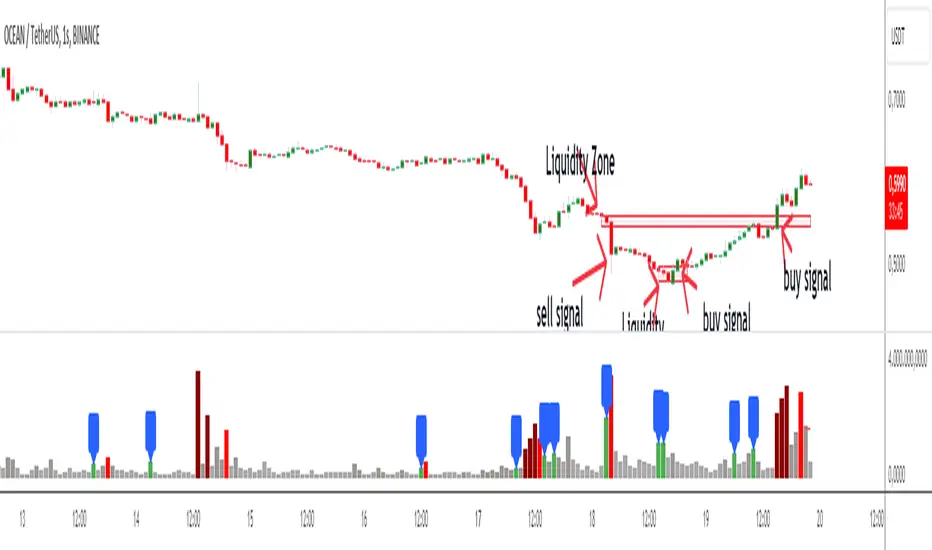
Liquidity Zone DetectorLiquidity Zone Detector User Guide
Liquidity Zone Detector is a powerful tool designed to identify high liquidity zones in the market. This indicator highlights areas where trading volume is significantly higher than average, but price movement remains limited. Such zones are often indicative of strong support or resistance levels, where substantial buying or selling activity occurs without a corresponding large price change.
Key Features:
Volume Analysis: Uses a configurable moving average to analyze volume and identify spikes in trading activity.
Body Length Analysis: Calculates the average body length of candlesticks to detect periods of low price movement.
Customizable Parameters: Adjust the analysis period, volume factor, and moving average length to suit your trading strategy.
Color-Coded Heatmap: Visualizes different volume levels with a gradient color scheme, from very low to peak volume.
Liquidity Highlight: Marks high liquidity zones with a distinct green color for easy identification.
How to Use:
1. Analysis Period
Setting: Analysis Period
Description: Sets the number of bars to use for calculating the average body length of candlesticks.
Recommendation: Use shorter periods (e.g., 10-20) for short-term analysis, and longer periods (e.g., 50-100) for long-term analysis.
2. Volume Factor
Setting: Volume Factor
Description: Determines the multiplier for average volume to identify high volume candles.
Recommendation: Start with values like 1.5-2.0 and adjust according to market conditions.
3. Volume Moving Average Length
Setting: Volume MA Length
Description: Sets the period for calculating the moving average of volume.
Recommendation: Use shorter periods (e.g., 20-50) for short-term analysis, and longer periods (e.g., 100-200) for long-term analysis.
4. Volume Factor Settings
Settings: Peak, High, Medium, Base Volume Factors
Description: Customizes thresholds for peak, high, medium, and base volume levels.
Recommendation: Start with default settings and adjust according to your trading strategy.
5. Visualization
Description: The indicator plots volume bars with color coding based on the configured thresholds. High liquidity zones are marked in green for quick recognition.
Recommendation: Configure the color coding and visualization options to suit your trading platform.
Conclusion
Liquidity Zone Detector is an essential tool for traders looking to spot potential areas of accumulation or distribution. It helps you make more informed decisions and enhances your overall trading performance.
NSE Market Breadth VolumeMarket Breadth Volume (MBV) is defined as the ratio between the count of stocks giving a volume 1.5 times greater than its 20-day SMA, and the count of stocks giving a volume 0.5 times lesser than its 20-day SMA. This breadth indicator reflects participation in the markets. A sloping upward MBV shows that money is coming into the market.
MBV was devised by Chhirag_Kedia & this is how he explains it:
When it surpasses 1+ (benchmarking), it shows a matured upswing, which in the initial stages will result in strong buying but as the time passes with such a high rating will result in an extended market with high no. of breakout failures.
The final stage is ratings above 1.5 to 2+. These in later stages will reflect extreme reading and will result in trend exhaustion.
Similarly on the bearish side, the volume will dry up as we get a shakeout or a strong red day. This reduction in participation will result in lacklustre outcome in breakouts and will subsequently dry up further, usually coming under 0.2 to show extreme dryness.
Look for a systematic pick-up in volume post 15-20 days of first shakeout. Look for days with significant pick up with positive breadth, like volume coming around 0.20 etc. jumps to 0.35 to 0.45 etc. This will suggest that participation is picking up in the market and we will see a rally soon.
FEATURES
⦿ Multi-color Mode
For the sake of visual representation, you can turn on the multi-color mode where the volume bars can have one of the 4 colors:
Dry volume (Grey): Volume ≤ 0.25
Low Volume (Orange): Volume between 0.25 & 0.5
Mid Volume (Green): Volume between 0.5 & 1
High Volume (blue): Volume > 1 → Mature upswing
⦿ Background Net Breadth
Option to display the to display the net breadth as a background color. By default, the background colors are turned off.
⦿ Moving Average
There is an option to turn on a moving average of the volume. By default, it is the 5 SMA. This shows the near-term trend, & whether the MBV is sloping upward or not.
Dependency:
The script uses the Pine Seeds service to import custom data hosted in a GitHub repository and accesses it via TradingView as the frontend. So, the number of bars appearing on charts is fully dependent on the amount of historical data available. Any error or omission, if there, is a reflection of the hosted data, & not that of TradingView.
Limitations:
Such data has some limitations, like it can only be updated at EOD (End-of-Day), & only daily-based timeframes can be applied to such data. Irrespective of the intraday changes, only the last saved value on the chart is seen. So, it's best to use this script as EOD, rather than intraday.
At the time of publication of this script, historical data was available till the year 2004.
The universe of stocks chosen for the data is all stocks with latest Close >= 1 and Market Cap > 10.
Credits:
NSE Market Breadth data is from Chhirag_Kedia , & the Pine seeds are courtesy of EquityCraze

Advanced VolumeThe "Advanced Volume" indicator is a versatile tool designed for traders who need a detailed analysis of market volume dynamics. It provides three unique modes of volume analysis: Simple, Complex, and Analytics, each offering distinct insights for various trading styles.
Key Features:
Modes of Operation:
Simple Mode: Displays traditional volume data for a quick overview of market activity.
Complex Mode: Reveals the differential volume between buyers and sellers in a lower time frame. This mode features two average lines - one showing the current average volume level and another depicting the past average, based on the chosen length. These lines provide a comparative view of current and historical market dynamics.
Analytics Mode: Combines buyers' and sellers' volume in a lower time frame with their average. The average line in this mode changes color based on the dominant volume: it turns blue (default color for positive volume) if the average buy volume is higher, and switches to the sell volume color if the average sell volume is predominant.
Customizable Settings:
Average Length: Allows you to adjust the length for moving average calculations.
Definition: Select from 'Maximum', 'High', or 'Medium' for time frame granularity.
Visual Preferences: Customize the width and colors of the volume bars and average lines to suit your visual preference.
Dynamic Calculations and Plots:
Differentiates between up-volume and down-volume for nuanced market sentiment analysis.
Includes various plots such as volume bars, moving averages, and dynamic lines for comprehensive analysis.
Usage Tips:
Utilize 'Simple Mode' for a quick market overview.
Engage 'Complex Mode' to assess buying vs. selling pressures and compare current volume trends against historical averages.
Apply 'Analytics Mode' for an in-depth analysis of volume trends, with color-coded average lines indicating dominant market forces.

Relative VolumeHello traders,
"There's nothing new on Wall Street" is an age-old saying that still shows its relevance in modern day financial markets; volume still serves as a valuable tool for any trader just as it did for those that came and succeeded before us; in order to succeed in modern day markets one has to take it up a notch and dabble in complicated topics, like math. Now I dunno about you reader but I’m not keen on sitting around all day just to watch numbers on a screen; it’s pretty important to add some color into your life before it becomes dull but how can someone add colors into their trading toolkit as an aid rather than bother? With a bit of help from 3 other amazing open-source indicators you too can become a statistics enjoyer by combining math and colors to make pattern recognition much more intuitive and offering more peace of mind when trading. “Sir but how?”, glad you didn’t ask, it helps with simplifying statistics, in this case a Gaussian bellcurve
“HUH?”, you say? Alright class, Gaussian bellcurves for math dislikers 101 is in session
- Imagine that we have a bunch of numbers that we want to graph. We could just draw a line and plot the numbers on it, but that might not be very interesting.
- Instead, we can use the shape of a bell to show how many of each number we have.
- Let's say we have a lot of people and we want to graph how tall they are. We would start by making a line from the shortest person to the tallest person, and then we would draw the bell shape around the line.
- The bell shape is called a "Gaussian Bell Curve," and it shows us how many people are a certain height.
- In the middle of the bell, where it's the widest, we have the most people who are about average height. As we move to the sides of the bell, the curve gets lower because there are fewer people who are really tall or really short.
The bell curve discussed is the main idea for the candle coloring component of this indicator as being able to analyze the distribution of an entire dataset, in this case volume, can alert us when volume/participation in the market is away from its average using color, and therefore an opportunity could be present. Fair warning, it’s important to not strictly focus on volume as volume is meant to be confluence to the current structure of the market rather than causing tunnel vision.
Why 3 indicators to combine?
It starts with the RVOL by Mik3Christ3ns3n indicator as the backbone by calculating the average volume over a specified period of time, and then compares each new volume value to this average to determine whether it is above or below the average. The indicator then normalizes the volume data and calculates the z-score/standard deviation to determine whether the volume is within normal range or is an anomaly beyond a specified threshold which can also be set into an alert to aid in eyeing possible opportunities.
The code also includes Candle Coloring by Morty as it calculates a function to get the z-score for the size of the candle's body, and then compares it to the z-score for volume to determine whether the body size is a factor in the price action.
Finally, the code plots the anomalies and the normalized volume data on the chart using the first RVOL indicator mentioned, and colors the bars of the chart based on whether they are within normal range or are anomalies which comes from using code from veryfid's relative volume indicator.
Overall, this custom technical indicator is best used to identify unusual changes in trading volume, which may indicate potential price movements in the underlying.
How about some examples?
This first example is for my scalpers wanting to get in and out but not having much of an idea where or let alone how; using a tool like VWAP can be great for determining the area value to execute mean reversion trades once a speculator spots a colored candle anomaly at standard deviation band. Works best when VWAP is flat as it signals lack of conviction from both bulls and bears
This second example is for my fire and forget intraweek swing traders who want to execute a higher timeframe trend-following bias. A speculator starting 2023 off notices that the negative sentiment around Binance from late last year has quieted down and has conviction in upside after BTC began an uptrend as monthly VWAP (right chart) has began sloping up as well as a rally with momentum shown with the blue colored candle so the trader waits wait for a pullback for entry. On the chart to the left of the 4H the speculator notices a pullback into the area of interest to do business so a limit bid is left to enter for continued upside in Bitcoin through January 2023 just by keeping things simple
That’s really the main purpose of this indicator: simplicity of statistics for confluence using volume
Volume precedes price and price moves only for narrative to follow- why wait for your subjective Twitter timeline to give you a biased narrative to trade when you can use objective analysis by combining statistics and colors to allow for a cleaner execution process
“But what about risk management?” Glad you didn’t ask reader!
One last example then, we meet our trend following trader again feeling euphoric so they know profit taking season is coming soon but wants to leave emotion out of it. How to go about it? Same idea as our last trend following example: we see on the 4h chart to the right side shows Bitcoin lose and trade back within the 2nd standard deviation of quarterly VWAP which is telling our speculator that the uptrend has broken on top of which notices on the 30 minute chart on the left that aggressive market buyers have been steadily absorbed by limit sellers on multiple occasions of retesting 30,500 shown with the green colored candles and volume bars below, time to sell.
Turns out that selling was proactive risk management because price dumped thereafter
Hope this explanation gave you some useful insights on using statistics as colors from cherrypicked examples, remember that just because my examples are cherrypicked doesn’t invalidate these concepts at all as the market only does two things, initiate aggressive auctions and respond passively to auctions. This tool makes for seeing where that initiative aggressive activity is happening much simpler to deduce if others will respond to an anomaly of initiative aggressive activity or if the aggression will continue.
If there’s just one thing you take from this- simplicity above all, cheers and good luck

ValiantTrader_Rsa Volume 3.0This indicator shows a trend for a day based on a current day candlestick especially for Scalpers and Intraday traders before they trade on lower timeframes.
Green And Red Arrows:
-Green arrows up below volume bars indicates a buy for a current day and Red arrows down above volume bars indicates a sell for a current day.
Orange and Black colors on volume bars are showing the volatility ;
-Orange indicates High Volatility for a current day then Black Indicates Low Volatility for a current day.

Quantum Tick VolumesMany forex traders assume there is no volume in the foreign exchange market. And they would be correct. There is no central exchange, not yet anyway. And even if there were, what would it report?
What there is however is activity, and this is captured as tick volume. After all, volume is simply displaying activity, the buyers and sellers in the market. So for volume read activity, and for activity read volume – simple.
First, the indicator paints the volume bars the same color as the candles on the chart. This means you can quickly match price and volume bars together. If you’re trading using volume and price as your core methodology, this is imperative. Your analysis will depend on a fast interpretation of the volume price relationship.
Second, the indicator prints a dynamic midpoint based on the daily data, giving you an instant picture of whether the volume is high, medium or low in the time frame selected. Again, this is essential for correctly analyzing the price volume dynamic. After all, what is average volume in the London session, may be high volume in the Asian session. The dynamic midpoint level reveals this instantly on the indicator, helping you make sense of the highs and lows of each volume bar.

Demand & Supply Zones With Volume Candle🧬 Demand & Supply Zones With Volume Color Candles — Multi-Timeframe S/R & Liquidity Zones.
🔥Automatic detects and plots dynamic Support & Resistance zones, liquidity areas, and Break-of-Structure (BoS) levels across multiple timeframes.
🔥 Key Factors
Body-Based Swings: Identifies swing highs/lows using Close or Open for precise S/R detection.
Auto Supply & Demand Zones: Creates ATR-sized S/R boxes that extend forward with touch-count tracking.
BoS Detection: Converts broken zones into dotted BoS lines for instant structure shift visibility.
Multi-TF Mapping (TF1–TF9): Plots higher-timeframe S/R levels directly on your chart for confluence.
Clean Overlap Filtering: Removes zones that are too close using ATR-based spacing logic.
Custom Swing Length: Controls sensitivity of pivots for strong or frequent zone formation.
Lookback Management: Stores only the most relevant recent S/R zones to avoid clutter.
Color-Coded Structure: Red = Supply, Blue = Demand, with labels showing touch count + timeframe.
Non-Repainting: Zones are drawn only after confirmed pivots for accurate, reliable structure.
📊 Volume Color Candle — Advanced Market Strength Visualization
Volume Color Candle is a powerful and visually enhanced tool designed to help traders instantly identify high-impact volume events, body-size anomalies, and market imbalances directly on any chart.
This indicator uses Z-Score statistical modeling to classify candles into Normal, Large, and Extreme categories — giving traders a deeper understanding of momentum, volatility, and unusual market activity.
🔍 Key Features
✅ Multi-Source Outlier Detection
Choose what drives the signal:
Volume
Body Size
Any (either becomes an outlier)
All (both must confirm)
This flexibility helps highlight genuine strength or weakness in price action.
🎨 Dynamic Candle Coloring
The script colors candles based on statistical threshold levels:
Normal Moves
Large Moves
Extreme Moves (High Impact)
You can display them as colored bars or full candles, depending on your charting preference.
📉 Low Volume Detection
Spot weak or imbalanced price moves with a dedicated low-volume algorithm:
Highlight candles with unusually low participation
Option to only show candles where volume is low but body is large (imbalance conditions)
Perfect for identifying fake breakouts or trapped liquidity zones.
⚙️How to use :-
default color schemes:
- Blue -> excheme bullish imbalance
- Green -> large bullish imbalance
- Black -> excheme bearish imbalance
- Red -> large bearish imbalance
- yellow -> low volume bars, indicates "balance", after which volatility usually increases and tends to continue the previous trend
🔔 Built-in Alerts
Receive instant alerts when the script detects:
Extreme Outlier Activity
Large Outlier Activity
Ideal for catching volatility spikes, early trend acceleration, or institutional-level moves.
🎯 What This Helps You Identify
Momentum surges
Volume-based breakouts
Manipulation or low-volume traps
Extreme candle events
Trend strength vs weakness
Liquidity pushes and imbalance signals
This makes it a highly valuable tool for scalpers, intraday traders, swing traders, and anyone relying on volume-price analysis.
Protected script
ForexArchitects
Disclaimer
The information and publications are not meant to be, and do not constitute, financial, investment, trading, or other types of advice or recommendations supplied or endorsed by TradingView. Read more in the Terms of Use.

Volume Color Candle 📊 Volume Color Candle — Advanced Market Strength Visualization
Volume Color Candle is a powerful and visually enhanced tool designed to help traders instantly identify high-impact volume events, body-size anomalies, and market imbalances directly on any chart.
This indicator uses Z-Score statistical modeling to classify candles into Normal, Large, and Extreme categories — giving traders a deeper understanding of momentum, volatility, and unusual market activity.
🔍 Key Features
✅ Multi-Source Outlier Detection
Choose what drives the signal:
Volume
Body Size
Any (either becomes an outlier)
All (both must confirm)
This flexibility helps highlight genuine strength or weakness in price action.
🎨 Dynamic Candle Coloring
The script colors candles based on statistical threshold levels:
Normal Moves
Large Moves
Extreme Moves (High Impact)
You can display them as colored bars or full candles, depending on your charting preference.
📉 Low Volume Detection
Spot weak or imbalanced price moves with a dedicated low-volume algorithm:
Highlight candles with unusually low participation
Option to only show candles where volume is low but body is large (imbalance conditions)
Perfect for identifying fake breakouts or trapped liquidity zones.
⚙️How to use :-
default color schemes:
- Blue -> excheme bullish imbalance
- Green -> large bullish imbalance
- Black -> excheme bearish imbalance
- Red -> large bearish imbalance
- yellow -> low volume bars, indicates "balance", after which volatility usually increases and tends to continue the previous trend
🔔 Built-in Alerts
Receive instant alerts when the script detects:
Extreme Outlier Activity
Large Outlier Activity
Ideal for catching volatility spikes, early trend acceleration, or institutional-level moves.
🎯 What This Helps You Identify
Momentum surges
Volume-based breakouts
Manipulation or low-volume traps
Extreme candle events
Trend strength vs weakness
Liquidity pushes and imbalance signals
This makes it a highly valuable tool for scalpers, intraday traders, swing traders, and anyone relying on volume-price analysis.

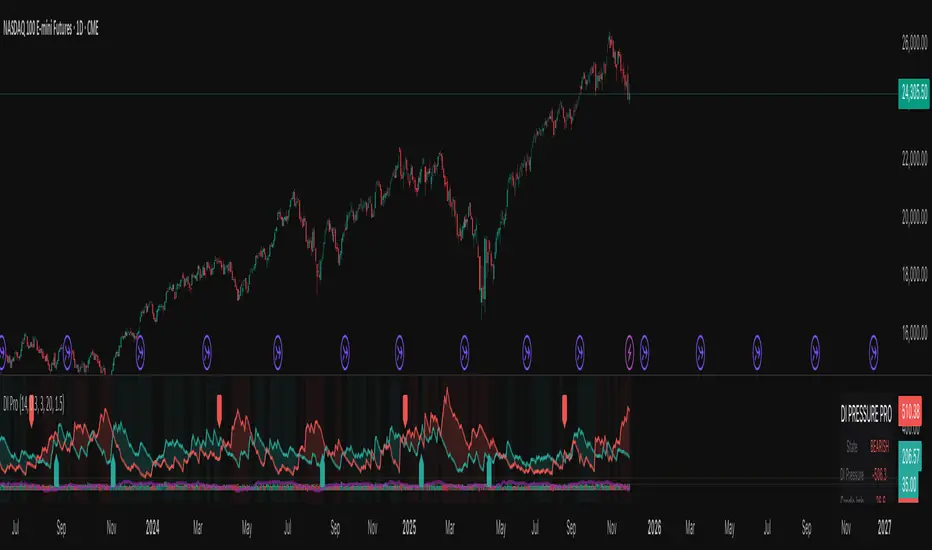
Nexural DI Pressure ImbalanceNexural DI Pressure Imbalance
Overview
This indicator combines traditional Directional Index (DI) analysis with modern order flow concepts to help you identify buying and selling pressure in the market. I built this because I wanted something that goes beyond basic DI calculations and actually shows what's happening inside each candle.
What Makes This Different
Instead of just looking at directional movement, this indicator analyzes:
Candle-by-candle pressure - Where did the price actually close within the candle's range? This tells us who won the battle between buyers and sellers.
Volume-weighted calculations - Low volume moves get less weight, because they're less reliable.
Order flow approximation - Estimates buying versus selling volume based on price action and where the close ended up.
Cumulative delta - Tracks the running total of buy/sell imbalance over your chosen period.
How to Read It
The main display shows two lines:
DI+ (green) - Buying pressure
DI- (red) - Selling pressure
When DI+ is above DI-, buyers are in control. When DI- is on top, sellers have the edge.
The volume bars at the bottom change color based on whether the candle was bought or sold, with brighter colors indicating stronger order flow.
The candle imbalance histogram (middle section) shows you the internal pressure within each candle. Positive values mean the close was near the high, negative means it closed near the low.
The purple cumulative delta line tracks the overall buying/selling imbalance over time. When it's rising, there's more buying volume. When falling, more selling.
Info Table
The table in the top-right gives you a quick summary:
State - Current market condition (Strong Buy, Bullish, Bearish, Strong Sell)
DI Pressure - Net directional pressure
Candle Imb - Current candle imbalance score
Delta - Cumulative volume delta
Composite - Combined score from all components
Volume - Current volume level (Low, Normal, High, Extreme, Strong)
Flow - Order flow strength (Weak, Moderate, Strong)
Settings You Can Adjust
Core Settings:
DI Length - How many periods to use for DI calculation (default 14)
Volume Weighting - Whether to reduce the impact of low volume bars
ATR Normalization - Scales the indicator to match current volatility
Low Volume Threshold - What counts as "low volume" (default 0.3 = 30% of average)
Candle Analysis:
Imbalance Smoothing - How much to smooth the candle imbalance line
Delta Lookback Period - How far back to track cumulative delta
Order Flow:
Flow Sensitivity - Higher values = stricter requirements for "strong flow" signals
Visual:
Toggle various display elements on/off to clean up your chart
Alerts
The indicator includes several alert conditions:
Strong buy/sell signals (DI crossovers with strong volume)
Candle imbalance flips (pressure shifts)
Extreme pressure conditions (composite score above 70 or below -70)
Divergences between price and indicator
Strong order flow detection
Best Use Cases
This works well for:
Confirming trend strength
Identifying potential reversals when price and pressure diverge
Spotting low-conviction moves (weak volume plus conflicting signals)
Finding high-probability entries when all components align
A Few Notes
Low volume periods get a gray background warning - be careful with signals during these times
The indicator combines multiple analysis methods, so you're getting a more complete picture than any single metric alone
Extreme readings (bright green/red backgrounds) often precede reversals or consolidation
Works on any timeframe, though I find it most useful on 5-minute charts and up
This is not a magic bullet, but it does help you see what's actually happening beneath price action. Use it alongside your other analysis tools and always manage your risk.
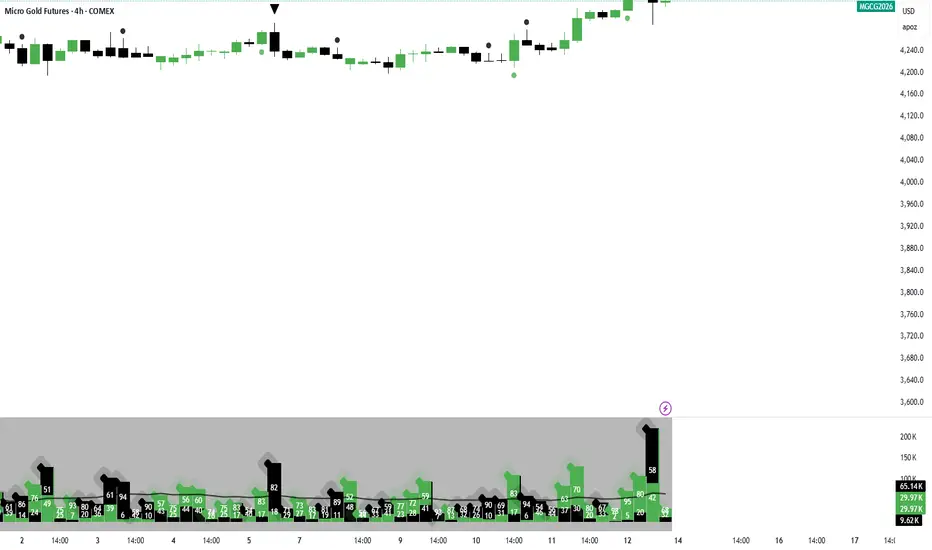
Montosca's Volume Delta Volume Delta Montosca - Indicator Summary
Volume Delta Montosca is a specialized Pine Script indicator for TradingView designed to analyze buying and selling pressure within each candle. It focuses on identifying high-impact volume events combined with strong directional dominance.
Key Features
1. Volume Delta Visualization
Displays volume bars split into Buy Volume (Blue) and Sell Volume (Red).
Includes centered text labels inside the bars showing the exact percentage of buy and sell volume for clear readability.
2. Signal Generation Logic (Triangles)
The indicator generates Buy (Blue Triangle) and Sell (Red Triangle) signals based on two strict criteria that must be met simultaneously:
Criterion A: Significant Volume (SMA Filter)
The current candle's volume must exceed a dynamic threshold.
This threshold is calculated using a Simple Moving Average (SMA) of the volume (e.g., 20 periods) multiplied by a user-defined Adjustment Factor (e.g., 150%).
Example: If the factor is 150%, the volume must be 1.5x higher than the average.
Criterion B: Directional Dominance
The candle must show strong internal conviction.
The Buy Percentage (for long signals) or Sell Percentage (for short signals) must exceed a specific Dominance Threshold (e.g., 70%).
3. Simplified Analysis
Alerts: Integrated alert conditions for both Buy and Sell signals for automated trading or notifications.
Volume Category IndicatorThis indicator analyzes historical volume data and categorizes each trading period into one of six levels: Outlier, Low, Below Average, Average, Above Average, or High.
How it works:
1. Filters out extremities - Excludes abnormal volume spikes/drops using standard deviation (default: 3σ threshold) to create a "clean" dataset
2. Calculates percentiles - Divides the clean volume distribution into quintiles (20th, 40th, 60th, 80th percentiles)
3. Reduces noise - Applies a 3-period moving average to volume to prevent rapid category changes
4. Categorizes current volume - Compares today's smoothed volume against historical percentiles to assign a category
5. Visual display - Shows volume bars in grayscale (darker = lower volume, lighter = higher volume) with an optional info table
Key parameters:
* Lookback Period (100): How many bars of history to analyze
* Smoothing (3): Moving average length to stabilize categories
* Outlier Threshold (3.0): Standard deviations for filtering extremes
The result is a stable, clean indicator that identifies whether current volume is genuinely low, average, or high relative to recent history—without being thrown off by occasional volume anomalies.

Smart Money Volume by P4 ProviderSmart Money Volume by P4 Provider is a proprietary volume-based tool designed to identify institutional activity across major trading sessions (Asian, London, and New York) with precision. It combines classical Volume Spread Analysis (VSA) with dynamically calculated session-wise volume averages , tracked in real-time on 1-minute and 5-minute charts.
Built for serious traders, this indicator highlights:
High-Volume Nodes: Automatically marks the highest volume bar of the day with a horizontal level.
Session-Based Volume Intelligence: Tracks and averages volume spikes during key sessions using both M1 and M5 granularities.
Smart Institutional Footprint: Reveals session-specific average volume levels via colored horizontal lines (Green for Asian, Purple for London, Red for NY).
Volume Strength Color Coding: Visualizes bullish/bearish volume intensity via dynamic bar coloring.
Ideal for scalpers, intraday traders, and smart money trackers seeking to align with institutional footprints.
Important Notes:
Time Zone Setup Required: Please adjust the UTC offset in the script according to your local time for accurate session alignment.
Optimized for 1-minute and 5-minute charts only.
For educational and analytical use. Not a buy/sell signal generator.
Developed by P4 Provider , this tool is part of a broader ecosystem focused on elite trading tools powered by real market behavior.

ZVOL — Z-Score Volume Heatmapⓩ ZVOL transforms raw volume into a statistically calibrated heatmap using Z-score thresholds. Unlike classic volume indicators that rely on fixed MA comparisons, ZVOL calculates how many standard deviations each volume bar deviates from its mean. This makes the reading adaptive across timeframes and assets, in order to distinguish meaningful crowd behavior from random volatility.
📊 The core display is a five-zone histogram, each encoded by color and statistical depth. Optional background shading mirrors these zones across the entire pane, revealing subtle compression or structural rhythm shifts across time. By grounding the volume reading in volatility-adjusted context, ZVOL inhibits impulsive trading tactics by compelling the structure, not the sentiment, to dictate the signal.
🥵 Heatmap Coloration:
🌚 Suppressed volume — congestion, coiling phases
🩱 Stable flow — early trend or resting volume
🏀 High activity — emerging pressure
💔 Extreme — possible climax or institutional print
🎗️ A dynamic Fibonacci-based 21:34-period EMA ribbon overlays the histogram. The fill area inverts color on crossover, providing a real-time read on tempo, expansion, or divergence between price structure and crowd effort.
💡 LTF Usage Suggestions:
• Confirm breakout legs when orange or red zones align with range exits
• Fade overextended moves when red bars appear into resistance
• Watch for rising EMAs and orange volume to front-run impulsive moves
• Combine with volatility suppression (e.g. ATR) to catch compression → expansion transitions
🥂 Ideal Pairings:
• OBVX Conviction Bias — to confirm directional intent behind volume shifts
• SUPeR TReND 2.718 — for directional filters
• ATR Turbulence Ribbon — to detect compression phases
👥 The OBVX Conviction Bias adds a second dimension to ZVOL by revealing whether crowd effort is aligning with price direction or diverging beneath the surface. While ZVOL identifies statistical anomalies in raw volume, OBVX tracks directional commitment using cumulative volume and moving average cross logic. Use them together to spot fake-outs, anticipate structure-confirmed breakouts, or time pullbacks with volume-based conviction.
🔬 ZVOL isn’t just a volume filter — it’s a structural lens. It reveals when crowd effort is meaningful, when it's fading, and when something is about to shift. Designed for structure-aware traders who care about context, not noise.

Multiple AVWAP [OmegaTools]The Multiple AVWAP indicator is a sophisticated trading tool designed for professional traders who require precision in volume-weighted price tracking. This indicator allows for the deployment of multiple Anchored Volume Weighted Average Price (AVWAP) calculations simultaneously, offering deep insights into price movements, dynamic support and resistance levels, and trend structures across multiple timeframes.
This indicator caters to both institutional and retail traders by integrating flexible anchoring methods, multi-timeframe adaptability, and enhanced visualization features. It also includes deviation bands for statistical analysis, making it a comprehensive volume-based trading solution.
Key Features & Functionalities
1. Multiple AVWAP Configurations
Users can configure up to four distinct AVWAP calculations to track different market conditions.
Supports various anchoring methods:
Fixed: A traditional AVWAP that starts from a defined historical point.
Perpetual: A rolling VWAP that continuously adjusts over time.
Extension: An extension-based AVWAP that projects from past calculations.
High Volume: Anchors AVWAP to the highest volume bar within a specified period.
None: Option to disable AVWAP calculation if not required.
2. Advanced Deviation Bands
Implements standard deviation bands (1st and 2nd deviation) to provide a statistical measure of price dispersion from the AVWAP.
Serves as a dynamic method for identifying overbought and oversold conditions relative to VWAP pricing.
Deviation bands are customizable in terms of visibility, color, and transparency.
3. Multi-Timeframe Support
Users can assign different timeframes to each AVWAP calculation for macro and micro analysis.
Helps in identifying long-term institutional trading levels alongside short-term intraday trends.
4. Z-Score Normalization Mode
Option to standardize oscillator values based on AVWAP deviations.
Converts price movements into a statistical Z-score, allowing traders to measure price strength in a normalized range.
Helps in detecting extreme price dislocations and mean-reversion opportunities.
5. Customizable Visual & Aesthetic Settings
Fully customizable line colors, transparency, and thickness to enhance clarity.
Users can modify AVWAP and deviation band colors to distinguish between different levels.
Configurable display options to match personal trading preferences.
6. Oscillator Mode for Trend & Momentum Analysis
The indicator converts price deviations into an oscillator format, displaying AVWAP strength and weakness dynamically.
This provides traders with a momentum-based perspective on volume-weighted price movements.
User Guide & Implementation
1. Configuring AVWAPs for Optimal Use
Choose the mode for each AVWAP instance:
Fixed (set historical point)
Perpetual (rolling, continuously updated AVWAP)
Extension (projection from past AVWAP levels)
High Volume (anchored to highest volume bar)
None (disables the AVWAP line)
Adjust the length settings to fine-tune calculation sensitivity.
2. Utilizing Deviation Bands for Market Context
Activate deviation bands to see statistical boundaries of price action.
Monitor +1 / -1 and +2 / -2 standard deviation levels for extended price movements.
Consider price action outside of deviation bands as potential mean-reversion signals.
3. Multi-Timeframe Analysis for Institutional-Level Insights
Assign different timeframes to each AVWAP to compare:
Daily VWAP (institutional trading levels)
Weekly VWAP (swing trading trends)
Intraday VWAPs (short-term momentum shifts)
Helps identify where institutional liquidity is positioned relative to price.
4. Activating the Oscillator for Momentum & Bias Confirmation
The oscillator converts AVWAP deviations into a normalized value.
Use overbought/oversold levels to determine strength and potential reversals.
Combine with other indicators (RSI, MACD) for confluence-based trading decisions.
Trading Applications & Strategies
5. Trend Confirmation & Institutional VWAP Tracking
If price consistently holds above the primary AVWAP, it signals a bullish trend.
If price remains below AVWAP, it indicates selling pressure and a bearish trend.
Monitor retests of AVWAP levels for potential trend continuation or reversal.
6. Dynamic Support & Resistance Levels
AVWAP lines act as dynamic floating support and resistance zones.
Price bouncing off AVWAP suggests continuation, whereas breakdowns indicate a shift in momentum.
Look for confluence with high-volume zones for stronger trade signals.
7. Mean Reversion & Statistical Edge Trading
Prices that deviate beyond +2 or -2 standard deviations often revert toward AVWAP.
Mean reversion traders can fade extended moves and target AVWAP re-tests.
Helps in identifying exhaustion points in trending markets.
8. Institutional Liquidity & Volume Footprints
Institutions often execute large trades near VWAP zones, causing price reactions.
Tracking multi-timeframe AVWAP levels allows traders to anticipate key liquidity areas.
Use higher timeframe AVWAPs as macro support/resistance for swing trading setups.
9. Enhancing Momentum Trading with AVWAP Oscillator
The oscillator provides a momentum-based measure of AVWAP deviations.
Helps in confirming entry and exit timing for trend-following trades.
Useful for pairing with stochastic oscillators, MACD, or RSI to validate trade decisions.
Best Practices & Trading Tips
Use in Conjunction with Volume Analysis: Combine with volume profiles, OBV, or CVD for increased accuracy.
Adjust Timeframes Based on Trading Style: Scalpers can focus on short-term AVWAP, while swing traders benefit from weekly/daily AVWAP tracking.
Backtest Different AVWAP Configurations: Experiment with different anchoring methods and lookback periods to optimize trade performance.
Monitor Institutional Order Flow: Identify key VWAP zones where institutional traders may be active.
Use with Other Technical Indicators: Enhance trading confidence by integrating with moving averages, Bollinger Bands, or Fibonacci retracements.
Final Thoughts & Disclaimer
The Multiple AVWAP indicator provides a comprehensive approach to volume-weighted price tracking, making it ideal for professional traders. While this tool enhances market clarity and trade decision-making, it should be used as part of a well-rounded trading strategy with risk management principles in place.
This indicator is provided for informational and educational purposes only. Trading involves risk, and past performance is not indicative of future results. Always conduct your own analysis and due diligence before executing trades.
OmegaTools - Enhancing Market Clarity with Precision Indicators

Volume Stack US Top 40 [Pt]█ Overview
Volume Stack US Top 40 is a versatile TradingView indicator designed to give you an at-a-glance view of market sentiment and volume dynamics across the top 40 U.S. large-cap stocks. Inspired by the popular Saty Volume Stack, this enhanced version aggregates essential volume and price strength data from major tickers on both the NYSE and NASDAQ, and works seamlessly on all timeframes.
█ Key Features
Dynamic Buy / Sell Volume Stack: This indicator dynamically stacks the volume bars so that the side with higher volume appears on top. For example, green over red signals more buy-side volume, while red over green indicates greater sell-side volume.
Cross-Market Analysis: Easily toggle between NYSE and NASDAQ to analyze the most influential U.S. stocks. The indicator automatically loads the correct set of tickers based on your selection.
Flexible Coverage: Choose from Top 10, Top 20, Top 30, or Top 40 tickers to tailor the tool to your desired scope of analysis.
Dynamic Table Display: A neat on-chart table lists the selected ticker symbols along with visual cues that reflect each stock’s strength. You can even remove exchange prefixes for a cleaner look.
█ Inputs & Settings
Market Selector: Choose whether to view data from the NYSE or NASDAQ; the indicator automatically loads the corresponding list of top tickers.
Number of Tickers: Select from ‘Top 10’, ‘Top 20’, ‘Top 30’, or ‘Top 40’ stocks to define the breadth of your analysis.
Color Options: Customize the colors for bullish and bearish histogram bars to suit your personal style.
Table Preferences: Adjust the on-chart table’s display style (grid or one row), text size, and decide whether to show exchange information alongside ticker symbols.
█ Usage & Benefits
Volume Stack US Top 40 is ideal for traders and investors who need a clear yet powerful tool to gauge overall market strength. By combining volume and price action data across multiple major stocks, it helps you:
Quickly assess whether the market sentiment is bullish or bearish.
Confirm trends by comparing volume patterns against intraday price movements.
Enhance your trading decisions with a visual representation of market breadth and dynamic buy/sell volume stacking.
Its intuitive design means you spend less time adjusting complex settings and more time making confident, informed decisions.

RVOL Color-Coded VolumeRVOL Color-Coded Volume Indicator
This tool visualizes volume intensity through color-coded bars in a separate panel, making it easy to identify significant market moves driven by unusual volume.
Key Features:
- Displays volume bars with varying colors and intensities based on RVOL (Relative Volume)
- Shows a customizable moving average line for volume reference
- Includes alert conditions for different RVOL thresholds
Color System:
Blue shades (Bullish):
- Light: Normal volume (RVOL < 1)
- Medium: Above average volume
- Dark: Heavy buying volume
- Solid: Extreme volume surge
Pink shades (Bearish):
- Light: Normal volume (RVOL < 1)
- Medium: Increased selling
- Dark: Heavy selling
- Solid: Extreme selling pressure
Gray shades (Neutral):
- Used when opening and closing prices are equal
- Intensity varies with RVOL level
Additional Features:
- Dotted threshold lines for easy reference
- Background highlighting for extreme volume events
- Data window shows exact RVOL values
- Multiple alert conditions for volume thresholds
The indicator helps traders spot potential trend changes and momentum shifts by highlighting unusual volume patterns without interfering with price analysis.

MarketSmith VolumesThe 'MarketSmith Volumes' is to be used with the 'MarketSmith Indicator' and 'EPS & Sales' in order to mimic fully MarketSmith Graphs with the maximum number of indicators allowed by a free Tradingview Plan: 3
This indicator is no more than a simple volume indicator where all parameters are already adjusted to resemble MarketSmith graphical volumes.
Also you will find integrated:
High Volumes Bars Peak :
They allow us to see peak volumes at a glance.
10-Week Average Volume :
When viewing a weekly chart, this line represents a 10-week moving average volume level. It allows you to see if the current Volume Bar of the week is above or under the average volume traded in the past 10 Weeks.
50-Day Average Volume :
When viewing a daily chart, this line represents a 50-day moving average volume level. Whether or not volume is above or below the average for a certain period could have a significant impact on your stock chart analysis.

ADX Volume Trend
Thie indicator is a modified and upgraded version of the popular ADX tool.
ADX is used to determine the strength of a trend, and also to determine the direction in which the trend is likely to go.
With this script, I have added in the formula the usage of volume, leading to the following functionality.
The length is used to determine the period to calculate the trend strength and direction, and the average is used to then determine the oscillator and to confront the previous line.
The volume average determines how many volumes bars the indicator should use to determine if a volume bar is above or below average if volume mode is selected.
With the volume mode on, you'll get the DI+ and DI- lines, which are by default displayed as a histogram that calculates the difference between the two lines, called "Directional difference", are calculated using also the volume in the formula, multiplying the normal output by the volume multiplier. I suggest using this mode in high-volume markets.
The trend strength difference is the area calculated using the difference between the ADX line and his moving average and can be used to analyze divergences in the swing points.
It has a lot of improvements and new functionalities, like:
- Histogram to show the output at best
- Averages to compare the data
- The option to include the volume inside of the formula
- Other options and esthetic changes
This indicator is created to improve the usability of the popular ADX indicator, including the very important variable of the volumes, in fact, it's the best to use for the Volume Spread Analysis.
