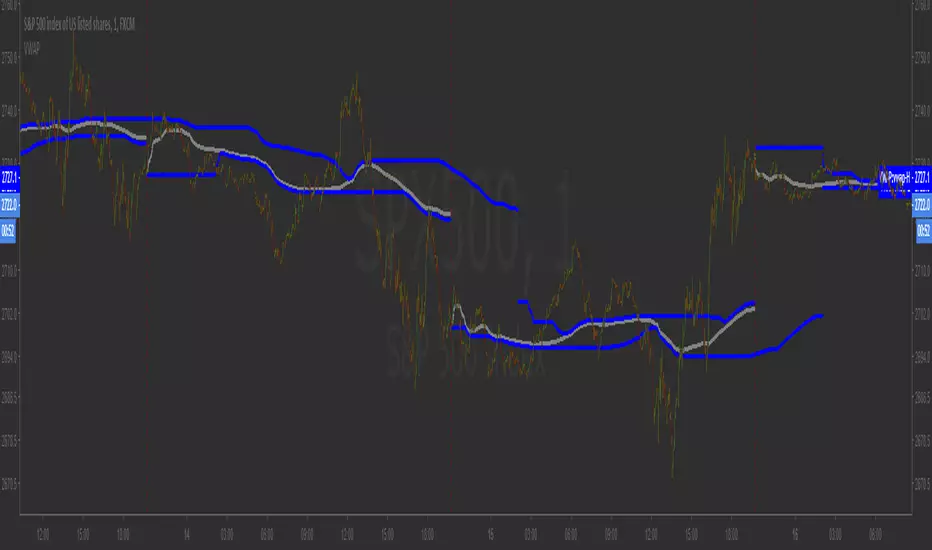
VWAP Heatmap Commodities and Indices V2Here is the Crashcourse trading VWAP for indices and Commodities. Same deal as the forex heatmap. It works best being on a 5 minute chart. Suggestion is to put it on the EURUSD together with the forex heatmap so you can see all the price action on one screen. You are looking for an approach to the VWAP and looking for a bounce. Remember if you have no gradient you have no trade!!!
The instruments covered:
1. US500 / S&P500 Capital.com
2. US100 / Nasdaq Capital.com
2. US30 / Dow Jones Capital.com
4. UK100 / FTSE100 Capital.com
5. JP225 / Nikkei225 Capital.com
6. DAX / DE40 Currency.com
7. AUS200 Capital.com
8. HK50 Capital.com
9. FRA40 / CAC Capital.com
10. Gold Capital.com
11. USoil / WTI Capital.com
12. UKoil / Brent Capital.com
These present the best volume and price data to give you the most reliable signals as far as I have determined.
Improvements coming for this will be to incorporate a slope for the vwap and to make better levels.
חפש סקריפטים עבור "VWAP"

VWAP with editable Volume Time Frame1. This custom indicator is based on TradingView VWAP preset indicator.
2. I added this line input("D", type=input.resolution, title="Time Frame") so I can adjust the time frame for the calculation of VWAP
3. The original VWAP setting is set at "D" while in this custom indicator, we can choose which time frame we prefer to suit our trading style.

VWAP TF-Aware===========================================================
8/Feb/2020 02:57 PM AUTHOR: Brandon Gum
-
DESCRIPTION:
This is a timeframe aware VWAP indicator. The built-in VWAP indicator was changed in late 2019 which resulted in it no longer being restricted to low timeframes. As a result the indicator would plot on higher timeframe charts and create "noise" between candles.
This Version of vwap only displays vwap on 30 minute and below times frames.
===========================================================
VWAP Bands by PKTELUGUTRADERThe VWAP bands are like moving-average bands, but instead of being based on a simple or exponential moving average, they are calculated around the Volume Weighted Average Price (VWAP).
UPDATED LINE COLORS
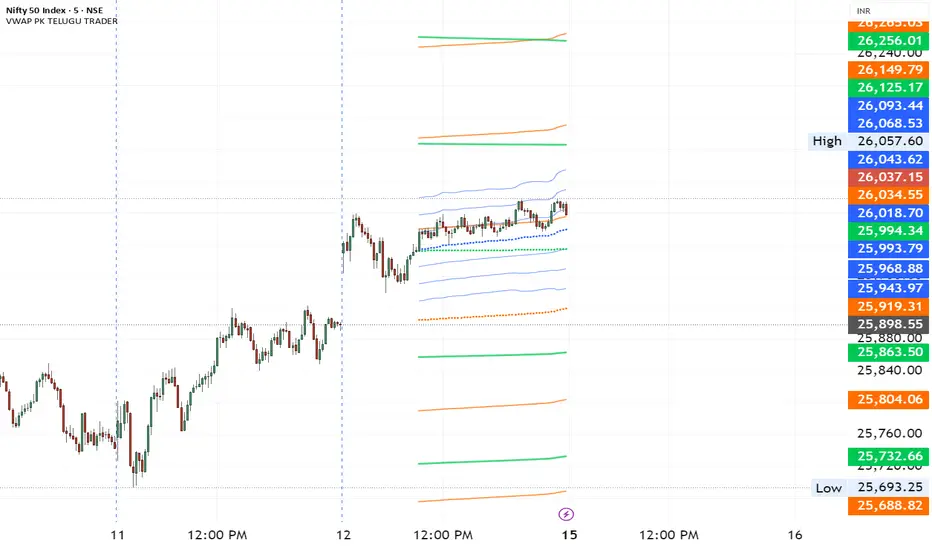
VWAP MTF - you can change VWAP HTF for your needs
- you can also change source of input for VWAP calc (ohlc4, hl2, close ect.)

SureTradeFX VWAP VWAP (Volume Weighted Average Price) is a volume-weighted average price over a specific period. Traders and institutions use it to see the “true” price based on both price and traded volume, not just price alone.

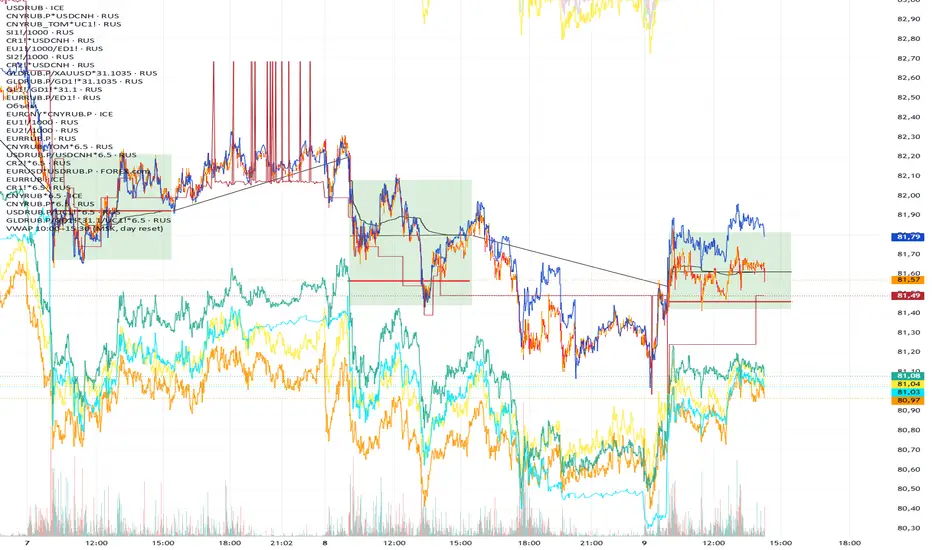
VWAP 10:00–15:00 (MSK, daily reset)Calculates the volume-weighted average price (VWAP) from 10:00 to 15:00 MSK.
The data is used to determine the funding rate of MOEX perpetual futures by comparing the average price of the perpetual contract with the official Central Bank exchange rate on the following day.


"VWAP Multi-Timeframe Pro - 6 VWAPs + Session Analysis"═════════════════════════════════════════════════════════════════════════════
VWAP MULTI-TIMEFRAME PRO - COMPLETE TUTORIAL
By Alphaomega18 (OA18)
═══════════════════════════════════════════════════════════════════════════════
📌 DESCRIPTION
VWAP Multi-Timeframe Pro is a professional trading tool that simultaneously
displays 6 different VWAPs with customizable sessions and dynamic standard
deviation bands. Ideal for day trading, swing trading, and institutional
order flow analysis.
═══════════════════════════════════════════════════════════════════════════════
🎯 KEY FEATURES
✅ 3 CUSTOMIZABLE SESSION VWAPS
• Asia Session: Configurable hours (default 0h-8h Paris time)
• London Session: Configurable hours (default 8h-16h Paris time)
• NY Session: Configurable hours (default 15h30-22h Paris time)
• Each session automatically stops at end time
• Customizable colors and thickness for each session
✅ 3 STANDARD TIMEFRAME VWAPS
• Daily VWAP (resets at midnight)
• Weekly VWAP (resets on Monday)
• Monthly VWAP (resets on 1st of month)
✅ ADVANCED STANDARD DEVIATION BANDS
• 3 levels of standard deviation (1σ, 2σ, 3σ)
• Timeframe selection for bands (Asia/London/NY/Daily/Weekly/Monthly)
• Colored zones for quick extreme identification
• Perfect for mean reversion trading
✅ DYNAMIC LABELS
• Real-time value display
• Labels visible only during active sessions
• Adjustable size (tiny/small/normal/large)
• Automatic positioning
✅ ALERT SYSTEM
• Price / Daily VWAP crossover
• Price reaching ±3σ bands
• Real-time notifications
═══════════════════════════════════════════════════════════════════════════════
📖 INSTALLATION GUIDE
STEP 1: Add the indicator
1. Open TradingView
2. Click on "Indicators" at the top of the chart
3. Search for "VWAP Multi-Timeframe Pro" or "Alphaomega18"
4. Click to add the indicator to your chart
STEP 2: Basic configuration
1. Click on the ⚙️ (settings) icon of the indicator
2. You will see 8 parameter groups
3. Start by enabling/disabling the VWAPs you want
═══════════════════════════════════════════════════════════════════════════════
⚙️ DETAILED CONFIGURATION
┌─────────────────────────────────────────────────────────────────────────────┐
│ GROUP 1: VWAP ASIA SESSION │
├─────────────────────────────────────────────────────────────────────────────┤
│ • Show VWAP Asia: YES/NO │
│ • Start Hour: 0 (24h format, 0-23) │
│ • Start Minute: 0 (minutes, 0-59) │
│ • End Hour: 8 │
│ • End Minute: 0 │
│ • Color: Yellow (customizable) │
│ • Line Width: 2 (1-5) │
│ │
│ 💡 EXAMPLE: For Tokyo 1h-9h Paris → Start: 1h00, End: 9h00 │
└─────────────────────────────────────────────────────────────────────────────┘
┌─────────────────────────────────────────────────────────────────────────────┐
│ GROUP 2: VWAP LONDON SESSION │
├─────────────────────────────────────────────────────────────────────────────┤
│ • Show VWAP London: YES/NO │
│ • Start Hour: 8 │
│ • Start Minute: 0 │
│ • End Hour: 16 │
│ • End Minute: 0 │
│ • Color: Aqua (customizable) │
│ • Line Width: 2 (1-5) │
│ │
│ 💡 EXAMPLE: For LSE 9h-17h30 Paris → Start: 9h00, End: 17h30 │
└─────────────────────────────────────────────────────────────────────────────┘
┌─────────────────────────────────────────────────────────────────────────────┐
│ GROUP 3: VWAP NY SESSION │
├─────────────────────────────────────────────────────────────────────────────┤
│ • Show VWAP NY: YES/NO │
│ • Start Hour: 15 │
│ • Start Minute: 30 │
│ • End Hour: 22 │
│ • End Minute: 0 │
│ • Color: Orange (customizable) │
│ • Line Width: 2 (1-5) │
│ │
│ 💡 NOTE: US RTH = 9h30-16h00 ET = 15h30-22h00 Paris time │
└─────────────────────────────────────────────────────────────────────────────┘
┌─────────────────────────────────────────────────────────────────────────────┐
│ GROUPS 4-6: VWAP DAILY, WEEKLY, MONTHLY │
├─────────────────────────────────────────────────────────────────────────────┤
│ Each group has the same options: │
│ • Show VWAP: YES/NO │
│ • Color: Customizable │
│ • Line Width: 1-5 │
└─────────────────────────────────────────────────────────────────────────────┘
┌─────────────────────────────────────────────────────────────────────────────┐
│ GROUP 7: STANDARD DEVIATION BANDS │
├─────────────────────────────────────────────────────────────────────────────┤
│ • Show Bands: YES/NO │
│ • Bands Timeframe: Asia/London/NY/Daily/Weekly/Monthly │
│ • Standard Deviation 1: 1.0 (recommended) │
│ • Standard Deviation 2: 2.0 (recommended) │
│ • Standard Deviation 3: 3.0 (recommended) │
│ • Upper Band Color: Green (customizable) │
│ • Lower Band Color: Red (customizable) │
│ │
│ 💡 Bands are calculated on the selected VWAP │
└─────────────────────────────────────────────────────────────────────────────┘
┌─────────────────────────────────────────────────────────────────────────────┐
│ GROUP 8: DISPLAY │
├─────────────────────────────────────────────────────────────────────────────┤
│ • Show Labels: YES/NO │
│ • Label Size: tiny/small/normal/large │
└─────────────────────────────────────────────────────────────────────────────┘
═══════════════════════════════════════════════════════════════════════════════
🎨 PRESET CONFIGURATIONS
┏━━━━━━━━━━━━━━━━━━━━━━━━━━━━━━━━━━━━━━━━━━━━━━━━━━━━━━━━━━━━━━━━━━━━━━━━━┓
┃ CONFIGURATION 1: SCALPING / INTRADAY DAY TRADING ┃
┣━━━━━━━━━━━━━━━━━━━━━━━━━━━━━━━━━━━━━━━━━━━━━━━━━━━━━━━━━━━━━━━━━━━━━━━━━┫
┃ Chart timeframe: 1min - 5min ┃
┃ ┃
┃ Active VWAPs: ┃
┃ ☑ VWAP Asia : YES (to see overnight range) ┃
┃ ☑ VWAP London : YES (if trading EU session) ┃
┃ ☑ VWAP NY : YES (main US session) ┃
┃ ☑ VWAP Daily : YES (daily reference) ┃
┃ ☐ VWAP Weekly : NO ┃
┃ ☐ VWAP Monthly : NO ┃
┃ ┃
┃ Bands: ┃
┃ Timeframe: NY (if trading US session) ┃
┃ Levels: 1σ, 2σ, 3σ ┃
┃ ┃
┃ Labels: YES, size SMALL ┃
┗━━━━━━━━━━━━━━━━━━━━━━━━━━━━━━━━━━━━━━━━━━━━━━━━━━━━━━━━━━━━━━━━━━━━━━━━━┛
┏━━━━━━━━━━━━━━━━━━━━━━━━━━━━━━━━━━━━━━━━━━━━━━━━━━━━━━━━━━━━━━━━━━━━━━━━━┓
┃ CONFIGURATION 2: STANDARD DAY TRADING ┃
┣━━━━━━━━━━━━━━━━━━━━━━━━━━━━━━━━━━━━━━━━━━━━━━━━━━━━━━━━━━━━━━━━━━━━━━━━━┫
┃ Chart timeframe: 5min - 15min ┃
┃ ┃
┃ Active VWAPs: ┃
┃ ☐ VWAP Asia : NO ┃
┃ ☐ VWAP London : NO ┃
┃ ☑ VWAP NY : YES ┃
┃ ☑ VWAP Daily : YES ┃
┃ ☐ VWAP Weekly : NO ┃
┃ ☐ VWAP Monthly : NO ┃
┃ ┃
┃ Bands: ┃
┃ Timeframe: Daily ┃
┃ Levels: 1σ, 2σ, 3σ ┃
┃ ┃
┃ Labels: YES, size SMALL ┃
┗━━━━━━━━━━━━━━━━━━━━━━━━━━━━━━━━━━━━━━━━━━━━━━━━━━━━━━━━━━━━━━━━━━━━━━━━━┛
┏━━━━━━━━━━━━━━━━━━━━━━━━━━━━━━━━━━━━━━━━━━━━━━━━━━━━━━━━━━━━━━━━━━━━━━━━━┓
┃ CONFIGURATION 3: SWING TRADING ┃
┣━━━━━━━━━━━━━━━━━━━━━━━━━━━━━━━━━━━━━━━━━━━━━━━━━━━━━━━━━━━━━━━━━━━━━━━━━┫
┃ Chart timeframe: 1H - 4H ┃
┃ ┃
┃ Active VWAPs: ┃
┃ ☐ VWAP Asia : NO ┃
┃ ☐ VWAP London : NO ┃
┃ ☐ VWAP NY : NO ┃
┃ ☑ VWAP Daily : YES ┃
┃ ☑ VWAP Weekly : YES ┃
┃ ☐ VWAP Monthly : NO ┃
┃ ┃
┃ Bands: ┃
┃ Timeframe: Weekly ┃
┃ Levels: 1σ, 2σ, 3σ ┃
┃ ┃
┃ Labels: YES, size NORMAL ┃
┗━━━━━━━━━━━━━━━━━━━━━━━━━━━━━━━━━━━━━━━━━━━━━━━━━━━━━━━━━━━━━━━━━━━━━━━━━┛
┏━━━━━━━━━━━━━━━━━━━━━━━━━━━━━━━━━━━━━━━━━━━━━━━━━━━━━━━━━━━━━━━━━━━━━━━━━┓
┃ CONFIGURATION 4: MULTI-SESSION TRADING (FOREX, 24H FUTURES) ┃
┣━━━━━━━━━━━━━━━━━━━━━━━━━━━━━━━━━━━━━━━━━━━━━━━━━━━━━━━━━━━━━━━━━━━━━━━━━┫
┃ Chart timeframe: 15min - 1H ┃
┃ ┃
┃ Active VWAPs: ┃
┃ ☑ VWAP Asia : YES ┃
┃ ☑ VWAP London : YES ┃
┃ ☑ VWAP NY : YES ┃
┃ ☑ VWAP Daily : YES ┃
┃ ☐ VWAP Weekly : NO ┃
┃ ☐ VWAP Monthly : NO ┃
┃ ┃
┃ Bands: ┃
┃ Timeframe: Daily ┃
┃ Levels: 1σ, 2σ, 3σ ┃
┃ ┃
┃ Labels: YES, size SMALL ┃
┗━━━━━━━━━━━━━━━━━━━━━━━━━━━━━━━━━━━━━━━━━━━━━━━━━━━━━━━━━━━━━━━━━━━━━━━━━┛
═══════════════════════════════════════════════════════════════════════════════
📊 SIGNAL INTERPRETATION
┌─────────────────────────────────────────────────────────────────────────────┐
│ PRICE POSITION RELATIVE TO VWAP │
├─────────────────────────────────────────────────────────────────────────────┤
│ Price > VWAP → BULLISH TREND (bulls in control) │
│ Price < VWAP → BEARISH TREND (bears in control) │
│ Price = VWAP → EQUILIBRIUM ZONE (indecision) │
│ Price oscillates → RANGE / CONSOLIDATION │
└─────────────────────────────────────────────────────────────────────────────┘
┌─────────────────────────────────────────────────────────────────────────────┐
│ STANDARD DEVIATION BANDS SIGNALS │
├─────────────────────────────────────────────────────────────────────────────┤
│ Price at +1σ → Normal bullish extension │
│ Price at +2σ → OVERBOUGHT - possible reversal │
│ Price at +3σ → EXTREME OVERBOUGHT - high probability return to VWAP │
│ │
│ Price at -1σ → Normal bearish extension │
│ Price at -2σ → OVERSOLD - possible reversal │
│ Price at -3σ → EXTREME OVERSOLD - high probability return to VWAP │
└─────────────────────────────────────────────────────────────────────────────┘
┌─────────────────────────────────────────────────────────────────────────────┐
│ VWAP CONFLUENCE (POWERFUL SIGNALS) │
├─────────────────────────────────────────────────────────────────────────────┤
│ 3+ VWAPs aligned → VERY STRONG TREND │
│ VWAPs converging → MAJOR SUPPORT/RESISTANCE ZONE │
│ VWAPs diverging → CONSOLIDATION ZONE │
│ Price between 2 → CRITICAL DECISION ZONE │
└─────────────────────────────────────────────────────────────────────────────┘
═══════════════════════════════════════════════════════════════════════════════
💡 TRADING STRATEGIES
╔═════════════════════════════════════════════════════════════════════════════╗
║ STRATEGY 1: MEAN REVERSION ║
╠═════════════════════════════════════════════════════════════════════════════╣
║ TIMEFRAME: 5min - 15min ║
║ VWAP USED: Daily or NY Session ║
║ ║
║ LONG ENTRY RULES: ║
║ 1. Price touches -2σ or -3σ band ║
║ 2. Wait for rejection candle (hammer, pin bar) ║
║ 3. Volume above average ║
║ 4. Enter LONG above rejection candle high ║
║ ║
║ SHORT ENTRY RULES: ║
║ 1. Price touches +2σ or +3σ band ║
║ 2. Wait for rejection candle (shooting star, pin bar) ║
║ 3. Volume above average ║
║ 4. Enter SHORT below rejection candle low ║
║ ║
║ MANAGEMENT: ║
║ • Stop Loss: Beyond ±3σ band ║
║ • Take Profit: Return to VWAP (TP1), opposite VWAP (TP2) ║
║ • Risk/Reward: Minimum 1:2 ║
╚═════════════════════════════════════════════════════════════════════════════╝
╔═════════════════════════════════════════════════════════════════════════════╗
║ STRATEGY 2: TREND FOLLOWING ║
╠═════════════════════════════════════════════════════════════════════════════╣
║ TIMEFRAME: 15min - 1H ║
║ VWAP USED: Daily + Weekly ║
║ ║
║ LONG ENTRY RULES: ║
║ 1. Price > Daily VWAP AND > Weekly VWAP (confirmed trend) ║
║ 2. Wait for pullback to Daily VWAP ║
║ 3. Price rejects VWAP upward (doesn't break) ║
║ 4. Enter LONG on rejection ║
║ ║
║ SHORT ENTRY RULES: ║
║ 1. Price < Daily VWAP AND < Weekly VWAP (confirmed trend) ║
║ 2. Wait for pullback to Daily VWAP ║
║ 3. Price rejects VWAP downward (doesn't break) ║
║ 4. Enter SHORT on rejection ║
║ ║
║ MANAGEMENT: ║
║ • Stop Loss: Below/above Daily VWAP ║
║ • Take Profit: +1σ/+2σ bands or key support/resistance ║
║ • Trailing Stop: Use VWAP as dynamic trailing ║
╚═════════════════════════════════════════════════════════════════════════════╝
╔═════════════════════════════════════════════════════════════════════════════╗
║ STRATEGY 3: BREAKOUT CONFIRMATION ║
╠═════════════════════════════════════════════════════════════════════════════╣
║ TIMEFRAME: 5min - 30min ║
║ VWAP USED: NY Session + Daily ║
║ ║
║ LONG ENTRY RULES: ║
║ 1. Price consolidates around VWAP (range) ║
║ 2. Breakout above VWAP with HIGH VOLUME ║
║ 3. Simultaneous break of NY VWAP AND Daily VWAP ║
║ 4. Pullback test of VWAP (now support) ║
║ 5. Enter LONG on pullback rejection ║
║ ║
║ SHORT ENTRY RULES: ║
║ 1. Price consolidates around VWAP (range) ║
║ 2. Breakout below VWAP with HIGH VOLUME ║
║ 3. Simultaneous break of NY VWAP AND Daily VWAP ║
║ 4. Pullback test of VWAP (now resistance) ║
║ 5. Enter SHORT on pullback rejection ║
║ ║
║ MANAGEMENT: ║
║ • Stop Loss: Return to other side of VWAP ║
║ • Take Profit: ±2σ bands or measured move from range ║
║ • Failed breakout: Exit immediately if back in range ║
╚═════════════════════════════════════════════════════════════════════════════╝
╔═════════════════════════════════════════════════════════════════════════════╗
║ STRATEGY 4: SESSION HANDOFF ║
╠═════════════════════════════════════════════════════════════════════════════╣
║ TIMEFRAME: 5min - 15min ║
║ VWAP USED: Asia + London + NY ║
║ ║
║ CONCEPT: ║
║ Observe how each session respects or breaks the previous session's VWAP. ║
║ A break indicates sentiment change. ║
║ ║
║ LONG EXAMPLE: ║
║ 1. Asia Session: Price ranges around Asia VWAP ║
║ 2. London Open (8h): Price breaks Asia VWAP upward ║
║ 3. London VWAP forms above Asia VWAP ║
║ 4. NY Open (15h30): Price respects London VWAP (doesn't break) ║
║ 5. BULLISH SIGNAL: All 3 sessions aligned bullish ║
║ 6. Enter LONG on pullback to NY VWAP ║
║ ║
║ MANAGEMENT: ║
║ • Stop: Below current session VWAP ║
║ • Target: +2σ band or previous session high ║
║ • Invalid if: Price breaks below all session VWAPs ║
╚═════════════════════════════════════════════════════════════════════════════╝
═══════════════════════════════════════════════════════════════════════════════
🔔 ALERT CONFIGURATION
STEP 1: Create an alert
1. Click on "Alerts" button (alarm icon) top right
2. Click "Create alert"
3. In "Condition", select "VWAP Multi-Timeframe Pro"
STEP 2: Choose alert type
• Price > Daily VWAP: Alert when price crosses Daily VWAP upward
• Price < Daily VWAP: Alert when price crosses Daily VWAP downward
• Price at +3σ: Alert when price reaches extreme upper band
• Price at -3σ: Alert when price reaches extreme lower band
STEP 3: Configure alert
• Frequency: "Once per bar close" (recommended)
• Expiration: Set according to your needs
• Actions: Popup + Email + Mobile notification
RECOMMENDED ALERTS FOR DAY TRADING:
✓ Price crosses Daily VWAP (up and down)
✓ Price at ±3σ on NY Session VWAP
✓ Combine with other indicators for confirmation
═══════════════════════════════════════════════════════════════════════════════
💼 SPECIFIC USE CASES
┏━━━━━━━━━━━━━━━━━━━━━━━━━━━━━━━━━━━━━━━━━━━━━━━━━━━━━━━━━━━━━━━━━━━━━━━━━┓
┃ TRADING MNQ (E-MINI NASDAQ 100) ┃
┣━━━━━━━━━━━━━━━━━━━━━━━━━━━━━━━━━━━━━━━━━━━━━━━━━━━━━━━━━━━━━━━━━━━━━━━━━┫
┃ Optimal configuration: ┃
┃ • Timeframe: 5min ┃
┃ • VWAP Asia: 0h-8h (see overnight range) ┃
┃ • VWAP NY: 15h30-22h (RTH session) ┃
┃ • VWAP Daily: Active ┃
┃ • Bands: NY Session, 1σ/2σ/3σ ┃
┃ ┃
┃ Strategy: ┃
┃ 1. At 15h30: Observe if price respects or breaks Asia VWAP ┃
┃ 2. Enter in NY VWAP direction if confluence with Daily ┃
┃ 3. Use ±2σ bands for targets ┃
┃ 4. Stop below/above NY VWAP ┃
┗━━━━━━━━━━━━━━━━━━━━━━━━━━━━━━━━━━━━━━━━━━━━━━━━━━━━━━━━━━━━━━━━━━━━━━━━━┛
┏━━━━━━━━━━━━━━━━━━━━━━━━━━━━━━━━━━━━━━━━━━━━━━━━━━━━━━━━━━━━━━━━━━━━━━━━━┓
┃ TRADING FOREX EUR/USD ┃
┣━━━━━━━━━━━━━━━━━━━━━━━━━━━━━━━━━━━━━━━━━━━━━━━━━━━━━━━━━━━━━━━━━━━━━━━━━┫
┃ Optimal configuration: ┃
┃ • Timeframe: 15min ┃
┃ • VWAP Asia: 0h-8h ┃
┃ • VWAP London: 8h-16h (most liquid EUR/USD session) ┃
┃ • VWAP NY: 14h-22h (US overlap) ┃
┃ • Bands: London Session ┃
┃ ┃
┃ Strategy: ┃
┃ 1. London Session (8h): Trade in Asia breakout direction ┃
┃ 2. NY Session (14h): Observe London/NY VWAP confluence ┃
┃ 3. Exit before 22h (end of liquidity) ┃
┗━━━━━━━━━━━━━━━━━━━━━━━━━━━━━━━━━━━━━━━━━━━━━━━━━━━━━━━━━━━━━━━━━━━━━━━━━┛
┏━━━━━━━━━━━━━━━━━━━━━━━━━━━━━━━━━━━━━━━━━━━━━━━━━━━━━━━━━━━━━━━━━━━━━━━━━┓
┃ TRADING US STOCKS (AAPL, TSLA, etc.) ┃
┣━━━━━━━━━━━━━━━━━━━━━━━━━━━━━━━━━━━━━━━━━━━━━━━━━━━━━━━━━━━━━━━━━━━━━━━━━┫
┃ Optimal configuration: ┃
┃ • Timeframe: 5min or 15min ┃
┃ • VWAP NY: 15h30-22h (RTH only) ┃
┃ • VWAP Daily: Active ┃
┃ • VWAP Weekly: Active (for swing) ┃
┃ • Bands: Daily ┃
┃ ┃
┃ Strategy: ┃
┃ 1. Pre-market: Analyze sentiment vs Daily VWAP ┃
┃ 2. Open (15h30): Confirm direction with NY VWAP ┃
┃ 3. Institutional orders visible at Daily/Weekly VWAP confluence ┃
┗━━━━━━━━━━━━━━━━━━━━━━━━━━━━━━━━━━━━━━━━━━━━━━━━━━━━━━━━━━━━━━━━━━━━━━━━━┛
═══════════════════════════════════════════════════════════════════════════════
⚠️ COMMON MISTAKES TO AVOID
❌ MISTAKE 1: Trading against all VWAPs
→ If price < Daily, Weekly, Monthly VWAP → DON'T buy
→ Wait for confluence or trend change
❌ MISTAKE 2: Ignoring sessions
→ NY VWAP at 8am has NO validity
→ Respect session start/end times
❌ MISTAKE 3: Over-trading VWAP touches
→ Every VWAP touch is NOT a signal
→ Wait for confluence + volume + pattern
❌ MISTAKE 4: Wrong time configuration
→ Check your timezone
→ Adjust hours according to your location
❌ MISTAKE 5: Neglecting volume
→ VWAP crossover without volume is WEAK
→ Volume > average = more reliable signal
❌ MISTAKE 6: Forgetting HTF context
→ Always check higher timeframe
→ Daily chart for intraday, Weekly for swing
❌ MISTAKE 7: Too tight stop loss
→ Place stop BEYOND ±3σ band
→ Give position room to breathe
❌ MISTAKE 8: Using only VWAP
→ COMBINE with: RSI, Volume Profile, Support/Resistance
→ VWAP is a tool, not a complete strategy
═══════════════════════════════════════════════════════════════════════════════
📈 OPTIMIZATION & BACKTESTING
TIPS TO IMPROVE YOUR RESULTS:
1. JOURNAL YOUR TRADES
• Note which VWAP configuration worked
• Which session gives best results
• Which band level (1σ/2σ/3σ) is optimal
2. TEST DIFFERENT PERIODS
• Modify session hours according to your asset
• Crypto: Different 24h sessions
• EU Stocks: Adapt to XETRA/CAC hours
3. ADAPT BANDS
• Volatile assets: Use 1.5σ, 2.5σ, 3.5σ
• Calm assets: Keep standard 1σ, 2σ, 3σ
4. COMBINE WITH OTHER TOOLS
• Volume Profile (POC, VAH, VAL)
• Market Delta / Order Flow
• Horizontal Support/Resistance
• Fibonacci retracements
═══════════════════════════════════════════════════════════════════════════════
🆘 SUPPORT & FAQ
Q: Are times in local time or UTC?
A: Times are in your TradingView chart's timezone.
For Paris, use French local time.
Q: Can I use more than 3 sessions?
A: This version offers 3 customizable sessions. For more, duplicate
the indicator with different configurations.
Q: Does VWAP reset automatically?
A: Yes! Each VWAP resets automatically:
• Sessions: At defined start time
• Daily: At midnight
• Weekly: On Monday
• Monthly: On 1st of month
Q: Why isn't my session VWAP displaying?
A: Check:
1. Session is enabled in settings
2. You are WITHIN session time
3. Hours are correctly configured
Q: Can I export my configurations?
A: Yes, TradingView allows saving indicator templates.
Q: Compatible with free TradingView?
A: Yes, indicator works on all TradingView plans.
═══════════════════════════════════════════════════════════════════════════════
Version 1.0 | © 2025 Alphaomega18
Indicator developed for professional and passionate traders
═══════════════════════════════════════════════════════════════════════════════

VWAP RIBBONVWAP Ribbon Indicator
The VWAP Ribbon Indicator is a comprehensive technical analysis tool designed for TradingView, utilizing multiple Volume-Weighted Average Price (VWAP) calculations across different timeframes (Daily, Weekly, Monthly, Yearly, and Custom) to identify potential trading opportunities. It generates buy/sell signals, detects institutional bias, compression zones, breakouts, false breakouts, and reversions, providing traders with a robust framework for decision-making. The indicator is highly customizable, allowing users to tailor its settings to their trading style and timeframe.
Features
Multi-Timeframe VWAPs: Plots VWAPs for Daily, Weekly, Monthly, Yearly, and a user-defined Custom timeframe, each with configurable deviation bands.
Buy/Sell Signals: Generates signals based on price interactions with VWAPs, rebounds, and crosses, with adjustable sensitivity and minimum conditions.
Institutional Bias: Identifies bullish or bearish institutional bias based on VWAP alignments and slopes.
Compression Zones: Detects areas where VWAPs converge, indicating potential accumulation or distribution phases.
Breakout and False Breakout Detection: Identifies confirmed breakouts and false breakouts after compression zones, with volume and price confirmation.
Reversion Signals: Detects reversions after price excesses beyond VWAP deviation bands, anchored to pivot points.
Custom VWAP: Allows users to define a custom VWAP timeframe (e.g., specific hours, days, weeks) for tailored analysis.
Tactical Panel: Displays real-time signal and market data in a customizable panel (compact or detailed).
Advanced Filters: Incorporates volume, RSI, EMA, and candlestick patterns to enhance signal accuracy.
How to Use
Adding the Indicator:
In TradingView, go to the Pine Editor, paste the provided code, and click "Add to Chart."
The indicator will overlay VWAP lines and deviation bands on your chart, with optional labels and a tactical panel.
Configuration: The indicator is divided into several input groups for easy customization:
⚙️ Activate VWAPs in Signals: Enable or disable Daily, Weekly, Monthly, Yearly, or Custom VWAPs for signal generation.
Visual VWAP Ribbon Settings: Toggle visibility and adjust colors for VWAP lines and deviation bands. Customize the Custom VWAP timeframe (e.g., 4 hours, 2 days).
Buy/Sell Signals: Enable labels for basic signals ("B" for Buy, "S" for Sell), set minimum conditions (1–10), and adjust signal sensitivity (0.1–1.0).
Institutional Bias Conditions: Enable background coloring for bias, set minimum VWAP spacing (%), and optionally require price alignment with VWAPs.
Statistical Signals: Enable reversion labels, adjust lookback periods, and set volume gates for reversions.
VWAP Compression: Enable detection of VWAP convergence zones and breakout/false breakout signals.
Custom Signals: Enable labels for Custom VWAP rebounds with configurable cooldowns.
Pro Filters: Apply advanced filters like minimum VWAP slope, relative price confirmation, volume thresholds, RSI, and EMA weights.
Signal Weight Configuration: Assign weights to various conditions (e.g., price crosses, rebounds) to fine-tune signal scoring.
Tactical Panel: Enable the panel, choose its position (e.g., top-right), and select compact or detailed mode.
Interpreting Signals:
Buy/Sell Signals: Appear as "B" (Buy) or "S" (Sell) labels with detailed tooltips listing triggered conditions (e.g., price crossing Daily VWAP, rebound from lower band). Signals require a minimum number of conditions (default: 3) and a normalized score above the sensitivity threshold (default: 0.5).
Institutional Bias: Background coloring (green for bullish, red for bearish) indicates VWAP alignment (e.g., Daily > Weekly > Monthly) and slope conditions. Neutral bias has no coloring.
Compression Zones: Gray background highlights areas where VWAPs are within a user-defined threshold (default: 0.5%), signaling potential accumulation/distribution.
Breakout Signals: Labeled as "BREAK ▲" or "BREAK ▼" after exiting a compression zone with strong candlestick confirmation and volume.
False Breakout Signals: Labeled as "FALSE ▲" or "FALSE ▼" when price crosses a Daily VWAP band but reverses back, indicating a failed breakout.
Reversion Signals: Labeled as "▲ R ▬ BUY" or "▼ R ▬ SELL" at pivot points after price excesses beyond VWAP bands, confirmed by volume (if enabled).
Custom VWAP Signals: Labeled as "C-BUY" or "C-SELL" for rebounds off the Custom VWAP’s deviation bands, with configurable volume and candlestick filters.
Tactical Panel: Displays the latest signal, price, date, bias, compression status, trend direction, VWAP distances, volume state, and technical summary (slopes, band distances).
Best Practices:
Timeframe Selection: The indicator auto-scales parameters for different timeframes (Daily+, Intraday ≥1h, Sub-hour). Adjust settings like lookbackBars or devThreshold for specific timeframes if autoScaleReversion is disabled.
Signal Sensitivity: Increase signalSensitivity (e.g., 0.7) for stricter signals or decrease (e.g., 0.3) for more frequent signals. Adjust minConditions to balance signal frequency and reliability.
Volume Filters: Enable useVolumeGate or useLiquidityFilter for high-liquidity assets to reduce false signals in low-volume conditions.
Compression and Breakouts: Use compression zones to anticipate breakouts. Enable showBreakoutLabels and showfalseBreakoutLabels to monitor confirmed and failed breakouts.
Custom VWAP: Set a specific timeframe (e.g., 4 hours) for intraday trading or longer periods (e.g., 2 weeks) for swing trading. Enable showCustomSignalLabels for tailored signals.
Reversion Trading: Use reversion signals for mean-reversion strategies, especially in range-bound markets. Adjust devThreshold and pivotLength for sensitivity.
Tactical Panel: Use the detailed panel for a quick overview of market conditions. Compact mode is ideal for minimal screen clutter.
Alerts:
Set up alerts for:
Institutional Bias (Buy/Sell)
VWAP Compression (Start/End)
Basic Buy/Sell Signals
Reversion Signals (Buy/Sell)
Breakout Signals (Bullish/Bearish)
False Breakout Signals (Bullish/Bearish)
Custom VWAP Rebound Signals (Buy/Sell)
Weekly/Monthly/Yearly VWAP Rebound Signals
In TradingView, go to the Alerts tab, select the indicator, and choose the desired condition. Customize alert messages as needed.
Notes
Performance: The indicator uses max_bars_back=5000 and max_labels_count=500 to ensure compatibility with most assets. For low-liquidity assets, consider enabling useLiquidityFilter to avoid noisy signals.
Customization: Experiment with weights in the "Signal Weight Configuration" group to prioritize specific conditions (e.g., increase wReboundD for Daily VWAP rebounds).
Limitations: Signals are based on historical data and VWAP interactions. Always combine with other analysis tools and risk management strategies.
License: This indicator is released under the Mozilla Public License 2.0.

VWAP Suite█ OVERVIEW
This indicator is an attempt to bring all VWAP functionalities under one umbrella suite, the existing VWAPs are great and this was made to provide all functionalities. (pending more updates as well)
█ FEATURES
Multiple VWAPs MTF
Individual Band configuration
Previous vwap closes
Date tracking of previous closes
MTF Options
Enabling the other VWAPS with any timeframe will allow the user to use the "VWAP Anchor" setting to choose what HTF Vwap to be displayed
"Prev Close"
This setting enables all historical closes to be displayed with extension
"Track Dates"
Can be used to keep date information of 2 previous closes and further back
█ HOW TO USE IT
The indicator is quite straight forward in its application, as you would expect of a normal VWAP.
At the top of the settings pane the indicator has some functionality that would control the VWAPs globally, e.g. disabling show bands disables all bands for all the VWAPs.
Each VWAP has individual settings that can be controlled such as coloring, which bands enabled, previous closes, labelling...
█ SUGGESTION
My suggestion for clarity is to use 1 VWAP with bands, and a 2nd with no bands + Previous close enabled at a higher timeframe
█ LIMITATIONS OF PINE (Please read)
I see many users going on different indicators with MTF in mind and trying to use it for LTF data e.g. 1hour chart, and selecting 5min in chart settings.
This is not recommended by the team themselves and should be noted for use always use HTF: www.tradingview.com
To understand how to use VWAP please refer to some education that can be found for free online
Heres an example of a trader using the tool himself: www.youtube.com
█ Future Updates:
Previous Close Line extensions
Previous Highs and Lows of VWAP mapped out for users
Suggestions Welcome!
VWAP Bands [TradingFinder] 26 Brokers Data (Forex + Crypto)🔵 Introduction
Indicators are tools that help analysts predict the price trend of a stock through mathematical calculations on price or trading volume. It is evident that trading volume significantly impacts the price trend of a stock symbol.
The Volume-Weighted Average Price (VWAP) indicator combines the influence of trading volume and price, providing technical analysts with a practical tool.
This technical indicator determines the volume-weighted average price of a symbol over a specified time period. Consequently, this indicator can be used to identify trends and entry or exit points.
🟣 Calculating the VWAP Indicator
Adding the VWAP indicator to a chart will automatically perform all calculations for you. However, if you wish to understand how this indicator is calculated, the following explains the steps involved.
Consider a 5-minute chart. In the first candle of this chart (which represents price information in the first 5 minutes), sum the high, low, and close prices, and divide by 3. Multiply the resulting number by the volume for the period and call it a variable (e.g., X).
Then, divide the resulting output by the total volume for that period to calculate your VWAP. To maintain the VWAP sequence throughout the trading day, it is necessary to add the X values obtained from each period to the previous period and divide by the total volume up to that time. It is worth noting that the calculation method is the same for intervals shorter than a day.
The mathematical formula for this VWAP indicator : VWAP = ∑ (Pi×Vi) / ∑ Vi
🔵 How to Use
Traders might consider the VWAP indicator as a tool for predicting trends. For example, they might buy a stock when the price is above the VWAP level and sell it when the price is below the VWAP.
In other words, when the price is above the VWAP, the price is rising, and when it is below the VWAP, the price is falling. Major traders and investment funds also use the VWAP ratio to help enter or exit stocks with the least possible market impact.
It is important to note that one should not rely solely on the VWAP indicator when analyzing symbols. This is because if prices rise quickly, the VWAP indicator may not adequately describe the conditions. This indicator is generally used for daily or shorter time frames because using longer intervals can distort the average.
Since this indicator uses past data in its calculations, it can be considered a lagging indicator. As a result, the more data there is, the greater the delay.
🟣 Difference Between VWAP and Simple Moving Average
On a chart, the VWAP and the simple moving average may look similar, but these two indicators have different calculations. The VWAP calculates the total price considering volume, while the simple moving average does not consider volume.
In simpler terms, the VWAP indicator measures each day's price change relative to the trading volume that occurred that day. In contrast, the simple moving average implicitly assumes that all trading days have the same volume.
🟣 Reasons Why Traders Like the VWAP Indicator
The VWAP Considers Volume: Since VWAP takes volume into account, it can be more reliable than a simple arithmetic average of prices. Theoretically, one person can buy 200,000 shares of a symbol in one transaction at a single price.
However, during the same time frame, 100 other people might place 200 different orders at various prices that do not total 100,000 shares. In this case, if you only consider the average price, you might be mistaken because trading volume is ignored.
The Indicator Can Help Day Traders: While reviewing your trades, you might notice that the shares you bought at market price are trading below the VWAP indicator.
In this case, there's no need to worry because with the help of VWAP, you always get a price below the average. By knowing the volume-weighted average price of a stock, you can easily make an informed decision about paying more or less than other traders for the stock.
VWAP Can Signal Market Trend Changes: Buying low and selling high can be an excellent strategy for individuals. However, you are looking to buy when prices start to rise and sell your shares when prices start to fall.
Since the VWAP indicator simulates a balanced price in the market, when the price crosses above the VWAP line, one can assume that traders are willing to pay more to acquire shares, and as a result, the market will grow. Conversely, when the price crosses below the line, this can be considered a sign of a downward movement.
🔵 Setting
Period : Indicator calculation time frame.
Source : The Price used for calculations.
Market Ultra Data : If you turn on this feature, 26 large brokers will be included in the calculation of the trading volume.
The advantage of this capability is to have more reliable volume data. You should be careful to specify the market you are in, FOREX brokers and Crypto brokers are different.
Multiplier : Coefficient of band lines.

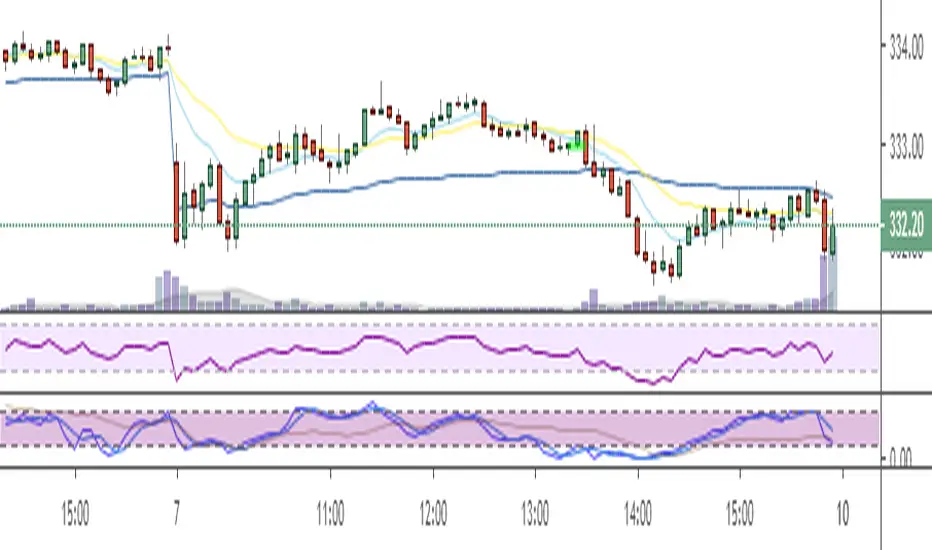
VWAP with RSIVWAP with RSI Indicator
Overview
The VWAP with RSI Indicator is a powerful tool that combines the Volume Weighted Average Price (VWAP) with the Relative Strength Index (RSI) to provide traders with comprehensive insights into price trends, volume-weighted price levels, and market momentum. This dual-indicator setup enhances your trading strategy by offering a clearer understanding of the market conditions, potential entry and exit points, and trend reversals.
Key Features
VWAP (Volume Weighted Average Price):
Calculation: The VWAP is calculated using the high, low, and close prices, weighted by trading volume over a specified period.
Purpose: VWAP provides an average price that reflects the trading volume at different price levels, helping traders identify the true average price over a given period.
Visualization: The VWAP line is plotted in blue on the price chart, indicating the volume-weighted average price.
RSI (Relative Strength Index):
Calculation: RSI is based on the average gains and losses over a specified period (default is 14 periods) and ranges from 0 to 100.
Purpose: RSI measures the speed and change of price movements, identifying overbought or oversold conditions in the market.
Overbought/Oversold Levels:
Overbought: RSI above 70 (red line).
Oversold: RSI below 30 (green line).
Midline: RSI at 50 (gray dashed line).
Visualization: The RSI line changes color based on its value (purple for normal, red for overbought, green for oversold) and is plotted below the price chart.
Background Fill for RSI:
Overbought Area: Shaded red when RSI is above 70.
Oversold Area: Shaded green when RSI is below 30.
Bullish and Bearish Divergence Detection:
Bullish Divergence: Occurs when price forms a lower low, but RSI forms a higher low, indicating potential upward reversal.
Visualization: Bullish divergence points are marked with a green line and labeled "Bull."
Bearish Divergence: Occurs when price forms a higher high, but RSI forms a lower high, indicating potential downward reversal.
Visualization: Bearish divergence points are marked with a red line and labeled "Bear."
Alerts: Conditions for bullish and bearish divergences trigger alerts.
Settings
VWAP Settings:
hideonDWM: Option to hide VWAP on daily or higher timeframes.
src: Source for VWAP calculation (default is hlc3 - (high + low + close)/3).
offset: Offset for plotting the VWAP.
RSI Settings:
rsiLengthInput: Period length for RSI calculation (default is 14).
rsiSourceInput: Source for RSI calculation (default is close price).
maTypeInput: Type of moving average applied to RSI (options: SMA, EMA).
maLengthInput: Length of the moving average applied to RSI.
How to Use
Trend Identification: Use VWAP to identify the average price level and market trend. If the price is above VWAP, it suggests an uptrend, and if below, it suggests a downtrend.
Overbought/Oversold Conditions: Use RSI to identify potential reversal points. RSI above 70 indicates overbought conditions, and below 30 indicates oversold conditions.
Divergence: Look for bullish or bearish divergences between price and RSI to anticipate potential trend reversals.
Conclusion
By combining VWAP and RSI, this indicator provides a robust framework for analyzing market conditions, identifying trends, and making more informed trading decisions. Enhance your trading strategy today with the VWAP with RSI Indicator!

VWAP Composites📊 VWAP Composite - Advanced Multi-Period Volume Weighted Average Price Indicator
═══════════════════════════════════════════════════════════════════
🎯 OVERVIEW
VWAP Composite is an advanced volume-weighted average price (VWAP) indicator that goes beyond traditional single-period VWAP calculations by offering composite multi-period analysis and unprecedented customization. This indicator solves a common problem traders face: traditional VWAP resets at arbitrary intervals (session start, day, week), but significant price action and volume accumulation often spans multiple periods. VWAP Composite allows you to anchor VWAP calculations to any timeframe—or combine multiple periods into a single composite VWAP—giving you a true representation of average price weighted by volume across the exact periods that matter to your analysis.
═══════════════════════════════════════════════════════════════════
⚙️ HOW IT WORKS - CALCULATION METHODOLOGY
📌 CORE VWAP CALCULATION
The indicator calculates VWAP using the standard volume-weighted formula:
• Typical Price = (High + Low + Close) / 3
• VWAP = Σ(Typical Price × Volume) / Σ(Volume)
This calculation is performed across user-defined time periods, ensuring each bar's contribution to the average is proportional to its trading volume.
📌 STANDARD DEVIATION BANDS
The indicator calculates volume-weighted standard deviation to measure price dispersion around the VWAP:
• Variance = Σ / Σ(Volume)
• Standard Deviation = √Variance
• Upper Band = VWAP + (StdDev × Multiplier)
• Lower Band = VWAP - (StdDev × Multiplier)
These bands help identify overbought/oversold conditions relative to the volume-weighted mean, with high-volume price excursions having greater impact on band width than low-volume moves.
📌 COMPOSITE PERIOD METHODOLOGY (Auto Mode)
Unlike traditional VWAP that resets at fixed intervals, Auto Mode creates composite VWAPs by combining the current period with N previous periods:
• Period Span = 1: Current period only (standard VWAP behavior)
• Period Span = 2: Current period + 1 previous period combined
• Period Span = 3: Current period + 2 previous periods combined
• And so on...
Example: A 3-period Weekly composite VWAP calculates from the start of 2 weeks ago through the current week's end, creating a single VWAP that represents 21 days of continuous price and volume data. This provides context about where price stands relative to the volume-weighted average over multiple weeks, not just the current week.
═══════════════════════════════════════════════════════════════════
🔧 KEY FEATURES & ORIGINALITY
✅ DUAL OPERATING MODES
1️⃣ MANUAL MODE (5 Independent VWAPs)
Define up to 5 separate VWAP calculations with custom start/end times:
• Perfect for anchoring VWAP to specific events (earnings, Fed announcements, major reversals)
• Each VWAP has independent color settings for lines and deviation band backgrounds
• Individual control over calculation extension and visual extension (explained below)
• Useful for tracking multiple institutional accumulation/distribution zones simultaneously
2️⃣ AUTO MODE (Composite Period VWAP)
Automatically calculates VWAP across combined time periods:
• Supported periods: Daily, Weekly, Monthly, Quarterly, Yearly
• Configurable period span (1-20 periods)
• Always up-to-date, recalculates on each new bar
• Ideal for systematic analysis across consistent timeframes
✅ DUAL EXTENSION SYSTEM (Manual Mode Innovation)
Most VWAP indicators only offer "on/off" for extending calculations. This indicator provides two distinct extension options:
🔹 EXTEND CALCULATION TO CURRENT BAR
When enabled, continues including new bars in the VWAP calculation after the defined end time. The VWAP value updates dynamically as new volume enters the market.
Use case: You anchored VWAP to a major low 3 weeks ago. You want the VWAP to continue evolving with new volume data to track ongoing institutional positioning.
🔹 EXTEND VISUAL LINE ONLY
When enabled (and calculation extension is disabled), projects the "frozen" VWAP value forward as a reference line. The VWAP value remains fixed at what it was at the end time, but the line and deviation bands visually extend to current price.
Use case: You want to see how price is behaving relative to the VWAP that existed at a specific point in time (e.g., "Where is price now vs. the 5-day VWAP that existed at last Friday's close?").
This dual system gives you unprecedented control over whether you're tracking a "living" VWAP that incorporates new data or using historical VWAP levels as static reference points.
✅ CUSTOMIZABLE STANDARD DEVIATION BANDS
• Adjustable multiplier (0.1 to 5.0)
• Independent background colors with opacity control for each VWAP
• Dashed band lines for easy visual distinction from main VWAP
• Bands extend when visual extension is enabled, maintaining zone visibility
✅ COMPREHENSIVE LABELING SYSTEM
Each VWAP displays:
• Current VWAP value
• Upper deviation band value (High)
• Lower deviation band value (Low)
• Extension status indicator (Calc Extended / Visual Extended)
• Color-coded for quick identification
═══════════════════════════════════════════════════════════════════
📖 HOW TO USE THIS INDICATOR
🎯 SCENARIO 1: EVENT-ANCHORED VWAP (Manual Mode)
Use case: A stock gaps down 15% on earnings and you want to track where institutions are positioning during the recovery.
Setup:
1. Switch to Manual Mode
2. Enable VWAP 1
3. Set Start Time to the earnings gap bar
4. Set End Time to current time (or leave far in future)
5. Enable "Extend Calculation to Current Bar"
6. Watch how price respects the VWAP as a dynamic support/resistance
Interpretation:
• Price above VWAP = buyers in control since the event
• Price testing VWAP from above = potential support
• Volume-weighted standard deviation bands show normal price range
• Price outside bands = potential exhaustion/mean reversion setup
🎯 SCENARIO 2: MULTI-WEEK INSTITUTIONAL ACCUMULATION ZONE (Auto Mode)
Use case: You trade swing setups and want to identify where institutions have been accumulating over the past 3 weeks.
Setup:
1. Switch to Auto Mode
2. Select "Weekly" period type
3. Set Period Span to 3
4. Enable standard deviation bands
Interpretation:
• 3-week composite VWAP shows the true average institutional entry
• Price bouncing off VWAP repeatedly = strong support (institutions defending their average)
• Price breaking below VWAP on high volume = potential distribution
• Deviation bands contracting = consolidation; expanding = volatility increase
🎯 SCENARIO 3: COMPARING MULTIPLE TIME HORIZONS (Manual Mode)
Use case: You want to see short-term vs medium-term vs long-term VWAP alignments.
Setup:
1. Switch to Manual Mode
2. VWAP 1: Last 5 trading days (blue)
3. VWAP 2: Last 10 trading days (orange)
4. VWAP 3: Last 20 trading days (purple)
5. Enable "Extend Calculation" for all
6. Set different background colors for visual separation
Interpretation:
• All VWAPs aligned upward = strong trend across all timeframes
• Price between VWAPs = finding equilibrium between different trader timeframes
• Short-term VWAP crossing long-term VWAP = momentum shift
• Price rejecting at higher-timeframe VWAP = that timeframe's traders defending their average
🎯 SCENARIO 4: HISTORICAL VWAP REFERENCE LEVELS (Manual Mode)
Use case: You want to see where the 1-month VWAP was at each month-end as static reference levels.
Setup:
1. Switch to Manual Mode
2. VWAP 1: Set to last month's start/end dates
3. VWAP 2: Set to 2 months ago start/end dates
4. VWAP 3: Set to 3 months ago start/end dates
5. Disable "Extend Calculation"
6. Enable "Extend Visual Line Only"
Interpretation:
• Each VWAP represents the volume-weighted average for that complete month
• These become static support/resistance levels
• Price returning to old monthly VWAPs = institutional memory/gap fill behavior
• Useful for identifying longer-term value areas
═══════════════════════════════════════════════════════════════════
🎨 CUSTOMIZATION OPTIONS
GENERAL SETTINGS
• Show/hide labels
• Line style: Solid, Dashed, or Dotted
• Standard deviation multiplier (impacts band width)
• Toggle standard deviation bands on/off
MANUAL MODE (Per VWAP)
• Custom start and end times
• Line color picker
• Background color picker (with transparency control)
• Extend calculation option
• Extend visual option
• Show/hide individual VWAPs
AUTO MODE
• Period type selection (Daily/Weekly/Monthly/Quarterly/Yearly)
• Period span (1-20 periods)
• Line color
• Background color (with transparency control)
═══════════════════════════════════════════════════════════════════
💡 TRADING APPLICATIONS
✓ Mean Reversion: Use deviation bands to identify stretched prices likely to return to VWAP
✓ Trend Confirmation: Price sustained above VWAP = bullish bias; below = bearish bias
✓ Support/Resistance: VWAP often acts as dynamic S/R, especially on higher volume periods
✓ Institutional Positioning: Multi-day/week VWAPs show where large players have established positions
✓ Entry Timing: Wait for pullbacks to VWAP in trending markets
✓ Stop Placement: Use VWAP ± standard deviation as volatility-adjusted stop levels
✓ Breakout Confirmation: Breakouts from consolidation with price reclaiming VWAP = stronger signal
✓ Multi-Timeframe Analysis: Compare short vs long-period VWAPs to gauge momentum alignment
═══════════════════════════════════════════════════════════════════
⚠️ IMPORTANT NOTES
• The indicator redraws on each bar to maintain accurate visual representation (uses `barstate.islast`)
• Maximum lookback is limited to 5000 bars for performance optimization
• Time range calculations work across all timeframes but are most effective on intraday to daily charts
• Standard deviation bands assume volume-weighted distribution; extreme events may violate assumptions
• Auto mode always calculates to current bar; use Manual mode for fixed historical periods
═══════════════════════════════════════════════════════════════════
This indicator is open-source. Feel free to examine the code, learn from it, and adapt it to your needs.

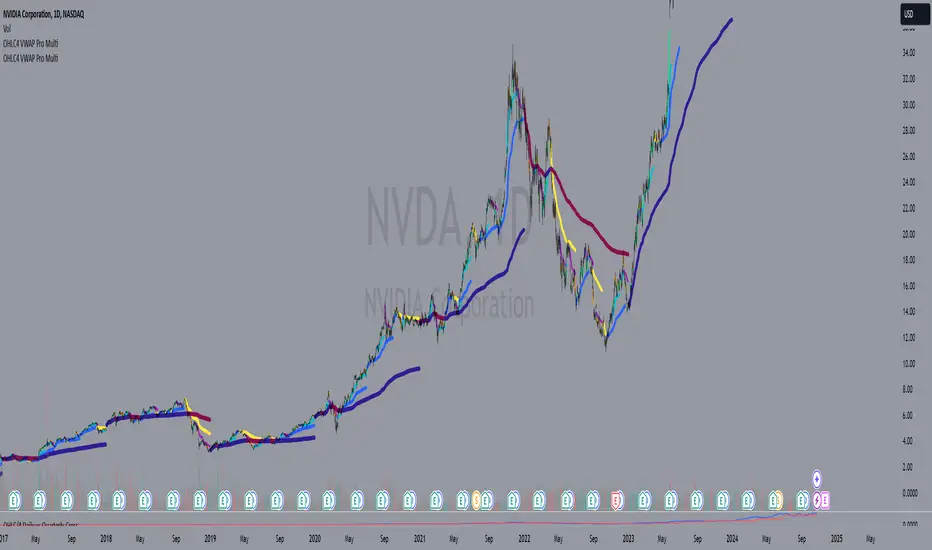
Multi OHLC4 VWAPsVWAP Indicators, which are often restricted to a single timeframe, this script incorporates a multi-timeframe analysis tool that includes Intraday, Weekly, Monthly, Quarterly, and Yearly VWAPs.
Key Features:
Multi-Timeframe Support: Choose from Intraday, Weekly, Monthly, Quarterly, or Yearly VWAP calculations, each tailored to professional trading strategies. The ability to switch between different timeframes enables comprehensive market analysis, catering to both short-term traders and long-term investors.
Advanced Rolling VWAP Options: The script supports both standard VWAP and Rolling VWAP modes, allowing users to reset VWAP calculations based on specific conditions (daily, weekly, monthly, etc.). This functionality enhances dynamic trend recognition.
Customizable Color Schemes: The slope direction of each VWAP line is visually represented with unique color schemes for each timeframe, enabling quick interpretation of price movement. Users can fully customize these colors to suit their trading preferences.
Enhanced Plotting Style: Uses a "line with breaks" style to emphasize trend changes, with line thickness increasing for longer timeframes. This visual hierarchy makes it easy to distinguish between short-term and long-term trends.
How It Helps Traders:
This script combines multiple VWAP calculations into a single overlay, enabling traders to identify support and resistance zones, detect trend shifts, and perform in-depth market analysis effortlessly. By using the OHLC/4 average price instead of the traditional close-only approach, the script offers a balanced perspective, reflecting both intraday volatility and long-term price trends.
Why Choose OHLC/4 VWAP Pro Multi? Many standard VWAP scripts focus only on aesthetics or a single timeframe analysis. This script brings a more comprehensive view to VWAP calculations by implementing a multi-timeframe strategy with customizable rolling features. It aims to fill a gap for traders looking for a more nuanced and professional tool, with the flexibility to adapt to diverse trading strategies.
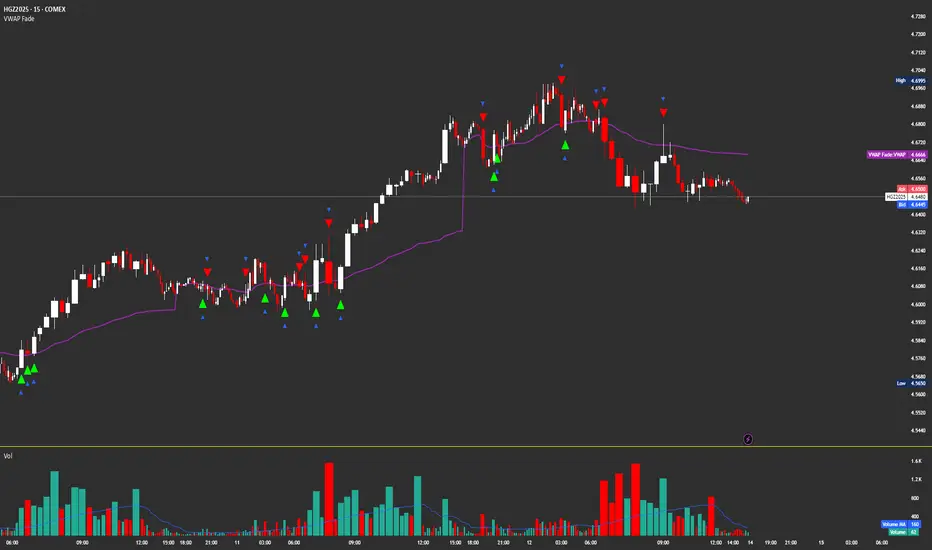
VWAP FadeVWAP fade indicator simple parameters for how it works and the logic behind VWAP fade
You can try other products but recommended for Copper/Silver futures due to how they tend to do the VWAP fade
Identify VWAP retest:
Price moves back into VWAP after trending away.
Fail condition:
Candle touches VWAP but fails to close across it (stays on trend side).
Signal:
Short if price came from below and fails to close above VWAP.
Long if price came from above and fails to close below VWAP.
Confirm with volume spike (optional filter).
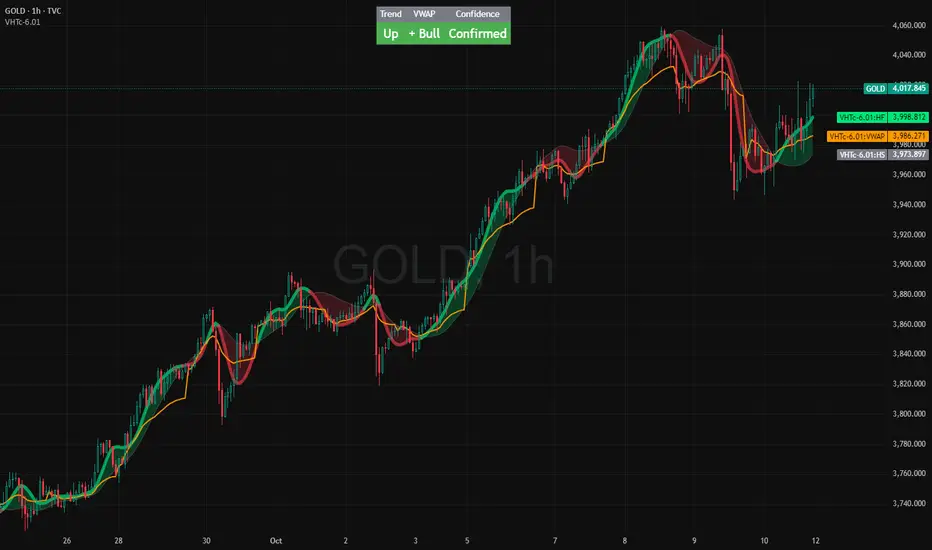
VWAP HMA Trends
It visually syncs Trend, VWAP, and Confidence — giving you instant clarity to trade with calm precision.
⚙️ The Three Core Gauges:
1. 📈 Trend Green for up, Red for down (Trend: Confirms direction)
2. 💰 VWAP Price vs. Volume Weighted Average Price. Institutional Fair Value. (Bull or Bear)
3. 🎯 Confidence Agreement between trend & VWAP. Dont fight the trend.
Bonus Feature: Confidence Turns 🟢 Confident when aligned, 🟡 Cautious when mixed.
Together, these create a clean, visual readout of the market’s health.
🧩 How to Use
Watch the Color Flow:
🟢 Green Cloud → Buyers in control.
🔴 Red Cloud → Sellers in control.
Check VWAP (Orange Line):
Price above VWAP → bullish strength.
Price below VWAP → bearish control.
Hovering at VWAP → indecision. Wait.
---
Act With Discipline:
Trade only when all gauges agree.
Add size only in Confident conditions.
Trim or tighten stops when it shifts to Cautious.
⚡ Quick Reference:
🟢 Green cloud + above VWAP + Confident | Uptrend continuation | Favor long bias
🔴 Red cloud + below VWAP + Confident | Downtrend continuation | Favor short bias
Mixed colors or Cautious: Wait or scale back
Cloud flips color: Possible shift. Reassess bias next bar
⚖️ Disclaimer: Educational and informational use only. Not financial advice. Always use independent judgment and position sizing.
VWAP Daily/Weekly/Monthly - Automatic AnchoredExplanation:
This script plots Volume-Weighted Average Price (VWAP) lines that are automatically anchored to the beginning of key timeframes — daily, weekly, and monthly. VWAP is a widely used trading indicator that shows the average price of an asset weighted by trading volume, making it useful for identifying fair value and institutional trading levels.
The “automatic anchored” feature means that you don’t have to manually select starting points. Instead, the script automatically resets the VWAP at the start of each day, week, or month, depending on the chosen setting. This ensures the VWAP always reflects the true average price for that period, providing traders with a consistent reference for support, resistance, and trend direction across multiple timeframes.
Notice:
On the chart, you may notice visible “jumps” in the VWAP lines. These are intentional. Each jump marks the reset point at the start of a new day, week, or month, depending on the selected setting. This design keeps the VWAP history from the previous period intact, allowing you to clearly see how price interacted with VWAP in past sessions.
By keeping these historical resets, you can easily compare short-term (daily) VWAP behavior against longer-term levels like weekly and monthly VWAP. This provides valuable context, helping you spot when price respects or diverges from fair value across different timeframes.
In short:
Daily VWAP resets at the start of each trading day.
Weekly VWAP resets at the beginning of each trading week.
Monthly VWAP resets at the start of each month.
This makes it easy to analyze how price interacts with VWAP levels across different time horizons without manual adjustments.

Vwap SalvatierraVwap Salvatierra. an indicator that must be accompanied by other volume indicators.
Benefits:
- Long term Vwap.
- Middle Std. deviations, Calculated automatically.
- Previous zones available.
How to use:
when the price is >= stdev+3, look for shorts till came back to vwap
whe the price is <= stdev-3, look for longs till came back to vwap
if the vwap cannot be broken, as resistance, after several attempts, then sell
if the vwap can't be broken, like support, after several tries, then buy.

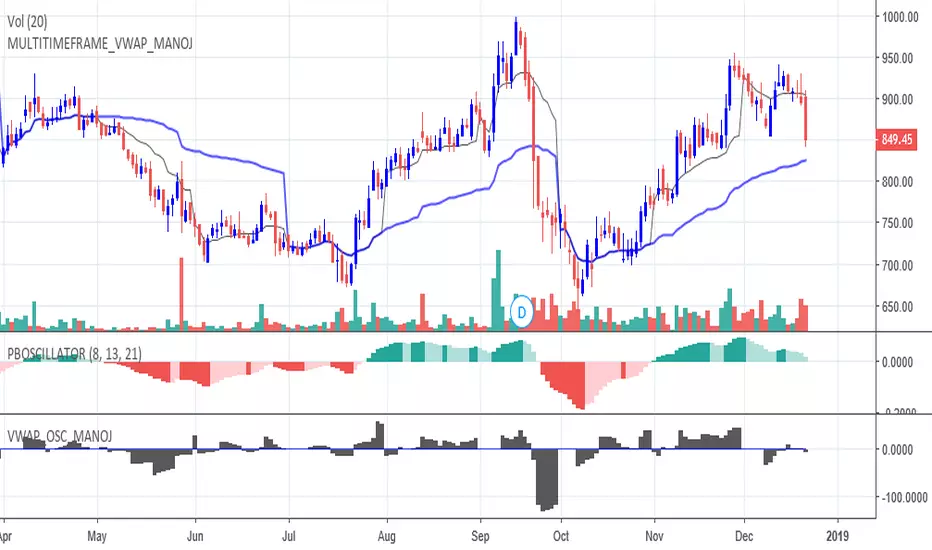
VWAP OSCILLATORVWAP OSCILLATOR plots the difference between shorter time frame vwap and longer time frame vwap.
Preferred combinations are:
Daily chart - Weekly and Monthly or Monthly and Quarterly
Weekly chart - Quarterly and Yearly
Whenever VWAP OSC is above zero, shorts should never be taken.
Whenever VWAP OSC is below zero, longs should never be taken.
However it can also be used as a trend reversal set up. Whenever longer time frame vwap is sloping upwards and vwap oscillator is below zero and started to slope upwards, get ready to buy. Similar logic for shorts.