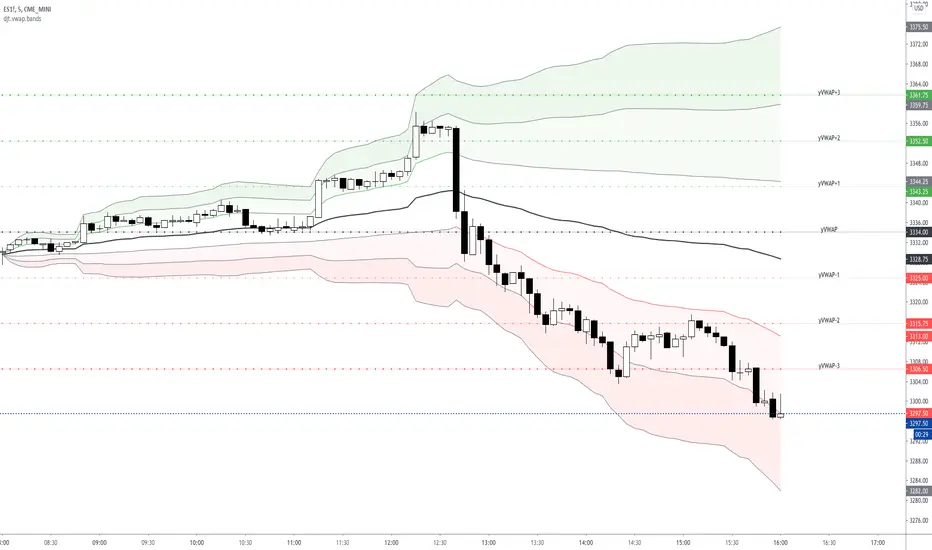
Auto Anchored Volume Weighted Average Price - Custom AVWAP
Based on Brian Shannon's AVWAP - This indicator anchors vwap to the highest high, lowest low and highest volume bar of a user defined lookback period.
In the chart example above on AVAX, the lookback period is set to 90 days
- The blue line depicts AVWAP from the highest bar in in the last 90 dats
- The purple Line is AVWAP from the lowest bar in the last 90 days
- The golden line is AVWAP from the highest volume bar in the last 90 Days
These levels act as a price magnet and strong levels of support and resistance. I use them to identify chart locations for where I want to do business and look for trade setups.
Unlike moving averages, AVWAP will maintain it's chart position no matter the chart resolution. One way to take advantage of this is to wait for price to get to one of these levels, go to lower timeframes and find low risk setups based on your trading strategy.
You can customise the look and feel and which anchors you want displayed. You can use multiple instances with varying lookback periods to display shorter and longer term levels simultaneously
חפש סקריפטים עבור "VWAP"

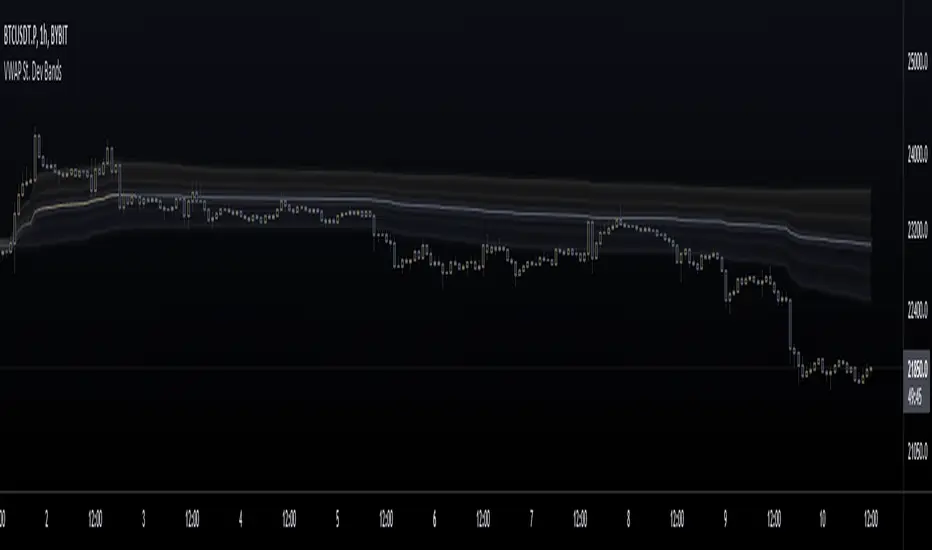
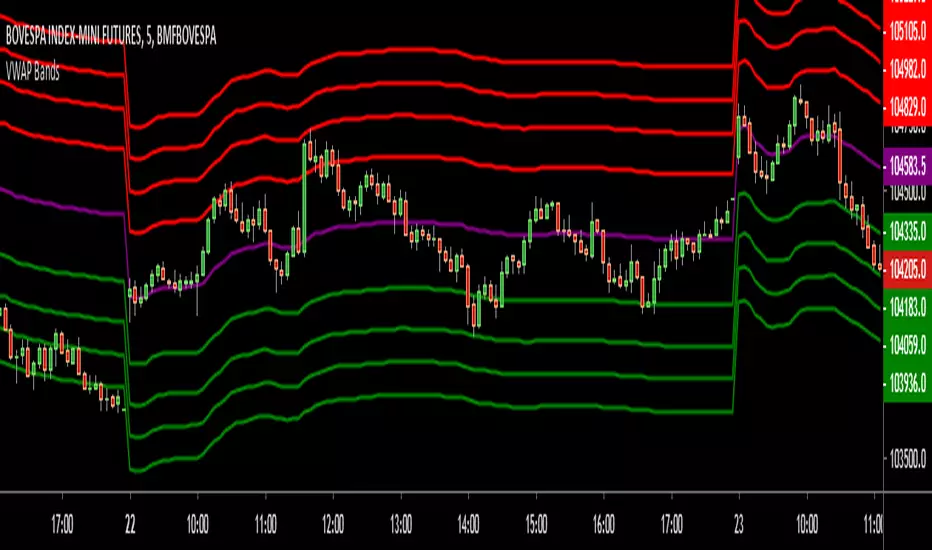
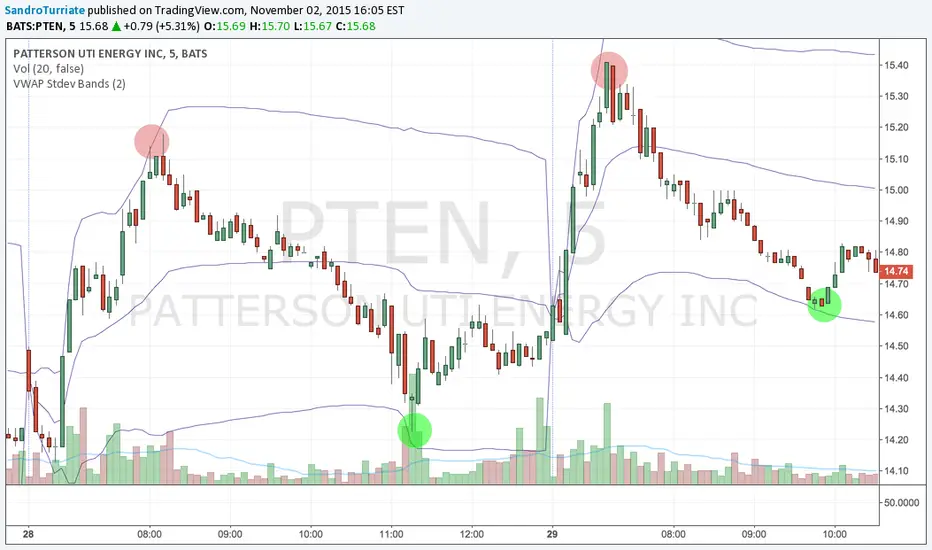
VWAP St. Dev BandsThis indicator allows you to add up to 3 volatility bands to VWAP based on its Standard Deviation.
Best use is for intraday but you can choose higher timeframes too.
For day trading a band of 3 standard deviations usually works well as an overbought/oversold region, allowing for mean reversion trading, but you are free to come up with your own strategies.
Enjoy!

asw Intraday SetBest for intraday trading!
Key levels to watch during intraday include Open price, high & low of the the and of yesterday's.
These lines are plotted on the chart with VWAP in addition.
Hope it helps!

Intraday VWAP weighted averaged KAMA BandsFor Intraday trading!
This indicator helps in figuring out the directivity as well as optimum entry criteria in an Intraday Trade
Most of the times in market,
it makes a good sense for any trader to have a particular bias, the indicator helps provide biases with the potential target bands
Explore it and come up with your own explanation! The indicator is self intuitive
Buy when Blue price tracker line appears
Sell when Orange price tracker line appears
Target the just next band line! or Pivot
Which timeframes it works best ?
It is designed for 1 minute
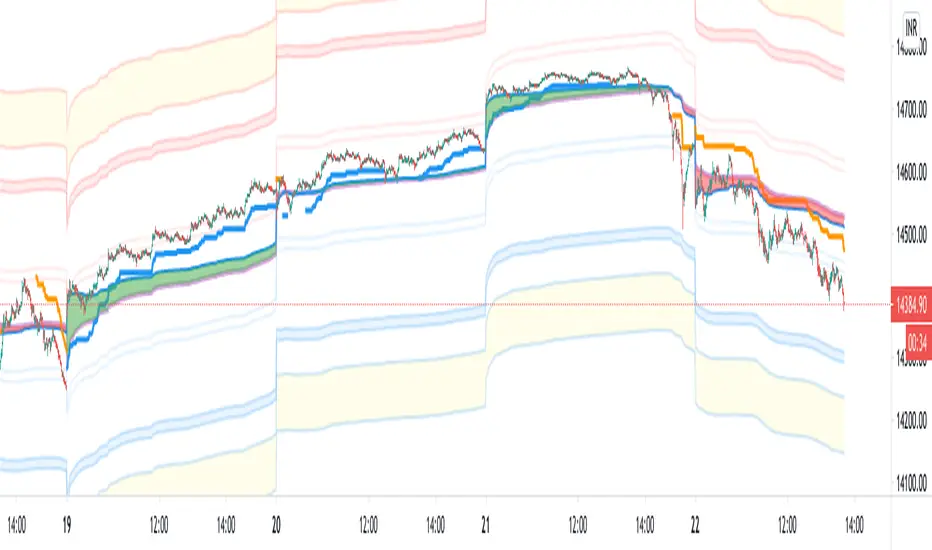


VWAP Standard Deviation Bands w/History & LabelsThis is my bread and butter when trading futures .
- 3 Standard Deviation Bands (Above and Below)
- Yesterday's VWAP and Band Levels
- Labels to help keep track of levels
- Ability to define resolution (I use Daily for my intraday scalping and Weekly/Monthly for context)
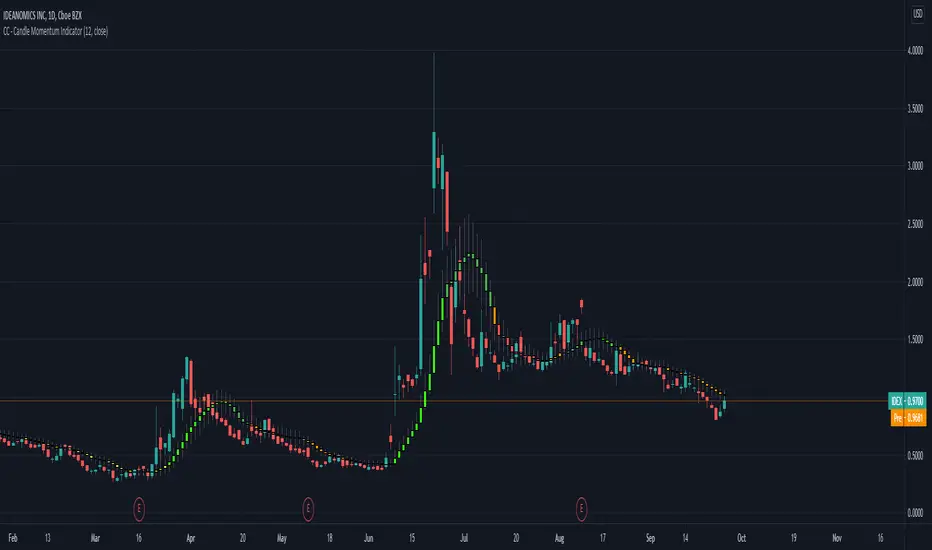
CC - Candle Momentum IndicatorA simple VWAP and SMA smoothing on the candles along with some momentum coloring. Basically, if the "slider" is slid all the way up and it turns red, moving down or losing volume t's probably going down. If it's all the way down and starts turning green, getting bigger and seeing volume, it's probably going up. this is a prototype indicator that I plan to extend using arrays and averages if it is seen as something useful.
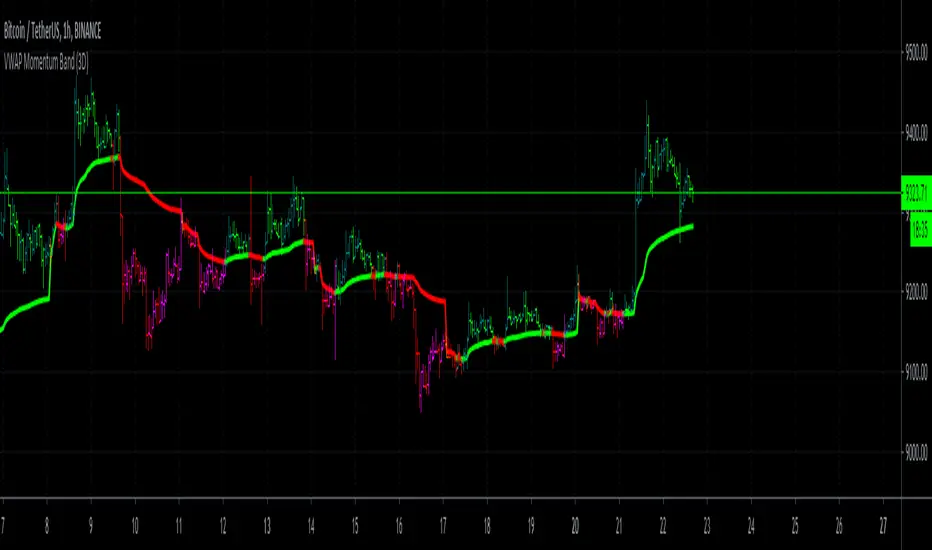
VWAP Momentum BandHow to use:
This should always be used in a bar chart. You as a trader actually just have to look for the color of the band in the middle, it tries to indicate you the coming up price action it also shows you where there is gaining momentum into your direction.
Band is green, what to do ?
Shown with the darker green candles and loosing momentum with the lighter green candles for the upward direction.
Band is red, what to do ?
Shown with the darker red color is momentum to the downwards direction and pink or lighter red color in the bars indicate loosing momentum to the downward direction.
If used correctly this indicator can also be used to feed trading bots via the Trading View Alerts.
Here are a few chart examples:
For example this for daytrading Tesla Stock.
Or daytrading NIO
If there are any questions left open, please send us a direct message!
Vwap Ribbon - JDThis indicator displays a custom timeframe VWAP line
together with several multiples of this timeframe
After a large price move, the price often tends to return to one of these multiples
JD.
#nottradingadvice
#DYOR


VWAP Bands This is a free script I made for the users of my FREE Liquidation Hunter BOT to help visualize vwap offsets over time.

VWAP BandsThis indicator plots distant VWAP lines that serve as support and resistance. You can add more lines from the script.
Good trades!

VWAP Stdev Bands v3Adds timeframe option for Weekly and Monthly timeframes, changes default 2nd and 3rd bands to more common deviations


VWAP Stdev BandsThis indicator plots VWAP with 2x Standard Deviation bands. This could potentially be used to trade a mean reversion type strategy. Only works on intraday charts.
VWAP with FIB range JayyThis is sandbox experiment. The script creates bands around the VWAP based on the opening range on an intraday chart (adjustable in the format section) using fibonacci multipliers (mostly): .236, .382, .5, .618, .786, 1, 1.27 and 1.618. I have not built much flexibility into the script so this is very much an alpha script. Something new for Pippin and Kipp.

SUPERTREND VALIDADO ADX EMAS VWAP # Modular Trading System - SuperTrend + ADX + Multi-Filter Confirmation
## Overview
Professional modular trading system designed for trend-following strategies on 4H timeframes. Features a clean, mobile-optimized interface with customizable filters and real-time status monitoring.
## Core Features
### Validated Components (Backtested)
- **SuperTrend (ATR 10, Multiplier 3.0)**: Primary trend direction filter with visual fill
- **ADX >23**: Trend strength confirmation (14-period)
- Proven performance: 52.11% win rate, 3.162 profit factor over 4 years
### Additional Filters (Optional)
- **DI Spread >9**: Directional movement confirmation
- **Volume > EMA20**: Volume confirmation above 20-period average
- **EMA System**: 7/21/50 with dynamic coloring
- **VWAP**: Daily volume-weighted average price
### Visual Elements
- **SuperTrend Line**: Green (bullish) / Red (bearish) with background fill
- **EMA 7**: Yellow when ADX >23, White when ADX ≤23
- **EMA 21**: Green (price above) / Red (price below)
- **EMA 50**: Blue reference line
- **VWAP**: Orange line
- **PDH/PDL**: Previous day high/low levels
- **EMA Cross Signals**: Small dots marking 7/21 crossovers
### Smart Money Concepts
- Automatic Previous Day High (PDH) / Previous Day Low (PDL) tracking
- Horizontal lines extending from current price
- Clear labeling for support/resistance levels
## Status Dashboard
Compact 2-column table (top-right) shows:
```
FILTERS | STATUS
1. ADX >23 | 47.6 OK / 18.2 NO
2. DI Spread >9 | Bullish / Bearish
3. SuperTrend | Bullish / Bearish
4. Volume >EMA20 | 1.25x OK / 0.14x NO
─────────────────────────────
SIGNAL | BUY / SELL / WAIT
```
Color-coded backgrounds:
- Green: Condition met
- Red: Condition not met
- Yellow: Waiting for confirmation
## Signal Logic
### Entry Conditions
**LONG**: All active filters must align
- SuperTrend bullish (green)
- ADX >23
- DI+ > DI- (if DI Spread enabled)
- Volume > EMA20 (if Volume enabled)
- Price > EMA21 and EMA7 > EMA21 (if EMAs enabled)
**SHORT**: All active filters must align
- SuperTrend bearish (red)
- ADX >23
- DI- > DI+ (if DI Spread enabled)
- Volume > EMA20 (if Volume enabled)
- Price < EMA21 and EMA7 < EMA21 (if EMAs enabled)
### Exit Conditions
- SuperTrend direction change
- Clear "EXIT" markers on chart
### Position Management
- One position per trend (no pyramiding)
- Prevents multiple entries in same direction
- "WAIT" status when conditions partially met
## Settings & Customization
### Filters (Enable/Disable)
**Core Filters:**
- ✓ SuperTrend (VALIDATED)
- ✓ ADX >23 (VALIDATED)
**Additional Filters:**
- ⚠️ DI Spread >9 (EXPERIMENTAL)
- ⚠️ Volume > EMA20 (EXPERIMENTAL)
- ⚠️ EMAs 7/21/50 (EXPERIMENTAL)
**Visual:**
- Show EMA 7/21 Crosses (dots)
### Parameters
**SuperTrend:**
- ATR Period: 10 (default)
- ATR Multiplier: 3.0 (default)
**ADX/DI:**
- ADX Length: 14 (default)
- ADX Threshold: 23 (default)
- DI Spread Threshold: 9 (default)
**Volume:**
- Volume EMA: 20 (default)
**EMAs:**
- Fast EMA: 7 (default)
- Medium EMA: 21 (default)
- Slow EMA: 50 (default)
## Alerts
Pre-configured alerts for:
- Long Signal (BUY - Entry confirmed)
- Short Signal (SELL - Entry confirmed)
- Exit Long (EXIT LONG - SuperTrend changed)
- Exit Short (EXIT SHORT - SuperTrend changed)
- EMA Cross Up (EMA 7 crossed above EMA 21)
- EMA Cross Down (EMA 7 crossed below EMA 21)
## Best Practices
### Recommended Setup (Validated System)
```
Enable ONLY:
- SuperTrend: ON
- ADX >23: ON
- All other filters: OFF
```
### Testing New Filters
1. Enable experimental filters
2. Backtest thoroughly before live trading
3. Compare performance metrics
4. Validate with demo account first
### Timeframe
- Optimized for: 4H charts
- Tested on: Bitcoin/USDT
- Works on: Any trending instrument
## Risk Management
This indicator provides entry/exit signals but does NOT include:
- Stop loss levels
- Take profit targets
- Position sizing
Always use proper risk management:
- Maximum 1-2% risk per trade
- Use stop losses
- Follow your trading plan
## Performance Notes
**Validated Backtest Results (SuperTrend + ADX only):**
- Win Rate: 52.11%
- Profit Factor: 3.162
- Return: +45.46% (4 years)
- Tested Period: 2020-2024
- Instrument: BTC/USDT 4H
**Important:** Adding additional filters changes the system. Results may vary. Always backtest your specific configuration before live trading.
## Mobile Optimization
- Compact table design
- Clear color coding
- Minimal chart clutter
- Large signal text
- Optimized for small screens
## Use Cases
✅ **Ideal for:**
- Trend-following strategies
- Swing trading (4H timeframe)
- Clear market conditions
- Systematic traders
❌ **NOT ideal for:**
- Scalping (too slow)
- Range-bound markets
- Counter-trend strategies
- Lateral/choppy conditions
## Credits & Methodology
Based on proven technical analysis principles:
- SuperTrend (volatility-based trend following)
- ADX (trend strength measurement)
- Directional Indicators (DI+/DI-)
- Volume analysis
- EMA systems
**Designed for:** Disciplined execution over frequent trading
**Philosophy:** Quality setups > Quantity of trades
## Disclaimer
This indicator is for educational purposes only. Past performance does not guarantee future results. Always:
- Test on demo account first
- Use proper risk management
- Never risk more than you can afford to lose
- Consult a financial advisor
Trading involves substantial risk. This tool does not constitute financial advice.
---
## Version History
**v2.0 (Current)**
- Modular filter system
- 2-column compact status table
- EMA 7 dynamic coloring (yellow when ADX >23)
- EMA 50 + VWAP added
- PDH/PDL levels
- EMA cross markers
- Improved signal logic
- One position per trend
- Multiple alert conditions
---
**For support, updates, or feedback, contact the developer.**

TrendSurfer Pro
TrendSurfer Pro 🚀 - Advanced Multi-Signal Trading Indicator
TrendSurfer Pro is a comprehensive all-in-one trading system that combines multiple proprietary algorithms and technical indicators to identify high-probability trading opportunities across all timeframes.
**Key Features:**
🔹 **Master Trend System** - Identifies major trend reversals using a combination of EMAs, RSI, and custom filters
🔹 **Smart Money Analysis** - Order Blocks detection with Z-Score impulse identification and rejection signals
🔹 **Session-Based Trading** - Tokyo, London, and New York session analysis with automatic breakout/rejection detection
🔹 **IFVG Detection** - Institutional Fair Value Gap identification for precision entries
🔹 **Multi-Timeframe Signals** - Triangle signals with volume analysis and VWAP proximity filtering
🔹 **KCandle/Boost System** - Advanced engulfing pattern detection with golden area projections
🔹 **CCI Signals** - Commodity Channel Index crosses with MACD confirmation filter
🔹 **Take Profit System** 🎯 - Advanced exit system combining 8 technical indicators (RSI, MACD, Stochastic, Bollinger Bands, Supertrend, CCI, EMA Cross, Price Action) with customizable confirmation requirements
**Unique Advantages:**
✅ Yellow Box Filter - Proprietary reversal zone detection
✅ Time Filters - Trade only during your preferred hours
✅ VWAP Integration - All signals respect price position relative to VWAP
✅ Customizable Alerts - Get notified for every signal type
✅ Visual Dashboard - Real-time trend confirmation table
Perfect for day traders, swing traders, and scalpers seeking precise entries and optimal exits! 🚀
