Session VWAP Cumulative BiasThe Session VWAP Cumulative Bias indicator is designed to differentiate between "choppy" price action and true "institutional" trend days. Unlike standard VWAP indicators that only show where price is now, this tool tracks the cumulative sentiment of the entire session.
Core Functions:
Cumulative Z-Score Logic: It calculates the distance between price and VWAP (in Standard Deviations) and sums it up over the course of the day. This reveals the "weight" of the market bias—the longer price stays pinned away from the VWAP, the more extreme the histogram becomes.
Scale Protection: It includes a "Capping" mechanism that prevents morning gaps or low-volume outliers from distorting the scale, ensuring the histogram remains readable from open to close.
Momentum vs. Regime Toggles: Users can switch between VWAP Slope (measuring the speed of the average's movement) and Cumulative Bias (measuring total session dominance).
Visual price Overlay: It automatically colors the price candles and plots a session-anchored VWAP line on the main chart, providing a clear visual of when price is "fair" versus "overextended."
How to read it:
Trend Confirmation: A steadily growing "mountain" in the histogram confirms an institutional trend day where dips are being bought (or rips sold).
Mean Reversion: When price hits a new high but the Cumulative Histogram begins to round off or diverge, it signals that the "elastic band" is stretched and price is likely to return to the orange VWAP line.
Regime Shifts: A cross of the zero-line on the histogram indicates a total shift in session control from buyers to sellers (or vice versa).
חפש סקריפטים עבור "VWAP"

Smart VWAP SignalsSmart VWAP Signals
Smart VWAP Signals is an advanced indicator based on the VWAP Intraday V2 strategy, optimized using Grid Search to maximize performance.
⸻
🎯 Key Features
Trading Modes
• BOTH: Combines mean reversion (Separator) and trend-following (KISS) signals
• SEPARATOR: Mean reversion signals only, when price deviates significantly from VWAP
• KISS: Trend-following signals only, aligned with VWAP direction
⸻
🚦 Intelligent Traffic Light System
• 🟢 GREEN: High Profit Factor – trade with confidence
• 🟡 YELLOW: Medium Profit Factor – trade with caution
• 🔴 RED: Low Profit Factor – avoid new entries
⸻
🛡️ Risk Management
• ATR-based Stop Loss with configurable maximum limit
• Flexible Take Profit options:
• VWAP target
• Fixed Risk/Reward ratio
• ATR multiple
• Automatic stop-day after consecutive losses
⸻
🔍 Configurable Filters
• Signal cooldown between trades
• Volatility filter (minimum ATR threshold)
• Trend filter (EMA 200)
• Volume filter
• Multi-timeframe confirmation
⸻
📊 Visualization & Analytics
• Real-time statistics panel
• VWAP with deviation bands
• Trade history with WIN / LOSS percentages
• Entry-to-exit lines
• Fully customizable colors
⸻
⚙️ Optimized Default Parameters
Optimized via Grid Search, achieving:
• ROI: 322%
• Profit Factor: 1.97
• Win Rate: 68.4%

FAIRPRICE_VWAP_RDFAIRPRICE_VWAP_RD
This script plots an **anchored VWAP (Volume Weighted Average Price)** that resets
based on the user-selected anchor period. It acts as a dynamic “fair value” line
that reflects where the market has actually transacted during the chosen period.
FEATURES
- Multiple anchor options: Session, Week, Month, Quarter, Year, Decade, Century,
Earnings, Dividends, or Splits.
- Intelligent handling of the “Session” anchor so it works correctly on both 1m
(resets each new day) and 1D (continuous, non-resetting VWAP).
- Manual VWAP calculation using cumulative(price * volume) and cumulative(volume),
ensuring the line is stable and works on all timeframes.
- Optional hiding of VWAP on daily or higher charts.
- Offset input for horizontal shifting if desired.
- VWAP provides a true “fair price” reference for trend, mean-reversion,
and institutional-level analysis.
PURPOSE
This indicator solves the common problem of VWAP behaving incorrectly on higher
timeframes, on synthetic data, or with unusual anchors. By implementing VWAP
manually and allowing flexible reset conditions, it functions reliably as
an institutional-style fair value benchmark across any timeframe.

DeltaATR + VWAP DIF + MA'sI attempted to create an indicator using a different approach to analyzing potential trend reversals, and although it is still a work in progress, it is already fully functional. The indicator combines the price relative to VWAP with ATR normalization, providing a way to measure deviations in terms of market volatility.
How the indicator works:
Delta Calculation:
The core of the indicator calculates the difference between the current price and the VWAP (Volume Weighted Average Price), then normalizes this difference by the ATR (Average True Range). This provides a volatility-adjusted measure of how far the price has moved relative to its typical range.
Histogram Visualization:
The deltaATR is displayed as a histogram, where positive values indicate the price is above VWAP and negative values indicate it is below. The histogram is color-coded for easy interpretation: typically red for above VWAP and green for below, with configurable transparency.
Dual Moving Averages:
Two moving averages (fast and slow) are applied to the deltaATR. This creates a crossover system:
When the fast average crosses above the slow average, it may indicate an upcoming bullish reversal.
When the fast average crosses below the slow average, it may indicate a potential bearish reversal.
Zero Line Reference:
A reference line at zero corresponds to VWAP, helping traders see whether price is generally above or below the average volume-weighted level.
Alert Lines (Optional Panel):
A second panel provides four configurable alert lines, allowing users to set key thresholds to monitor extreme deltaATR values. These lines are thin, dashed, and fully customizable in terms of color and thickness.
Panel for Values and Signals:
The indicator includes a side panel showing:
Current deltaATR
Fast and slow averages
Current trend signal (Bullish, Bearish, or Neutral)
How it can be used:
Identify potential trend reversals by monitoring the crossover between the fast and slow averages of deltaATR.
Use the histogram to observe when the price is deviating significantly from VWAP in terms of ATR.
Set alert lines for specific thresholds to highlight overextended conditions or significant volatility moves.
Combine with other technical indicators for confirmation before entering or exiting trades.
This indicator is particularly useful for traders looking to anticipate reversals in volatile markets, as it adapts the delta measure to the current market conditions using ATR normalization, making it more responsive and robust than raw price deviations alone.

day trading check indicatorDay Trading Check Indicator
By Trades per Minute · Creator: Trader Malik
Overview
The Day Trading Check Indicator is an on‐chart status panel that gives you a quick “go/no-go” snapshot of four key metrics—MACD, VWAP, Float, and Bearish Sell-Off—directly in TradingView’s top-right corner. It’s designed for fast decision-making during high-velocity intraday sessions, letting you instantly see whether each metric is “bullish” (green) or “bearish” (red), plus live float data.
What It Shows
Column Description
Metric The name of each metric: MACD, VWAP, Float, Bearish Sell-Off
Status/Value A color-coded status (“GREEN”/“RED” or “YES”/“NO”) or the float value formatted in K/M/B
Metrics & Calculations
MACD (1-Minute)
Calculation: Standard MACD using EMA (12) – EMA (26) with a 9-period signal line, all fetched from the 1-minute timeframe via request.security().
Status:
GREEN if MACD ≥ Signal
RED if MACD < Signal
VWAP (Session-Anchored)
Calculation: Built-in session VWAP (ta.vwap(close)) resets each new trading session.
Status:
GREEN if current price ≥ VWAP
RED if current price < VWAP
Float
Calculation: Retrieves syminfo.shares_outstanding_float (total float), then scales it into thousands (K), millions (M), or billions (B), e.g. “12.3 M.”
Display: Always shown as the absolute float value, white on semi-transparent black.
Bearish Sell-Off
Calculation: Checks the last five 1-minute bars for any “high-volume down” candle (volume above its 20-bar SMA and close < open).
Status:
YES if at least one such bar occurred in the past 5 minutes
NO otherwise
Key Features
Dynamic Table: Automatically shows only the metrics you enable via the Display Options group.
Size Selector: Choose Small, Medium, or Large text for easy visibility.
Clean Styling: Distinct header row with custom background, consistent row shading, centered status text, and a subtle gray border.
Lightweight Overlay: No cluttering plots—just a concise status panel in the corner.
Published by Trader Malik / Trades per Minute
Version: Pine Script v5

EMA 9/21/50 + VWAP + MACD + RSI Pro [v6]Overview:
A powerful multi-indicator tool combining Exponential Moving Averages (EMA 9, 21, 50), Volume-Weighted Average Price (VWAP), Moving Average Convergence Divergence (MACD), and Relative Strength Index (RSI) into a single, easy-to-read system. Designed for traders who want a clean, all-in-one dashboard for trend analysis, momentum confirmation, and overbought/oversold conditions.
Key Features:
1. Triple EMA System (9, 21, 50)
Identifies short-term and medium-term trends.
Bullish Signal: EMA 9 > EMA 21 > EMA 50 (Green Highlight)
Bearish Signal: EMA 9 < EMA 21 < EMA 50 (Red Highlight)
Helps confirm trend direction and potential reversals.
2. VWAP (Volume-Weighted Average Price)
Tracks intraday fair value price based on volume.
Bullish: Price above VWAP (Green)
Bearish: Price below VWAP (Red)
3. MACD (Standard 12, 26, 9 Settings)
Shows momentum shifts.
Bullish: MACD line > Signal line (Green)
Bearish: MACD line < Signal line (Red)
Histogram confirms strength of momentum.
4. RSI (14-Period Default)
Identifies overbought (>70) and oversold (<30) conditions.
Red: Overbought (Potential Reversal)
Green: Oversold (Potential Bounce)
5. Signal Dashboard (Top-Right Table)
Real-time summary of all indicators in one place.
Color-coded for quick interpretation (Green = Bullish, Red = Bearish).
How to Use This Indicator?
✅ Trend Confirmation:
Trade in the direction of EMA alignment (9 > 21 > 50 for uptrends).
Use VWAP as dynamic support/resistance.
✅ Momentum Entries:
Look for MACD crossovers while RSI is not extreme.
Avoid buying when RSI > 70 or selling when RSI < 30 (unless strong trend).
✅ Mean Reversion:
Fade extreme RSI readings (overbought/oversold) when price is at key levels.
Who Is This For?
✔ Swing Traders – EMA + MACD combo for trend-following.
✔ Day Traders – VWAP + EMA for intraday bias.
✔ RSI Traders – Clear overbought/oversold signals.
Settings Customization:
Adjust EMA lengths, RSI periods, and MACD settings as needed.
Toggle VWAP visibility on/off.
Why Use This Script?
📌 All-in-One: No need for multiple indicators cluttering your chart.
📌 Visual Clarity: Color-coded signals for quick decision-making.
📌 Flexible: Works on any timeframe (1M, 5M, 1H, Daily, etc.).
Install now and enhance your trading strategy with a professional-grade multi-indicator system!
Not a financial advice. Use at your own discretion and always apply risk management

NIFTY VWAP DistanceNIFTY Futures VWAP Distance Indicator
Track price deviation from Volume-Weighted Average Price in real-time
📈 Key Features:
Measures absolute (points) and percentage distance from VWAP
Daily session reset aligned with NSE trading hours
Dual-axis visualization with clear zero reference line
Real-time data table display for instant analysis
Typical price calculation: (H+L+C)/3 formula
Built-in safeguards against division errors
🎯 Ideal For:
Intraday traders monitoring mean reversion opportunities
Algorithmic traders needing VWAP deviation metrics
Swing traders identifying overextended price moves
Market profile analysts studying auction theory
📊 How to Use:
Apply to NIFTY Futures chart (1m-1h timeframes recommended)
Blue line = Points above/below VWAP
Red line = Percentage deviation
Positive values = Price > VWAP (bullish territory)
Negative values = Price < VWAP (bearish territory)
💡 Pro Tips:
Combine with volume profile for confirmation
Watch for >1% deviations for potential reversals
Use divergence patterns for early trend change signals
Works best with raw futures data (not continuous contracts)
🔧 Technical Specs:
Pine Script v5+
No repainting
Low latency calculations
Mobile-friendly display
"Know when price strays too far from fair value"

Matrix Series and Vix Fix with VWAP CCI and QQE SignalsMatrix Series and Vix Fix with VWAP CCI and QQE Signals
Short Title: Advanced Matrix
Purpose
This Pine Script combines multiple technical analysis tools to create a comprehensive trading indicator. It incorporates elements like support/resistance zones, overbought/oversold conditions, Williams Vix Fix, QQE (Quantitative Qualitative Estimation) signals, VWAP CCI signals, and a 200-period SMA for trend filtering. The goal is to provide actionable buy and sell signals with enhanced visualization.
Key Features and Components
1. Matrix Series
Smoothing Input: Allows customization of EMA smoothing for the indicator (default: 5).
Support/Resistance Zones: Based on CCI (Commodity Channel Index) values.
Dynamic zones calculated with customizable parameters (SupResPeriod, SupResPercentage, PricePeriod).
Candlestick Visualization: Custom candlestick plots with colors indicating trends.
Dynamic levels for overbought/oversold conditions.
2. Overbought/Oversold Signals
Overbought and oversold levels are adjustable (ob and os).
Plots circles on the chart to highlight extreme conditions.
3. Williams Vix Fix
Identifies potential reversal points by analyzing volatility.
Uses Bollinger Bands and percentile thresholds to detect high-probability entries.
Includes two alert levels (alert1 and alert2) with customizable criteria for signal filtering.
4. QQE Signals
Based on the smoothed RSI and QQE methodology.
Detects trend changes using adaptive ATR bands (FastAtrRsiTL).
Plots long and short signals when specific conditions are met.
5. VWAP CCI Signals
Combines VWAP and CCI for additional trade signals.
Detects crossovers and crossunders of CCI levels (-200 and 200) to generate long and short signals.
6. 200 SMA
A 200-period simple moving average is plotted to act as a trend filter.
The script rules recommend buying only when the price is above the SMA200.
Customizable Inputs
General:
Smoothing, support/resistance periods, overbought/oversold levels.
Williams Vix Fix:
Lookback periods, Bollinger Band settings, percentile thresholds.
QQE:
RSI length, smoothing factor, QQE factor, and threshold values.
VWAP CCI:
Length for calculating deviations.
Visual Elements
Dynamic candlestick colors to indicate trend direction.
Overbought/oversold circles for extreme price levels.
Resistance and support lines.
Labels and shapes for buy/sell signals from Vix Fix, QQE, and VWAP CCI.
Alerts
Alerts are configured for the Matrix Series (e.g., "BUY MATRIX") and other components, ensuring traders are notified when significant conditions are met.
Intended Use
This indicator is designed for traders seeking a multi-faceted tool to analyze market trends, identify potential reversal points, and generate actionable trading signals. It combines traditional indicators with advanced techniques for comprehensive market analysis.

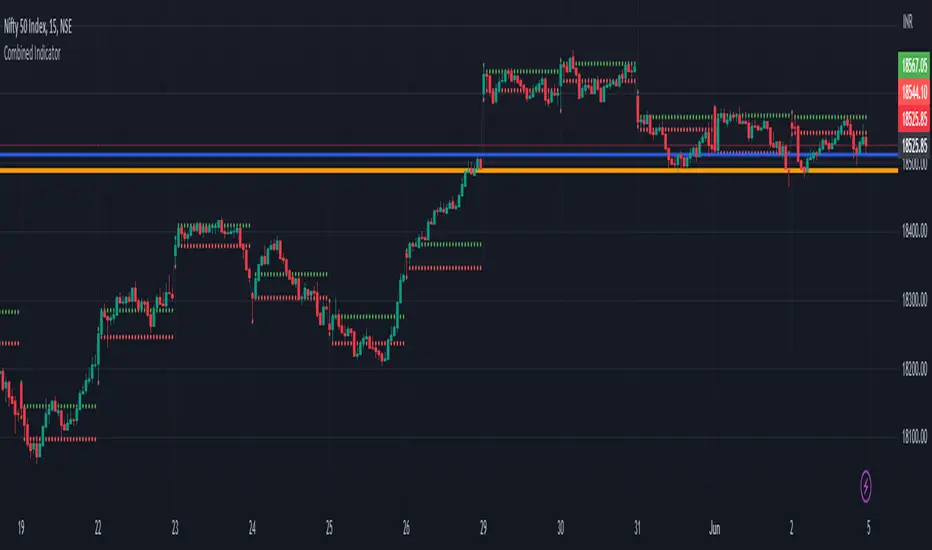
Previous Day Close and Average VWAP value, Current Day 30 min HLThe code provided is a TradingView Pine Script that creates a combined indicator consisting of two separate components:
Indicator 1: Plot Lines with VWAP
This component plots lines on the chart using two different colors and widths.
It uses a custom function f_newLine to create a new line object with a specified color and width.
It uses another custom function f_moveLine to move a line to a specific location on the chart.
The line_close line is moved to a specific date and closing price.
The line_vwap line represents the VWAP (Volume Weighted Average Price) and is plotted using the line.new function.
The VWAP calculation is performed using the typical price (average of high, low, and close) and volume.
The VWAP is plotted on the chart using the plot function.
The previous day's VWAP is also plotted and connected to the current day's VWAP with a line.
Indicator 2: 30 Min high and low breakout
This component identifies a specific time range ("0915-0945") within each trading day.
It uses the ta.valuewhen function to find the highest and lowest prices during that time range.
The highest price is stored in the high_thirtymin variable, and the lowest price is stored in the low_thirtymin variable.
These prices are plotted on the chart as circles, with green representing the high and red representing the low.
The indicator combines these two components to provide visual information about the VWAP and the high/low breakout within a specific time range. The code also includes some additional logic to handle barstate and ensure correct calculations and plotting.
SPY VWAPSPY VWAP adds the VWAP indicator for SPY on your current chart, and shows the current SPY VWAP level converted to ES / MES value. It uses the last close price of SPY and ES / MES to calculate the level.
By adding the regular VWAP indicator to your MES / ES chart, you will clearly see the difference between the VWAP of SPY and the futures chart. This is helpful when trading as price may respect both VWAP levels.
This indicator should only be used on ES and MES futures chart. It will behave weirdly if used on different tickers and it is not supported in the current version.

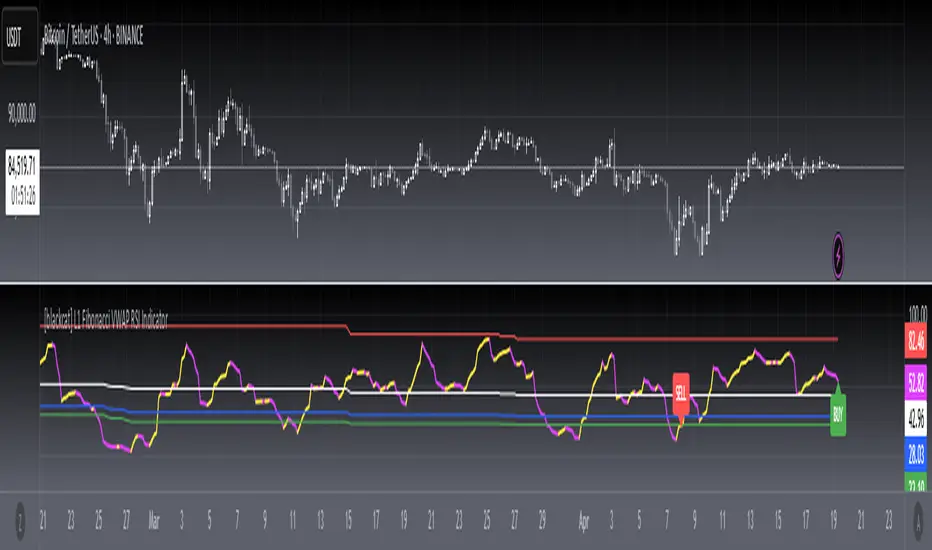
[blackcat] L1 Fibonacci VWAP RSI IndicatorLevel: 1
Background
Ingo Bucher proposed "Fibonacci RSI" in March,2003. It describes the advantages of considering Fibonacci retracement levels for use with the classic RSI indicator. Bucher reviews six charts, each displaying Fibonacci retracement levels for the RSI associated with each chart. The pine code given here will allow you to automatically recreate these charts for any security available in Tradingview. BTW, i enhanced it by changing RSI into VWAP RSI with hl2.
Function
For this Fib VWAP RSI indicator, it also applicable for original Bucher's fib concept. Bucher calculated his retracement levels by picking the RSI high and low for a given time window. In his examples, these were generally six months to a year's worth of data. Once the high and low were picked, he calculated retracement levels based on the well-known Fibonacci numbers (23.6%, 38.2%, 50%, 61.8%). This script here does the same thing. I use a "LookbackLength" (default: 400 bars), which represents a sliding data window that is used to determine the VWAP RSI high and low. The second input value controls the VWAP RSI period (default: 14 bars). The next three inputs select the retracement levels.
A total of eight different lines need to be drawn: the RSI itself, the 50% line, two retracements above the 50% point, two retracements below, and the zero and 100% lines. Pine script will create four plotlines per indicator, so I advise inserting the Fibonacci RSI twice. The first time it is inserted, leave the PlotRSI input with its default value, true. True tells pine script to plot the VWAP RSI itself. The second copy should have the input "Plot RSI" set to false. This will put the 50% line on your chart.
Inputs
LookbackLength --> Look Back Length.
RSILength --> RSI Length.
Fib1 and Fib2 --> Fibonacci lengths.
Key Signal
RawVWAPRSI --> Raw VWAP RSI output signal
Remarks
This is a Level 1 free and open source indicator.
Feedbacks are appreciated.
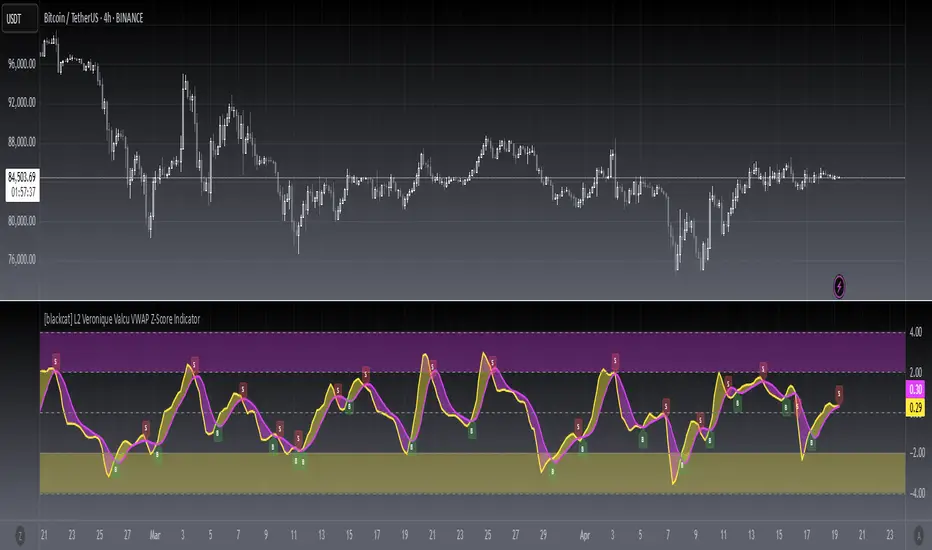
[blackcat] L2 Veronique Valcu VWAP Z-Score IndicatorLevel: 2
Background
Veronique Valcu's article "Z-Score Indicator" in Feb,2003 provided a description and commentary on a new method of displaying directional change normalized in terms of standard deviation. This indicator is realized in pine script here by using the following function code, adding vwap function, called vwap ZScore.
Function
This indicator has three input, "AvgLen", "Smooth1" and "Smooth2." Price is fixed in selected vwap price. AvgLen describes the length of the sample considered in the standard deviation calculation. Once created and verified, the function can be easily called in any indicator or strategy.
Inputs
AvgLen --> Length input for vwap Zscore.
Smooth1 and Smooth2 --> Smoothing length.
Key Signal
Curve1 --> vwap ZScore output fast signal
Curve2 --> vwap ZScore output slow signal
Remarks
This is a Level 2 free and open source indicator.
Feedbacks are appreciated.
TurboVWAPoscilOscillator based on VWAP and its standard deviations. It will display VWAP as a zero line and then an indicator line showing where price is in relation to VWAP expressed as Standard Deviation units.
This indicator is based on my awesome indicator TurboVWAP, so it shares most of its features:
- you can select whether you want a rolling or an anchored VWAP as basis.
- the VWAP will auto-set itself depending on the chart timeframe, so that it will be calculated based on the period you really want, not number of bars or similar.
- you can set the indicator to auto-set session start and end times for the session-anchored VWAP depending on the futures contract selected, so you don't need to mess with times.

bosstvs tikole sir + VWAP + EMA21 + SMA50Simple VWAP + SMA Trend with Pivot High/Low
📖 Description
This indicator is designed to identify bullish and bearish market conditions using VWAP, 21 SMA, and 50 SMA, along with Pivot High and Pivot Low lines for structure-based support and resistance.
It helps traders quickly understand trend direction, market bias, and key price levels on any timeframe.
✅ Bullish Conditions
Price is above 21 SMA
Price is above VWAP
🟢 Indicates strong bullish momentum.
❌ Bearish Conditions
Price is below 21 SMA
Price is below 50 SMA
Price is below VWAP
🔴 Indicates strong bearish momentum.
📐 Pivot High / Low
Pivot High lines act as resistance
Pivot Low lines act as support
Helps in identifying breakouts, reversals, and structure
🎯 Best Use
Intraday & Swing trading
Trend confirmation
Support & Resistance mapping
Works well with price action strategies

Pittillo A+ Scanner (Move + Volume + VWAP/EMA + No-Chop)Pittillo A+ Scanner — Move + Volume + VWAP/EMA + No-Chop
Pittillo A+ Scanner is a high-selectivity intraday scanner designed to surface A+ trade conditions only — filtering out chop, low-volume noise, and random price action that destroys consistency.
This indicator is built for traders who value patience, structure, and confirmation, not constant signals.
🔍 What It Looks For
An A+ signal will only appear when ALL of the following are present:
• Market Movement
• ATR expansion vs baseline (no dead tape)
• Real Participation
• Relative volume above average
• Trend Alignment
• 8/20 EMA structure
• VWAP confirmation (above for longs, below for shorts)
• Strength Confirmation
• ADX filter to avoid range-bound chop
• Price Structure
• Clean candles (filters dojis / overlapping garbage)
• Valid Trigger
• Breakout continuation or
• VWAP rejection with strong candle close
• Session Awareness
• Optional time-window filter to avoid low-quality hours
If conditions are not objectively favorable, the scanner stays quiet by design.
⸻
🎯 A+ Scoring System
Each setup is graded with an internal A+ score (0–100) based on:
• ATR expansion
• Relative volume
• ADX strength
• Bollinger Band expansion
• Candle quality
• Trend alignment
Signals only trigger when the score meets or exceeds the user-defined A+ threshold, ensuring quality over quantity.
⸻
🟢 Visual Signals
• A+ LONG → Triangle up + green background
• A+ SHORT → Triangle down + red background
• EMAs (8/20) and VWAP plotted for full context
No signal = no trade.
⸻
🧠 Philosophy
This indicator is intentionally conservative.
It is designed to:
• Protect capital during chop
• Reduce overtrading
• Encourage discipline
If you’re looking for constant alerts, this is not for you.
If you’re looking for clean, repeatable opportunities, this is exactly that.
⸻
📌 Best Use Cases
• Index futures (ES, NQ, MNQ, MES)
• SPX / SPY / QQQ intraday trading
• Traders who already respect VWAP + EMA structure
Works best on 2m–15m timeframes during active market hours.
⸻
⚠️ Disclaimer
This indicator does not predict markets or guarantee profits.
It is a filtering and confirmation tool, not a substitute for risk management or a trading plan.

PDH / PDL + Premarket Levels + VWAP + EMA 📌 PDH / PDL + Premarket Levels + VWAP + EMA (RTH Focused)
This indicator is designed for intraday traders who focus on the US market open and trade around key liquidity and acceptance levels.
It automatically plots:
Previous Day High (PDH) & Previous Day Low (PDL) based on Regular Trading Hours (RTH)
Premarket High (PMH) & Premarket Low (PML)
Session VWAP (Premarket + RTH, OHLC4)
8 EMA with dynamic trend coloring
All key levels are calculated during premarket but are only displayed after the market opens (9:30 ET) to keep the chart clean and actionable.
🔹 What’s Included
1️⃣ PDH / PDL (RTH-based)
Calculated from the prior day’s regular session
Useful for identifying liquidity sweeps, breakouts, and failed auctions
2️⃣ Premarket High / Low (PMH / PML)
Automatically tracked during premarket
Serve as important opening range and acceptance levels
3️⃣ Session VWAP (OHLC4)
Uses (Open + High + Low + Close) / 4
Accumulates from premarket through RTH
Helps identify institutional mean and trend acceptance
4️⃣ 8 EMA (Trend Bias)
Dynamically changes color based on structure:
🟢 Green when price is above PMH, PML, and EMA
🔴 Red when price is below PMH, PML, and EMA
⚪ Neutral when structure is mixed
🧠 How to Use
Look for trend continuation when price holds above PMH and VWAP with a green EMA
Watch for rejections or failures at PDH/PDL for reversal setups
Avoid chop when EMA remains neutral and price is between key levels
Best suited for scalping and momentum trades during the first hours of RTH
⏱ Session Logic
Premarket: 04:00 – 09:30 ET
Regular Trading Hours: 09:30 – 16:00 ET
Levels appear only after market open for clarity
⚠️ Disclaimer
This indicator is intended for educational and informational purposes only and should be used in conjunction with proper risk management and trade confirmation.

Key Zone$ - Support and Resistance0DTE Bounce Zones (6M) — Support & Resistance with VWAP, Volume, and Risk Management
This indicator is built for intraday and 0DTE options trading, focused on high-quality bounce and rejection setups at historically proven support and resistance zones.
It automatically identifies key zones from six months of historical price action and waits for real-time confirmation before signaling CALL or PUT opportunities. The goal is to reduce noise, avoid weak bounces, and provide clear, rules-based trade structure.
====================================================================
CORE FEATURES
====================================================================
Historical Support & Resistance Zones (6 Months)
Zones are built using 15-minute pivot highs and lows.
A zone must be tested at least 3 times to be considered valid.
Nearby zones are merged automatically to reduce clutter.
Zones extend forward in time and update dynamically.
Support zones are shown in green, resistance zones in red.
These are higher-quality structural levels, not same-day levels.
====================================================================
0DTE-Focused Entry Logic
Signals only trigger when price interacts with a confirmed zone and shows a strong rejection candle.
Signals are limited to high-probability trading windows only.
Market Open: 9:30–10:45 ET
Market Close: 3:00–4:00 ET
This avoids midday chop and focuses on periods with real momentum.
====================================================================
VWAP Confirmation (Strict)
CALL setups require a VWAP reclaim.
PUT setups require a VWAP loss.
This aligns trades with institutional order flow instead of counter-trend noise.
====================================================================
MACD Momentum Filter
MACD histogram behavior is used to confirm momentum direction and avoid taking bounces against the prevailing move.
====================================================================
ATR Candle Strength Filter
The signal candle must be large enough relative to ATR.
This filters out weak or indecisive candles that often fail with 0DTE.
====================================================================
Advanced Volume Confirmation (Relative Volume)
Relative Volume (RVOL) is used instead of raw volume.
Different RVOL thresholds are applied for CALLS versus PUTS.
Higher RVOL is required for PUTS due to downside urgency.
Lower RVOL is allowed for CALLS due to grind-up behavior.
Separate RVOL thresholds are used for the market open and market close.
This ensures signals only occur when real participation is present.
====================================================================
Built-In Risk Management (2:1 Reward/Risk)
Every signal automatically calculates an entry, stop loss, and target.
Stop loss is based on the zone edge with an ATR buffer.
Targets default to a 2:1 reward-to-risk ratio.
Entry, stop, and target levels are drawn directly on the chart and included in alerts.
====================================================================
Smart Alerts (CALLS & PUTS)
Alerts trigger only when all conditions are met.
Alerts include trade direction, entry price, stop price, target price, and RVOL information.
Alerts are designed for 5-minute confirmation trading.
To use alerts, select “Any alert() function call” when creating the alert.
====================================================================
INTENDED USE
====================================================================
0DTE options trading.
5-minute chart confirmation.
Index ETFs and liquid equities such as SPY, QQQ, IWM, and SPX.
Traders who want aggressive entries with confirmation.
Traders who value structure, volume, and risk control.
====================================================================
NOTES
====================================================================
This is not a prediction tool.
Signals require discipline and confirmation.
Best results come from trading only the highest-quality setups.

BTC 15m VWAP Structure Breakout [ALERT]BTC 15m VWAP Structure Breakout Strategy (Alert Only)
This strategy is designed for BTC on the 15-minute timeframe.
It focuses on identifying high-probability structural breakouts within an established trend, not predicting tops or bottoms.
The script is alert-only.
Entries are taken manually, based on confirmation after the alert.
🎯 Core Idea
The main question this strategy answers is:
“Is this breakout occurring with the trend,
or is it just a fake move inside a ranging market?”
To solve this, the strategy combines:
VWAP (institutional average price)
EMA20 (short-term trend filter)
Market structure breakout
📈 Indicators Used
VWAP (Volume Weighted Average Price)
Represents the market’s fair value and institutional bias.
EMA20
Defines short-term trend direction and momentum.
Structure High / Low (last 25 candles)
Identifies meaningful resistance and support levels.
🧭 Market Bias Filter
🔵 Bullish Bias (Long Setup Allowed)
Price closes above VWAP
EMA20 is rising (higher than 2 candles ago)
This confirms a valid bullish environment before looking for breakouts.
🔴 Bearish Bias (Short Setup Allowed)
Price closes below VWAP
EMA20 is falling (lower than 2 candles ago)
This confirms a valid bearish environment.
🚀 Breakout Signal Conditions
✅ Long Breakout Alert
A LONG alert is triggered when all conditions are met:
Bullish market bias
Price closes above EMA20
Price breaks above the previous 25-candle high
by at least 0.15%
➡️ This captures true continuation breakouts, not random spikes.
❌ Short Breakdown Alert
A SHORT alert is triggered when all conditions are met:
Bearish market bias
Price closes below EMA20
Price breaks below the previous 25-candle low
by at least 0.15%
➡️ This captures trend-aligned support breakdowns.
🔔 How to Use the Alerts (Important)
These alerts are NOT automatic entry signals.
When an alert fires, check:
Volume expansion
Breakout confirmation or pullback-and-reclaim
Higher-timeframe trend alignment
👉 Alert = “Market is ready, pay attention”
🧠 Best Market Conditions
✔ Trending BTC markets
✔ Breakout or expansion phases
✔ Works in all sessions (no session filter)
❌ Choppy or low-volatility ranging markets
👍 Who This Strategy Is For
Traders who can’t watch charts all day
Traders who want to reduce emotional entries
Traders who prefer probability and structure over prediction
Manual traders using alerts as decision triggers
📌 Final Thoughts
This strategy:
❌ does NOT try to catch bottoms or tops
✅ reacts only when structure confirms a real move
Let the market show strength first —
then decide how to trade it.

Dual VWAP + Dual ATR % BandsScript is adjusted for 5min time frame, can play around setting to adjust accordingly.
It has
Vwap regular
Vwap with adjustable time period
Bands based on ATR value, ie (if ATR is 10, one can adjust band to VWap+ATR %( adjustable)
ATR% can be adjusted to include daily ATR values in addition to current day ATR based on chart time frame.
The bands can be tied to regular VWAP or period VWAP
Regards

Cumulative Day-Over-Day VWAPDay Over Day VWAP "MultiDay VWAP" It keeps a log of session vwap and marks it as a day over day vwap on your chart

Sistema Neutro GOULART HUD Regime Radar ORB VWAPSistema Neutro GOULART is an advanced visual trading indicator that integrates:
• A unified HUD displaying session status, ORB, VWAP, risk and market bias
• A Regime Radar heatmap (GO / WAIT / NO) designed to provide clarity without chart clutter
• ORB with straight daily lines and a clean zone limited to the current session
• Direction filtering using VWAP and VWAP slope
• Condition assessment based on risk and overall market context
• A harmonized visual design focused on objective decision-making
⚠️ This indicator does NOT generate trade signals.
It provides market context, regime classification, and quality assessment to support discretionary trading decisions.
Ideal for:
• Futures markets (ES, NQ, YM)
• Day trading using ORB + VWAP
• Traders who prioritize context, discipline, and structure over signals
For educational purposes only.

WOLFGATEWOLFGATE is a clean, session-aware market structure and regime framework designed to help traders contextualize price action using widely accepted institutional references. The indicator focuses on structure, momentum alignment, and mean interaction, without generating trade signals or predictions.
This script is built for clarity and decision support. It provides a consistent way to evaluate market conditions across different environments while remaining flexible to individual trading styles.
What This Indicator Displays
Momentum & Structure Averages
9 EMA — Short-term momentum driver
21 EMA — Structural control and trend confirmation
200 SMA — Primary regime boundary
400 SMA (optional) — Deep regime / macro bias reference
These averages are intended to help assess directional alignment, trend strength, and structural consistency.
Session VWAP (Institutional Mean)
Session-based VWAP with a clean daily reset
Default session: 09:30–16:00 ET
Uses HLC3 as the VWAP source for balanced price input
Rendered in a high-contrast institutional blue for visibility
VWAP can be used to evaluate mean interaction, acceptance, or rejection during the active session.
How to Use WOLFGATE
This framework is designed for context, not signals.
Traders may use WOLFGATE to:
Identify bullish or bearish market regimes
Evaluate momentum alignment across multiple time horizons
Observe price behavior relative to VWAP
Maintain directional bias during trending conditions
Avoid low-quality conditions when structure is misaligned
The indicator does not generate buy or sell signals and does not include alerts or automated execution logic.
Important Notes
Volume must be added separately using TradingView’s built-in Volume indicator
(Volume cannot be embedded directly into this script due to platform limitations.)
This script is intended for educational and analytical purposes only
No financial advice is provided
Users are responsible for their own risk management and trade decisions

Ichimoku + VWAP + OBV + ATR Full System (NQ Daytrade)This script provides optimized scalping signals for BTC, designed mainly for the 15-minute timeframe.
Long/short entries are generated using VWAP band position and trend confirmation logic.
OBV momentum is used as a secondary filter to validate breakout or reversal conditions.
Exit signals are displayed when volatility compression or mean-reversion conditions occur.
Simple visual markers (triangles and circles) are included for easy decision-making.
롱/숏 삼각형 시그널
동그라미 청산 시그널
VWAP 밴드 기반 방향성
OBV 보조지표
이름 (Name)
BTC Scalping Signal – VWAP + OBV
짧은 설명 (Short Description)
VWAP 밴드와 OBV를 기반으로 방향성, 진입·청산 시그널을 제공하는 스캘핑 지표입니다.
긴 설명 (Long Description)
이 지표는 BTC 단기 스캘핑을 위해 설계된 것으로, 특히 15분봉 환경에 최적화되어 있습니다.
VWAP 밴드의 위치와 추세 판별 로직을 기반으로 롱·숏 진입 신호를 제공합니다.
OBV 모멘텀을 보조 필터로 사용하여 돌파 및 되돌림 가능성을 판단합니다.
시장 변동성이 축소되거나 평균회귀 신호가 감지될 때 청산 시그널을 표시합니다.
삼각형(진입), 원형(청산) 등 직관적 시각 요소를 통해 빠른 의사결정을 지원합니다.
