Historical Volatility OscillatorThis indicator looks at the volatility in a market. The classical HV only looks at volatility, but this indicator also takes the direction account. This indicator also looks at hl2 and not close.
חפש סקריפטים עבור "Volatility"

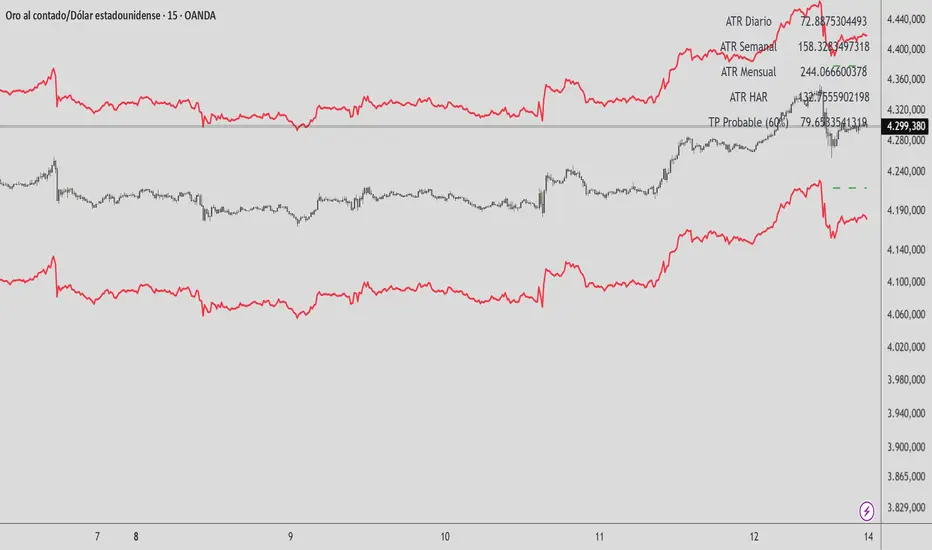
HAR Volatility ATR (Multi-Asset) - Andreus VillalobosIndicator based on the HAR (Hyper-Realized Volatility) model.
Combines daily, weekly, and monthly ATRs to project:
– Most probable price range (90%)
– Most probable take profit (60%)
Does not generate entry signals.
Designed for use in conjunction with:
market structure, liquidity, and price action.
Works on Forex, Indices, Gold, and Cryptocurrencies.

HAR Volatility ATR v1.0 (Andreus Villalobos)
Indicator based on the HAR (Hyper-Realized Volatility) model.
Combines daily, weekly, and monthly ATRs to project:
– Most probable price range (90%)
– Most probable take profit (60%)
Does not generate entry signals.
Designed for use in conjunction with:
market structure, liquidity, and price action.
Works on Forex, Indices, Gold, and Cryptocurrencies.
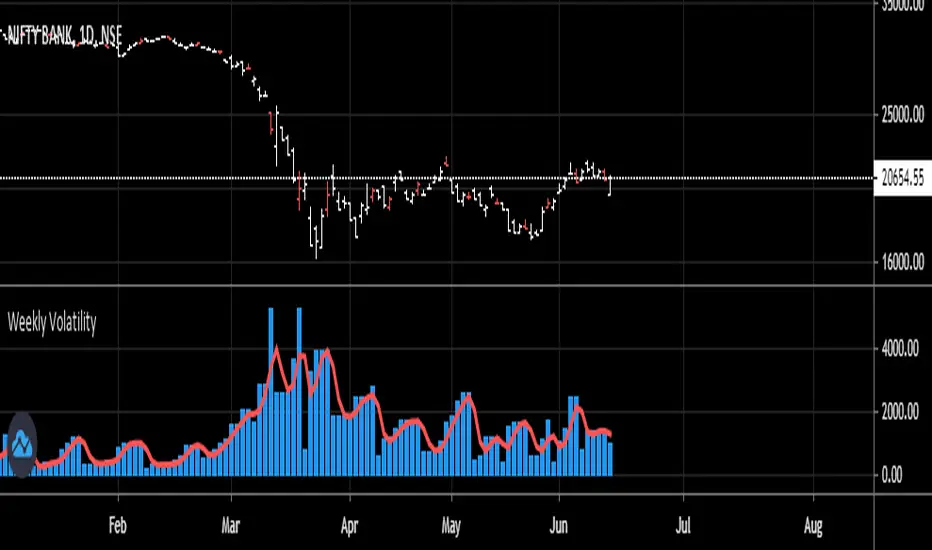
ATR Volatility HistogramATR Volatility Histogram showing result as coloured histogram where Rising > Greenand Fallig < Red. Input can be varied in settings.

Vince/Williams Extreme Volatility VulnerabilityDescription: This indicator implements the "Period of Extreme Vulnerability" concept developed by Ralph Vince and Larry Williams. The theory posits that a healthy market must regularly see the number of New Lows "dry up" (drop to near zero). When the percentage of New Lows fails to drop below a minimal threshold (default 0.15%) for a prolonged period (default 65 days), it indicates that internal market structure is rotting even if prices are rising, leaving the market fragile and prone to sudden volatility shocks.
I have programmed this script to track that exact condition—the extended absence of a "low" New Lows reading. It applies a 50-day Moving Average filter to contextually categorize the signal:
Red Dot (Crash Warning): Triggers when the vulnerability period begins while the price is above the 50 SMA. This is the classic warning signal, indicating that an uptrend is unsupported by market internals and a sharp correction may be imminent.
Green Dot (Contrarian Buy): Triggers when the vulnerability period begins while the price is below the 50 SMA. The script identifies this as a potential capitulation or value point where the persistent internal weakness is likely already priced in.
Note: This indicator requires exchange-wide data (New Lows, Advancers, Decliners) to function. It is best used on daily timeframes.

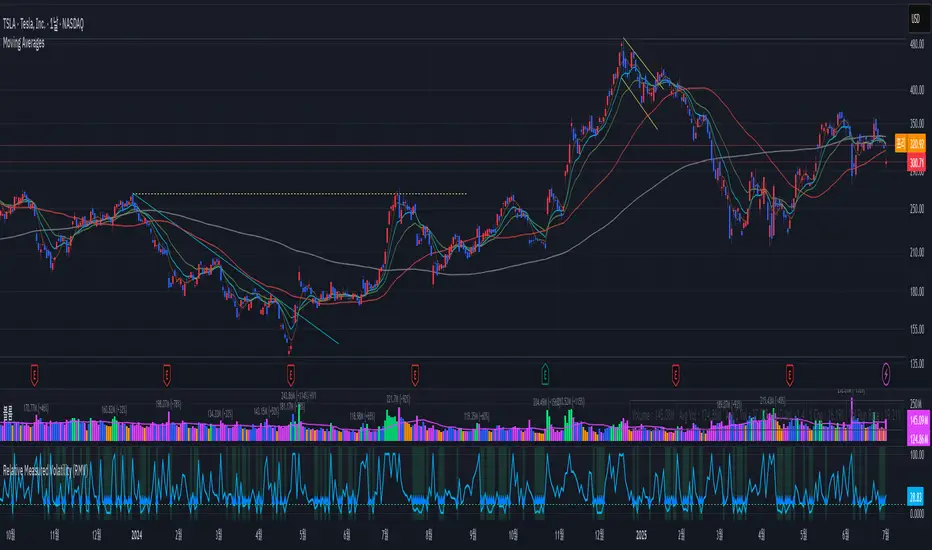
Relative Measured Volatility (RMV)RMV • Volume-Sensitive Consolidation Indicator
A lightweight Pine Script that highlights true low-volatility, low-volume bars in a single squeeze measure.
What it does
Calculates each bar’s raw High-Low range.
Down-weights bars where volume is below its 30-day average, emphasizing genuine quiet periods.
Normalizes the result over the prior 15 bars (excluding the current bar), scaling from 0 (tightest) to 100 (most volatile).
Draws the series as a step plot, shades true “tight” bars below the user threshold, and marks sustained squeezes with a small arrow.
Key inputs
Lookback (bars): Number of bars to use for normalization (default 15).
Tight Threshold: RMV value under which a bar is considered squeezed (default 15).
Volume SMA Period: Period for the volume moving average benchmark (default 30).
How it works
Raw range: barRange = high - low
Volume ratio: volRatio = min(volume / sma(volume,30), 1)
Weighted range: vwRange = barRange * volRatio
Rolling min/max (prior 15 bars): exclude today so a new low immediately registers a 0.
Normalize: rmv = clamp(100 * (vwRange - min) / (max - min), 0, 100)
Visualization & signals
Step line for exact bar-by-bar values.
Shaded background when RMV < threshold.
Consecutive-bar filter ensures arrows only appear when tightness lasts at least two bars, cutting noise.
Why use it
Quickly spot consolidation zones that combine narrow price action with genuine dry volume—ideal for swing entries ahead of breakouts.
Andy's Volatility Hunt IndicatorBuilt Volatility Hunt Indicator 1 year ago and backtested.
The purpose of this indicator is to IDENTIFY when a big move up/down is coming.
This indicator is best used for the 6 HR timeframe and results will be different if you apply it on other timeframes, as it was designed for the 6 hour timeframe.
When the signal "Pickup" occurs that means a big move is coming.
The big move can be going toward the upside or the downside.
As seen in the few previous "Pickup", FB has resulted in moves of 15%-20%.
It can also be used on multiple markets, a few that I have used were in tech stocks and BTC .
Moreover, you can set alert signals on the call when "Pickup" appears.
-Andy C

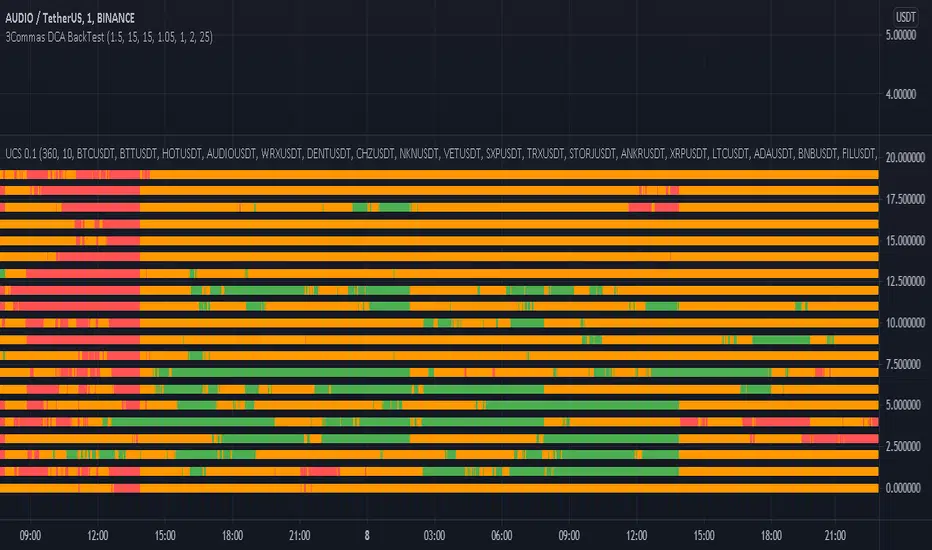
Crypto Market VolatilityCross market look at different Crypto markets ans their growth from the lowest value in 6 hours.
Green = +10% growth
Orange = 0 001- 9.99% growth
red = lowest price in last 6 hours
Use 1 minutes candles.Orange lines signify less volatility for bots.
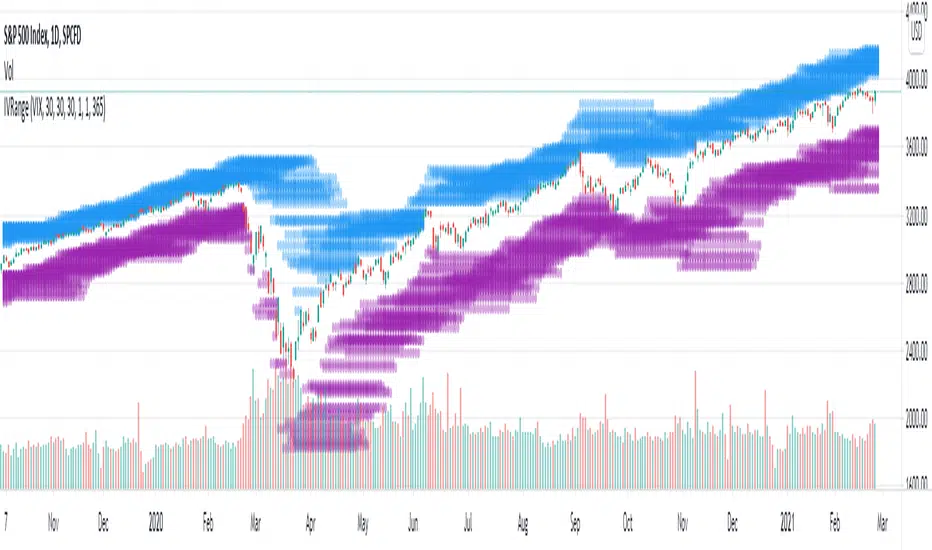
Implied Volatility Range ProjectionThis script plots an expected future range estimation based on implied volatilities, using a specified volatility index as proxy for ATM implied volatilities.
For example the S&P 500 could use the VIX.
Historical VolatilityNothing special here, just an open source Historical Volatility, for my own practice more than anything else.
Decided to make it public just because maybe somebody can edit it (as the TV standard one's source code is locked) and put in adaptive lengths or whatever else they want to do.
Just leave me a credit if you use it somehow.
Cheers.

[WJ] - Volatility RangeA simple script to find the percentage or cash value of volatility in the specified length. Handy for setting your target profit and/or loss numbers.

Exponential weighted volatilityEstimator of current annualized volatility that works for daily, weekly, monthly timeframes.
Lambda should be choosen inside the 0 to 1 range, with a lower lambda giving more weight to the movement in the most recent candlesticks. The literature default is 0.97, I'm setting a default value of 0.94 instead.

Relative Volatility Index + EMA + HTF RVI// this Script is based on
// added EMA of RVI
// added HTF RVI
// for HTF RVI i use at least 3xcurrent TF
// if RVI goes below EMA and HTF RVI -> weakness
// if RVI goes above EMA and HTF RVI -> strength


Smoothed Exponential Volatility IndexSame as the Exponential Volatility Index but with a smoothening factor included.

Smoothed Exponential Volatility IndexSimilar to Exponential Volatility Index but with a exponential smoothening incorporated.

Simple ATR Volatility Context v1.0This indicator provides a simple visual view of market volatility using ATR expressed as a percentage of price. It is designed to help identify when a market transitions from low-activity (compression) to higher-activity (expansion).
What it does
Calculates ATR as a percentage of price
Highlights the chart when volatility exceeds a user-defined threshold
Helps distinguish between quiet markets and trade-worthy conditions
How to use it
Green background indicates elevated volatility
Neutral / muted background indicates low volatility
Use alongside your own trend, structure, or entry tools
What this is not
Not a buy or sell signal
Not predictive
No performance claims
This tool is intended for market context and awareness, not standalone trading decisions.

Volatility Impulse [VI] (Expo)█ Overview
The Volatility Impulse Indicator is a trading tool that measures the rate of change in an asset's price volatility. It helps identify potential market entry or exit points by signaling high or low volatility periods, which could suggest increased price momentum or consolidation. The Volatility Impulse Indicator will spike when the market is highly volatile, indicating a potential trend reversal or breakout. Conversely, when the market is less volatile, the indicator will be more stable, indicating a possible continuation of the current trend.
█ Trend Feature
Adding a Trend feature to the volatility line makes the indicator a complete trading tool that can be used in many strategies. This trend feature capitalizes on the historical price momentum to determine the current trend direction, providing additional context and insight for traders. The historical price momentum essentially encapsulates the speed and strength of price changes over a certain period. By integrating this information into the volatility indicator, traders gain a clearer picture of not only the magnitude of price fluctuations but also the prevailing trend in the market.
█ How is the Volatility Impulse calculated?
The Volatility Impulse Indicator is based on the principle that volatility precedes price action. Therefore, they are useful in predicting future price movements.
In this calculation, we're determining volatility by looking at the greatest absolute difference in price. This is done by comparing two separate things:
The highest price and a previous highest price: The code is essentially looking back at a specific number of bars ('Length') and finding the highest price during that period. It then compares that highest price to the previous highest price (found during the previous 'Length' period). The difference between these two gives a measure of how much the highest price is changing.
The lowest price and a previous lowest price: Similar to the highest price, the code looks back at a specific number of bars and finds the lowest price. It then compares that to the lowest price of the previous period. The difference gives a measure of how much the lowest price is changing.
The 'greatest absolute difference' means it's considering the magnitude of the change, not the direction. So whether the price is increasing or decreasing doesn't matter here - it's the size of the change that counts.
This way of calculating volatility is looking at how much the extreme values (the highest and lowest prices) are changing. If these values are changing a lot, it suggests that price movements are quite volatile. Conversely, if the highest and lowest prices aren't changing much, it suggests lower volatility.
█ How to use
Using the Volatility Impulse Indicator is relatively simple.
Identify potential trend reversals: When the Volatility Impulse Indicator shows a spike, indicating high volatility, traders can look for potential trend reversals.
Volatility Retracement: Volatility retracement takes place in the direction of the ongoing trend and can be interpreted as a sign that the retracement phase is over or exhausted. This typically indicates that enough retail stop losses have been triggered or that sufficient profit-taking has been completed. Both of these factors can contribute to a pause or a reversal in the trend's direction, leading to a temporary spike in volatility.
Volatility Breakout: Sudden and rapid price movement beyond a certain level may indicate a potential breakout. This event suggests that the price has enough momentum to continue its direction, marking the breakout as valid.
Trend Confirmation: When the volatility line reaches its upper or lower band, it indicates an increase in volatility, suggesting a strengthening trend. When the volatility line oscillates around the midline, it may indicate decreasing volatility and a weakening trend or consolidation.
Overbought/Oversold Conditions: If the volatility line is above the upper line, it could indicate an overbought situation, suggesting a potential reversal or pullback, a perfect place to take partial profit. Conversely, a volatility line below the lower band may signal an oversold market, suggesting a possible upward movement or reversal, a perfect place to take partial profit.
Manage risk: Traders can use the Volatility Impulse Indicator to manage risk. When the market is highly volatile, traders can place stop-loss orders at strategic levels, thereby limiting their risk.
█ Any Alert Function Call
Any alert function call allows traders to combine predefined alerts. For example, they can pair 'trend is positive' with 'volatility line spikes below the lower band,' and so on.
-----------------
Disclaimer
The information contained in my Scripts/Indicators/Ideas/Algos/Systems does not constitute financial advice or a solicitation to buy or sell any securities of any type. I will not accept liability for any loss or damage, including without limitation any loss of profit, which may arise directly or indirectly from the use of or reliance on such information.
All investments involve risk, and the past performance of a security, industry, sector, market, financial product, trading strategy, backtest, or individual's trading does not guarantee future results or returns. Investors are fully responsible for any investment decisions they make. Such decisions should be based solely on an evaluation of their financial circumstances, investment objectives, risk tolerance, and liquidity needs.
My Scripts/Indicators/Ideas/Algos/Systems are only for educational purposes!
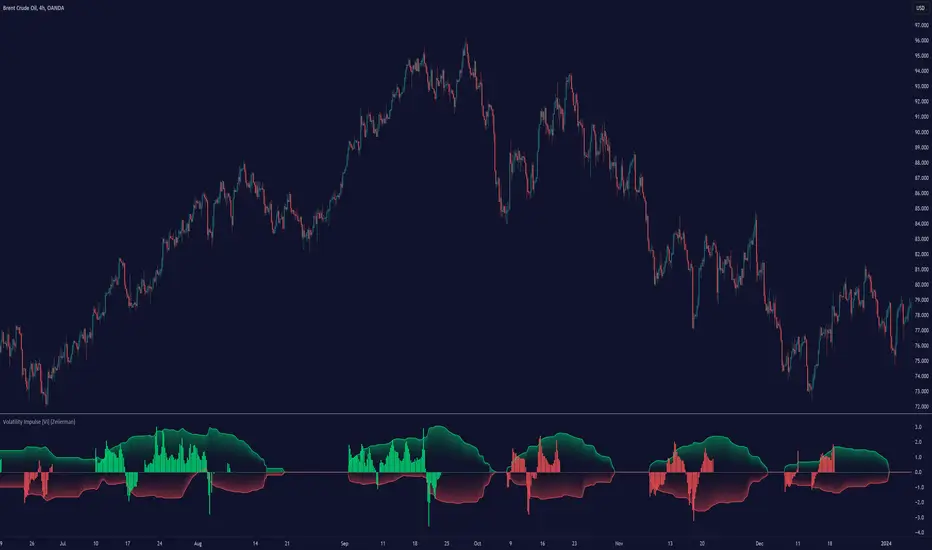
Volatility Trend (Zeiierman)█ Overview
The Volatility Trend (Zeiierman) is an indicator designed to help traders identify and analyze market trends based on price volatility. By calculating a dynamic trend line and volatility-adjusted bands, the indicator provides visual cues to understand the current market direction, potential reversal points and volatility.
█ How It Works
The indicator uses a weighted moving average of historical prices to create a responsive trend line that is adjusted for volatility using standard deviation. The indicator sets upper and lower bands at intervals of two standard deviations, acting as markers for potential overbought or oversold conditions. Additionally, by comparing current and previous trend line values, the indicator identifies the trend direction, providing crucial insights for traders.
█ How to Use
Trend Identification
Use the trend line to identify the overall market direction. An upward-sloping line indicates an uptrend, while a downward-sloping line indicates a downtrend.
Volatility Assessment
Use the distance between the upper and lower bands to gauge market volatility. Wider bands indicate higher volatility, while narrower bands indicate lower volatility.
Overbought/Oversold
If the price reaches or exceeds the upper or lower bands, it may be in an overbought or oversold condition, respectively.
█ Settings
Trend Control: Adjusts the sensitivity and smoothness of the trend line. Lower values make the trend more responsive, while higher values make it smoother.
Trend Dynamic: Controls how quickly the trend adjusts to price changes. Higher values result in a slower adjustment.
Volatility: Consists of two parts - the scaling factor for volatility and the sensitivity for volatility adjustment. Adjusting these settings alters the distance between the trend lines and the price, as well as how sensitive the bands are to changes in volatility.
Squeeze Control: Influences the degree to which market squeeze is considered in the calculation, with higher values increasing sensitivity.
Enable Scalping Trend: A toggle that, when activated, makes the indicator focus on short-term trends, which is particularly useful for scalping strategies.
█ Related scripts with the same calculation philosophy
TrendCylinder
TrendSphere
Predictive Trend and Structure
-----------------
Disclaimer
The information contained in my Scripts/Indicators/Ideas/Algos/Systems does not constitute financial advice or a solicitation to buy or sell any securities of any type. I will not accept liability for any loss or damage, including without limitation any loss of profit, which may arise directly or indirectly from the use of or reliance on such information.
All investments involve risk, and the past performance of a security, industry, sector, market, financial product, trading strategy, backtest, or individual's trading does not guarantee future results or returns. Investors are fully responsible for any investment decisions they make. Such decisions should be based solely on an evaluation of their financial circumstances, investment objectives, risk tolerance, and liquidity needs.
My Scripts/Indicators/Ideas/Algos/Systems are only for educational purposes!

Volatility Cone Forecaster Lite [PhenLabs]📊 Volatility Cone Forecaster
Version: PineScript™v6
📌Description
The Volatility Cone Forecaster (VCF) is an advanced indicator designed to provide traders with a forward-looking perspective on market volatility. Instead of merely measuring past price fluctuations, the VCF analyzes historical volatility data to project a statistical “cone” that outlines a probable range for future price movements. Its core purpose is to contextualize the current market environment, helping traders to anticipate potential shifts from low to high volatility periods (and vice versa). By identifying whether volatility is expanding or contracting relative to historical norms, it solves the critical problem of preparing for significant market moves before they happen, offering a clear statistical edge in strategy development.
This indicator moves beyond lagging measures by employing percentile analysis to rank the current volatility state. This allows traders to understand not just what volatility is, but how significant it is compared to the recent past. The VCF is built for discretionary traders, system developers, and options strategists who need a sophisticated understanding of market dynamics to manage risk and identify high-probability opportunities.
🚀Points of Innovation
Forward-Looking Volatility Projection: Unlike standard indicators that only show historical data, the VCF projects a statistical cone of future volatility.
Percentile-Based Regime Analysis: Ranks current volatility against historical data (e.g., 90th, 75th percentiles) to provide objective context.
Automated Regime Detection: Automatically identifies and labels the market as being in a ‘High’, ‘Low’, or ‘Normal’ volatility regime.
Expansion & Contraction Signals: Clearly indicates whether volatility is currently increasing or decreasing, signaling shifts in market energy.
Integrated ATR Comparison: Plots an ATR-equivalent volatility measure to offer a familiar point of reference against the statistical model.
Dynamic Visual Modeling: The cone visualization directly on the price chart provides an intuitive guide for future expected price ranges.
🔧Core Components
Realized Volatility Engine: Calculates historical volatility using log returns over multiple user-defined lookback periods (short, medium, long) for a comprehensive view.
Percentile Analysis Module: A custom function calculates the 10th, 25th, 50th, 75th, and 90th percentiles of volatility over a long-term lookback (e.g., 252 days).
Forward Projection Calculator: Uses the calculated volatility percentiles to mathematically derive and draw the upper and lower bounds of the future volatility cone.
Volatility Regime Classifier: A logic-based system that compares current volatility to the historical percentile bands to classify the market state.
🔥Key Features
Customizable Lookback Periods: Adjust short, medium, and long-term lookbacks to fine-tune the indicator’s sensitivity to different market cycles.
Configurable Forward Projection: Set the number of days for the forward cone projection to align with your specific trading horizon.
Interactive Display Options: Toggle visibility for percentile labels, ATR levels, and regime coloring to customize the chart display.
Data-Rich Information Table: A clean, on-screen table displays all key metrics, including current volatility, percentile rank, regime, and trend.
Built-in Alert Conditions: Set alerts for critical events like volatility crossing the 90th percentile, dropping below the 10th, or switching between expansion and contraction.
🎨Visualization
Volatility Cone: Shaded bands projected onto the future price axis, representing the probable price range at different statistical confidence levels (e.g., 75th-90th percentile).
Color-Coded Volatility Line: The primary volatility plot dynamically changes color (e.g., red for high, green for low) to reflect the current volatility regime, providing instant context.
Historical Percentile Bands: Horizontal lines plotted across the indicator pane mark the key percentile levels, showing how current volatility compares to the past.
On-Chart Labels: Clear labels automatically display the current volatility reading, its percentile rank, the detected regime, and trend (Expanding/Contracting).
📖Usage Guidelines
Setting Categories
Short-term Lookback: Default: 10, Range: 5-50. Controls the most sensitive volatility calculation.
Medium-term Lookback: Default: 21, Range: 10-100. The primary input for the current volatility reading.
Long-term Lookback: Default: 63, Range: 30-252. Provides a baseline for long-term market character.
Percentile Lookback Period: Default: 252, Range: 100-1000. Defines the period for historical ranking; 252 represents one trading year.
Forward Projection Days: Default: 21, Range: 5-63. Determines how many bars into the future the cone is projected.
✅Best Use Cases
Breakout Trading: Identify periods of deep consolidation when volatility falls to low percentile ranks (e.g., below 25th) and begins to expand, signaling a potential breakout.
Mean Reversion Strategies: Target trades when volatility reaches extreme high percentile ranks (e.g., above 90th), as these periods are often unsustainable and lead to contraction.
Options Strategy: Use the cone’s projected upper and lower bounds to help select strike prices for strategies like iron condors or straddles.
Risk Management: Widen stop-losses and reduce position sizes when the indicator signals a transition into a ‘High’ volatility regime.
⚠️Limitations
Probabilistic, Not Predictive: The cone represents a statistical probability, not a guarantee of future price action. Extreme, unpredictable news events can drive prices outside the cone.
Lagging by Nature: All calculations are based on historical price data, meaning the indicator will always react to, not pre-empt, market changes.
Non-Directional: The indicator forecasts the *magnitude* of future moves, not the *direction*. It should be paired with a directional analysis tool.
💡What Makes This Unique
Forward Projection: Its primary distinction is projecting a data-driven, statistical forecast of future volatility, which standard oscillators do not do.
Contextual Analysis: It doesn’t just provide a number; it tells you what that number means through percentile ranking and automated regime classification.
🔬How It Works
1. Data Calculation:
The indicator first calculates the logarithmic returns of the asset’s price. It then computes the annualized standard deviation of these returns over short, medium, and long-term lookback periods to generate realized volatility readings.
2. Percentile Ranking:
Using a 252-day lookback, it analyzes the history of the medium-term volatility and determines the values that correspond to the 10th, 25th, 50th, 75th, and 90th percentiles. This builds a statistical map of the asset’s volatility behavior.
3. Cone Projection:
Finally, it takes these historical percentile values and projects them forward in time, calculating the potential upper and lower price bounds based on what would happen if volatility were to run at those levels over the next 21 days.
💡Note:
The Volatility Cone Forecaster is most effective on daily and weekly charts where statistical volatility models are more reliable. For lower timeframes, consider shortening the lookback periods. Always use this indicator as part of a comprehensive trading plan that includes other forms of analysis.
