DMI Stochastic Extreme Refurbished█ CONCEPTS
DMI Stochastic Extreme was originally published by Barbara Star, PhD, in TASC magazine of January 2013.
Basically it describes an improved version of the ADX DI+/DI- indicator, created by J. Welles Wilder.
In the setup described by the author, the DMI Oscillator is used together with a stochastic oscillator of DMI.
First, the DMI Oscillator is obtained by subtracting the minus directional movement indicator value (DI-) from the plus directional movement value (DI+).
The final result is the "DMI Stochastic Extreme" indicator, in which the stochastic oscillator is calculated. Only instead of using the price value, the stochastic is obtained through the DMI value.
█ Goals
The final indicator described by Barbara is the Stochastic Oscillator of DMI.
However, to use the DMI oscillator together (as described in the magazine), it is necessary to plot it in a separate indicator, which consumes screen space.
That's why the idea of joining both the DMI oscillator and the DMI Stochastic Oscillator into one thing came up, optimizing the visualization.
Taking advantage of the fact that my hands are already dirty :), I created some fine adjustments.
█ HOW TO USE IT
Here are some examples:
1. With default params:
2. With custom DI Length of 21 (Histogram), DI Length of 13 (for Stoch Oscilator), Stoch Length of 5, and another theme.
3. Another params with less noise:
█ THANKS AND CREDITS
- Barbara Star (original creator)
- ucsgears (arrow logic)
חפש סקריפטים עבור "adx"

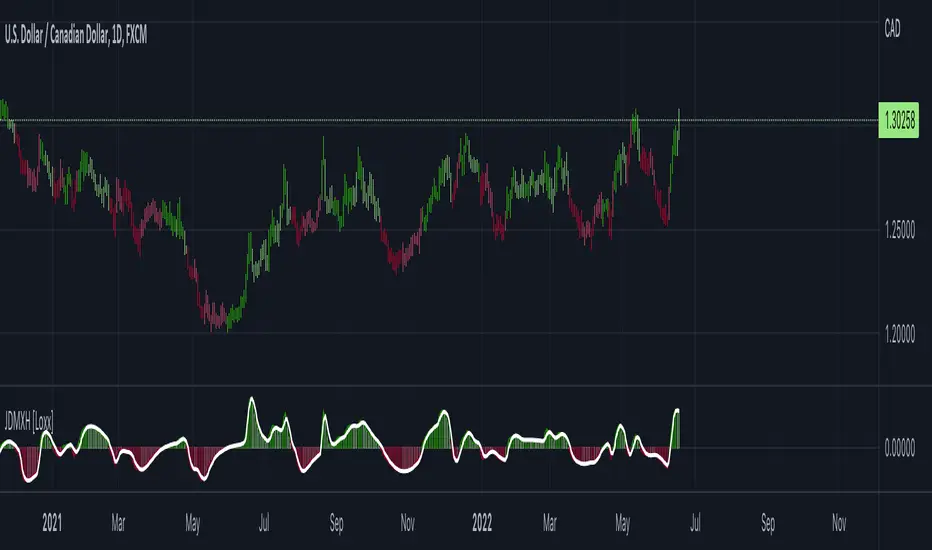
Jurik DMX Histogram [Loxx]Jurik DMX Histogram is the ultra-smooth, low lag version of your classic DMI indicator.
What is the directional movement index?
The directional movement index (DMI) is an indicator developed by J. Welles Wilder in 1978 that identifies in which direction the price of an asset is moving. The indicator does this by comparing prior highs and lows and drawing two lines: a positive directional movement line (+DI) and a negative directional movement line (-DI). An optional third line, called the average directional index (ADX), can also be used to gauge the strength of the uptrend or downtrend.
When +DI is above -DI, there is more upward pressure than downward pressure in the price. Conversely, if -DI is above +DI, then there is more downward pressure on the price. This indicator may help traders assess the trend direction. Crossovers between the lines are also sometimes used as trade signals to buy or sell.
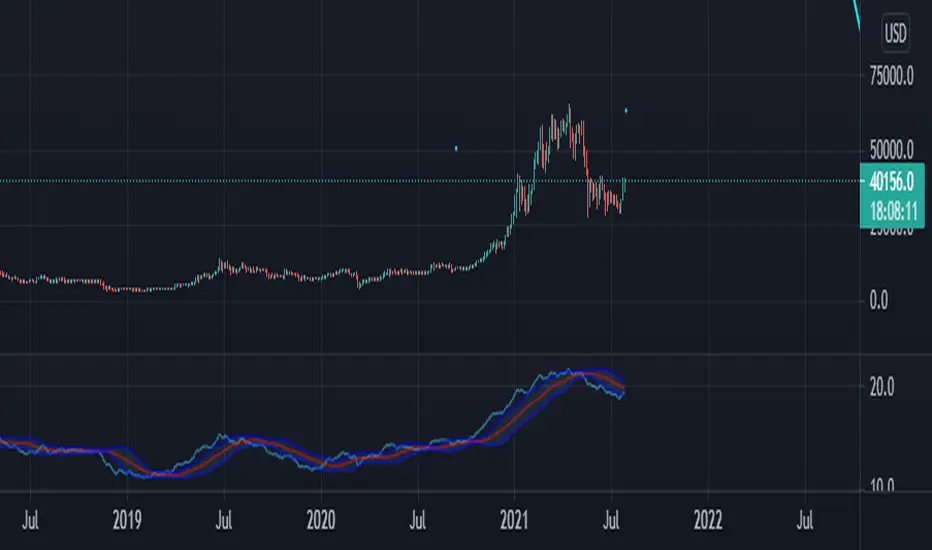
What is Jurik Volty used in the Juirk Filter?
One of the lesser known qualities of Juirk smoothing is that the Jurik smoothing process is adaptive. "Jurik Volty" (a sort of market volatility ) is what makes Jurik smoothing adaptive. The Jurik Volty calculation can be used as both a standalone indicator and to smooth other indicators that you wish to make adaptive.
What is the Jurik Moving Average?
Have you noticed how moving averages add some lag (delay) to your signals? ... especially when price gaps up or down in a big move, and you are waiting for your moving average to catch up? Wait no more! JMA eliminates this problem forever and gives you the best of both worlds: low lag and smooth lines.
Ideally, you would like a filtered signal to be both smooth and lag-free. Lag causes delays in your trades, and increasing lag in your indicators typically result in lower profits. In other words, late comers get what's left on the table after the feast has already begun.
What is an adaptive cycle, and what is Ehlers Autocorrelation Periodogram Algorithm?
From his Ehlers' book Cycle Analytics for Traders Advanced Technical Trading Concepts by John F. Ehlers , 2013, page 135:
"Adaptive filters can have several different meanings. For example, Perry Kaufman’s adaptive moving average ( KAMA ) and Tushar Chande’s variable index dynamic average ( VIDYA ) adapt to changes in volatility . By definition, these filters are reactive to price changes, and therefore they close the barn door after the horse is gone.The adaptive filters discussed in this chapter are the familiar Stochastic , relative strength index ( RSI ), commodity channel index ( CCI ), and band-pass filter.The key parameter in each case is the look-back period used to calculate the indicator. This look-back period is commonly a fixed value. However, since the measured cycle period is changing, it makes sense to adapt these indicators to the measured cycle period. When tradable market cycles are observed, they tend to persist for a short while.Therefore, by tuning the indicators to the measure cycle period they are optimized for current conditions and can even have predictive characteristics.
The dominant cycle period is measured using the Autocorrelation Periodogram Algorithm. That dominant cycle dynamically sets the look-back period for the indicators. I employ my own streamlined computation for the indicators that provide smoother and easier to interpret outputs than traditional methods. Further, the indicator codes have been modified to remove the effects of spectral dilation.This basically creates a whole new set of indicators for your trading arsenal."
Included
- Toggle on/off bar coloring
TUE ADX/MACD Confluence V1.0The ADX and MACD confluence can be a powerful predictor in stock movements. This script will help you find those confluences in an easy to understand visual manner.
It includes Buy and Sell signals for detected confluences, and will show colored candles to help you determine when to exit a trade. When the candles turn to white that means the detected confluence is no longer in play and you may want to consider a trailing stop loss.
The Buy and Sell signals will display on the first occurrence of each confluence.
It's important to understand that both of these are lagging indicators, but with a careful attention to your stoploss you can easily generate a positive profit factor.
This code is provided open source and you're free to use it for any purpose other than resale.

Multiple Indicators ScreenerA screener for multiple indicators with nice table output.
I was asked many times to update custom screener to display results in a table form. This way it looks much better.
You can play with background colors depend on values you're looking for.
In the screener, for example, I'm highlighting overbought/oversold RSI values, big ADX levels and trend of the Supertrend.
In parameters you can change settings for all indicators and change/disable tickers if 40 is too many for you.
There is only 1 function that calculates all these indicators. Potentially you can change and even add more indicators to this function.
Writing code for these kind of screener is a bit time consuming, so I even created a code generator in Python for these kind of indicators :) .
Disclaimer
Please remember that past performance may not be indicative of future results.
Due to various factors, including changing market conditions, the strategy may no longer perform as well as in historical backtesting.
This post and the script don’t provide any financial advice.

Price Adjusted ADX Trend IdentifierUsed to identify trend by applying advance decline formula directly to price action. The result is smoothed activity that incorporates trend strength so that minor pullbacks and consolidation that result from large moves do not cloud the overall trend of the chart. Also sideways action will identify the end of a trend sooner by incorporating the shrinking advance decline activity into price action.
The value is less important than the trend identification against the shown imbedded Bollinger band.
The script allows for advance decline length to be adjusted. Set at 2. Longer will be less reactive shorter will be more reactive.
I have not traded this indicator but it may be useful in identifying smoother trends. Possibly using the cross of the ADX line against the Bollinger upper/lower/mid lines.
Enjoy.
DMI With Crosses (MyNewTrade)Directional Movement Indicator:
+DI and -DI
I changed the color of the bar bars according to the crossed of +DI and -DI . It helps us to have an idea of whether the trend is continuing or not.
+DI crossover to -DI barcolor is Aqua, if not bar color is Red.
It also helps us to find the lowest and highest points of the graph according to the positions of Adx +DI and -DI .
It gives warnings at the lowest and highest points, which helps us to detect the direction of the trend.

Bollinger Oscillator Extreme + ADXSHORT DESCRIPTION
This study is an improved, flexible, fully-customizable version of the one proposed by Steve Karnish of Cedar Creek Trading, who aimed to create an oscillator based on Bollinger Bands , with the goal of spotting divergencies that occurs outside the bands yet providing valuable entries on the crossings trough a smoothed signal.
IMPROVINGS
Made a Zero Line normalization, where 0 is essentially the BBs basis MA, whereas +100 -100 represents those classic 2 Stdev;
Added two levels of interest based on golden ratio working with the two above to get such an Overbought/Oversold Area. Those levels slightly move apart from a 1.5 Stev.
Made possible to set EMA as basis average instead John’s classic SMA ;
While I kept the original “CCT Oscillator” as a reliable divergence-hunter, I get from it the “Smoothed Oscillator” with a triple average smoothing. You can only play with the first smoothing step by “Oscillator Smoothing” while following are fixed.
Despite little differences occurs, you can consider the Smoothed Oscillator itself as the Signal on the original CCT Oscillator.
Derived the “Signal” that works on the Smoothed Oscillator. You can play with different smoothing length.
Add a customizable ADX which helps weighting trend strength, weakness, choppiness . (mirrored on the Zero Line for aesthetics only)
Add a “BB Width” representation so as you can stay in touch with BB volatility , squeezes, and so on. It is a non-analitic data (not 100 normalized). Use “BBW Multiplier” to match visual reading.
HOW TO USE (NOT TO USE)
The indicator works well when strong directional moves occurs and even better in a sideways market (wide trading range). So there are three main evaluable application:
During an Up-trend, spotting negative divergencies on CCT Oscillator in the Oversold Area (better above +100) tell us that a correction or a reversal will probably occur. It’s time to consider a stop profit or look for a good re-entry after the pull-back.
During a Down-trend, spotting positive divergencies on CCT Oscillator in the Overbought Area (better below -100) tell us that a correction or a reversal will probably occur. It’s time to consider a stop profit or look for a good re-entry after the pull-back.
In a Sideway Market, look for both positive and negative divergencies on CCT Oscillator in the Oversold/Overbought Areas, trading in the range, better with the confirmation from such a Stochastic and a Volume based indicator.
>>> If you're not a pro you would better left counter-trend and mean-reversal setups to “trading titans”. <<<
“OK! And what about signals!?” you tell. :D There are many ways to get signals from crossings and it’s up to you to find what work better to you needs. You can start testing the original Steve Karnish method, using the “CCT Oscillator”/“Smoothed Oscillator” crossings (a 9 period smoothing on a 20 period BB could be a reasonable begining).
Whipsaws makes it difficult? Give a try to “Smoothed Oscillator”/“Signal” crossings. Observe how the price act when “Smoothed Oscillator” penetrate Overbought Area from above or Oversold Area from below after a divergence took place.
Test a lot BB Length-Signal Smoothing combos.
Test with EMA instead using John’s SMA .
Never forget the divergencies’ reliability is time-correlated yet timeframe-correlated too (the longer the better!).
Never forget that the Zero Line (as the basis of BBs) tends to act as resistance/support.
I do the best I can to realize such a flexible tool. Now is up to you to find what better suit your needs.
MEDTRONIC Daily
MORE SUGGESTIONS
This script won’t be an out of the box stategy as no other indicator by itself, tough if you tell it could become a piece of the puzzle.
So that his is basically a price-based indicator you would better consider to pair it with a volume-based or an absolute-momentum based one .
Most important is you first focus on the market in order to detect strong uptrend/downtrend or sideways, better using a supertrend, moving averages (or whatever works better for you) paired with a momentum indicator .
As literatures explains Bollinger Bands (such many others indicators) do their best in ranging markets, yet this version could be as useful when a strong directional move takes place.
THIS WORK TAKES HOURS OF RESEARCH, DEVELOPMENT, TESTING…
SHARING IS INTENDED FOR EDUCATIONAL PURPOSE ONLY. NOT FOR PROFESSIONAL USE.
WILL APPRECIATE ANY FEEDBACK, QUESTION, SUGGESTION! (*)
(*) Please don’t ask me for “magic settings” which do not exist at all, nor for “kaleidoscopic effects” cause I’m a big fan of such a minimalistic yet professional layouts.
FOLLOWUP TO CHECK UPDATES!

Trending/RangingThis script is a useful tool to use to identify the current market. It includes three other indicators:
1. ATR (combined with a SMA of the ATR)
2. ADX
3. RSI
It allows you to filter for when the market is trending vs. when the market is ranging by using any of the three indicators. You can also combine them to find extremely good trends to trade, or if you're a channel trader, identify when you wouldn't want to trade. This indicator also includes a time frame setting to allow you to ZOOM OUT and explore the long term trend of the security you are trading. I highly recommend using this indicator as a filter for when you enter a trade or not depending on the system you like to trade.

RedK Trader Pressure Index (TPX v1.0) Quick Summary
---------------------
The RedK Trader Pressure Index (REDK_TPX) analyzes the changes in price bars to give the trader a clear visual insight that represents the ongoing fight between the bulls (buyers) and bears (sellers) in the market - to determine who is in control of the price action, which in turn can be helpful in a trader’s decision about how the price action may be unfolding, what type of trade and positions to take (or to close) and when is the ideal time to action.
How the TPX calculation works
---------------------------------------
The TPX uses a simple logic and that’s one of the things I like about it – there is no complex calculation or magic stuff - and the core idea makes sense to me, as well as being one of the ways I needed to analyze my price charts.
The underlying assumption is that the buyers and sellers are competing for control of the market at all time.
- if there’s more buyers than sellers in the market, and if the buyers’ (or bull) pressure is stronger (than the sellers’), they will be able pull the “price range” up – and that means that on the price chart we can expect to see an increase in value in both the “high” and the “low” of the next price bar.
- Similarly, if there’s more sellers than buyers in the market, and if the sellers’ (or bear) pressure is stronger (than the buyers’), they will be able push the “price range” down – on the price chart we can expect to see a decrease in value in both the “high” and the “low” of the next price bar.
So, we will use the change in high and low price, between 2 consecutive price bars, as a proxy for the bull and bear “pressures” – a (weighted) moving average of these “pressure” values are then calculated along with the “Net Pressure” – the final results are plotted.
The importance of the "Control Level"
-----------------------------------------------
As in similar price-action based indicators, there’s a certain threshold or “control level”, above which, the pressure becomes “dominant”
when the bull or bear pressure is above that threshold, they will dominate and control the price move – this level can be found around the 25 or 30. I have included the ability to plot and adjust that control level in the TPX’s settings – and I also show some examples in the chart above (weekly chart for MSFT)
The code is commented and the chart is annotated to explain how to “read” the TPX – and how to interpret the values on the price chart
Using the Trader Pressure Index (TPX) in trading
------------------------------------------------------------
TPX can be valuable in showing well-supported (up or down) price moves that may lead to a strong trend that we can ride (when the pressure value is above the control level) - see exampled above
TPX is also valuable in showing when there’s “lack of interest” from the buyers or the sellers (or both) – which is great in exploring chub or no-trade zones - so basically when to avoid trading.
As usual, it's always recommended to use these types of "price action insight" indicators in conjunction with other trend and momentum indicators (moving averages, MACD..etc), so the insight we gain from them can be properly placed within the broader "context" - and to receive additional confimtion signals to support the trading decision.
I will come back later to post something about how the TPX differs from my recently-posted Strength of Movement (SoM) because they wok completely differently but can be used together with great synergy – and also how the TPX compares to the classic DMI/ADX which uses a similar concept.
Please feel free to integrate in your trading – hope you find this useful - comments and feedback are always welcome

asw Stochastic + DIStochastic and ADX (not plotted) DI positive and negative combined.
This is done to remove the lines of DI +/- and make chart cleaner with just single point plot showing DI crossing.
DI + above DI - = Green dot shown (bullish signal)
DI + below DI - = Red X-cross shown (bearish signal)
Enjoy!

MA+ADX+DMICOINBASE:BTCUSD
BINANCE:BTCUSDT
Use long and short moving average to look for a potential price in/out. (default as 14 and 7, bases on the history experience)
ADX and DMI to prevent the small volatility and tangling MA.
Test it in 4HR, "BINANCE:BTCUSDT"
From 12/1/2017- 11/1/2020 (Mixed Bull/Bear market)
Overall Profit: 560.89%
From 1/1/2018 - 1/1/2019 (Bear market)
Overall Profit: -2.19%
From 4/1/2020 - 11/1/2020 (Bull Market)
Overall Profit: 274.74%
Any suggestion is welcome to discuss.


Support and Resistance levels - DMI - DI trailing stop linesThis can be used to compliment the Directional Movement Index if used as a standalone trading system. In addition to using the ADX and DI lines, a trailing stop can be used when the DI lines cross. If the plus line is above to show a buy signal, then the low of the price of when which the cross took place is used as a trailing stop. If the minus line is above to show a sell signal, then the high of the price of when which the cross took place is used as a trailing stop. This helps cut losses sooner whenever the price would end up going through these trailing stops or support/resistance levels yet the DMI system would show an upward or downward move.
KENVIN ADX CROSSThis is Pro ADX Indicator was modified and renovated to more smooth and effectively
- easier to self modify (customize)
- quickly detect trend
- easier to view with signal color cross

Volt v2Change your candle view to line or bar.
This script uses the most common strategies for the following indicators. : RSI , Moving Averages, Stochastic , ADX , MACD , VWMA , Support and Resistance , Bollinger Bands , Ichimoku Cloud , Parabolic SAR , and Commodity Channel.
It compares the default values defined by the user to the other values which are specified, determining which has been most effective over the lookback period, which also is defined by the user.
It then groups the most effective settings over the defined period for lagging and leading indicators, and issues a positive or negative score for each individual indicator.
For this iteration there are 4 leading, and 7 lagging indicators.
Green candles show the sum of leading, and also lagging indicator is a positive total greater than 1.
Blue shows a positive sum.
Yellow shows a negative sum.
Red shows a negative sum of leading and also lagging indicators greater than 1.
White shows no defined direction.
Trades are entered on the first red or green candle, and exited on red or yellow for longs, or green or blue for shorts.

Directional Movement IndexThis is a standard ADX DMI indicator with Background colour and the option to draw the Background colour of the next higher timeframe.

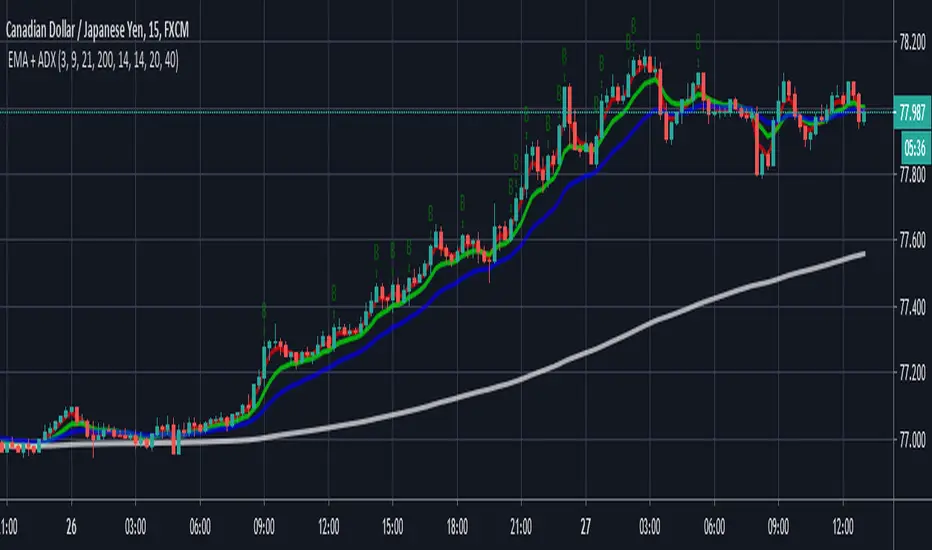
EMA + ADXTrend trading system that uses price and combined with EMA's + ADX above 20 to determine trend
Super Trend-adxJust hybrid of Super trend and ADX
above zero=bullish=blue
bellow zero=bearish=red
nice way to see trends

[VIP] Multi Timeframe Pivot Support Resistance (MTPSR)MTPSR provides 6 boards to watch pivots, supports, and resistances in cross timeframes. By default, timeframes are 15m, 30m, 1hr, 2hr, 4hr, and 1D with the current ticker, but they are changeable on indicator setting.
The Pivot, Support, and Resistances have 2 algorithms; Fibonacci or Classic. Default is Classic, but you can change on indicator setting.
MTPSR has 2 additional boards with BitMex Long and Short Liquidation algorithm, this logic can be used for any ticker especially if you want to have tight control with margin liquidation.
MTPSR provides KDJ charts in cross timeframes with the last 3 candles for every board. The default does not appear, but you can enable it on indicator setting. If Greenline crossover Redline, that is a good position to the long or indicating uptrend. But if Greenline crossunder Redline, that is good position to the short or indicating downtrend.
MTPSR has DI/ADX for every board, DI is a difference between DI+ and DI-, if the value is negative means downtrend, if the value is positive means uptrend.
HOW TO USE
Long Trading
The Support will be a good position to entry
The Resistance will be a good position to take profit
If in lower time frames, the candle keeps cross over the resistances, that means uptrend rally is happening.
Short Trading
The Support will be a good position to take profit
The Resistance will be a good position to entry
If in lower time frames, the candle keeps cross over the resistances, that means uptrend rally is happening, it is not good for short
Scalping Advice
If you scalp in day trading, it is recommended to watch Pivot/Support/Resistance on Timeframes 1D, 4D, and 1W
If the chart is sideways on the 1D pivot and the direction from support to pivot, that means the market wants to have a correction to closer support
If the chart is sideways on the 1D pivot and the direction from resistance to pivot, that means the market wants to have retest to closer resistance before another drop or breakout to continue the rally
Use can scalp on TF 15m or TF30m, the Pivot/Support/Resistance in lower timeframes can be so dynamic, so you have to pay more attention on trading strategy, you can use 2H and 4H Pivot/Support/Resistance as the target
You can also use Liquidation Long/Short boards for scalping trading strategy to take profit or cut lost
ALERTS
Every pivot board has alert which condition: if candle cross over or under support, resistance or pivot even KDJ cross over or under
Every liquidation board has alert which condition: if candle cross over or under every margin level
Example alert title for every board when candle cross over: Over Support TF 1, Over Resistance TF 1, Over Pivot TF 1, KDJ Up TF1
Example alert title for every board when candle cross under: Under Support TF 1, Under Resistance TF 1, Under Pivot TF 1, KDJ Down TF1
Feedback
Please drop a comment or send a direct message for any bugs or request new feature
I dont sell source codes, please not DM me about it

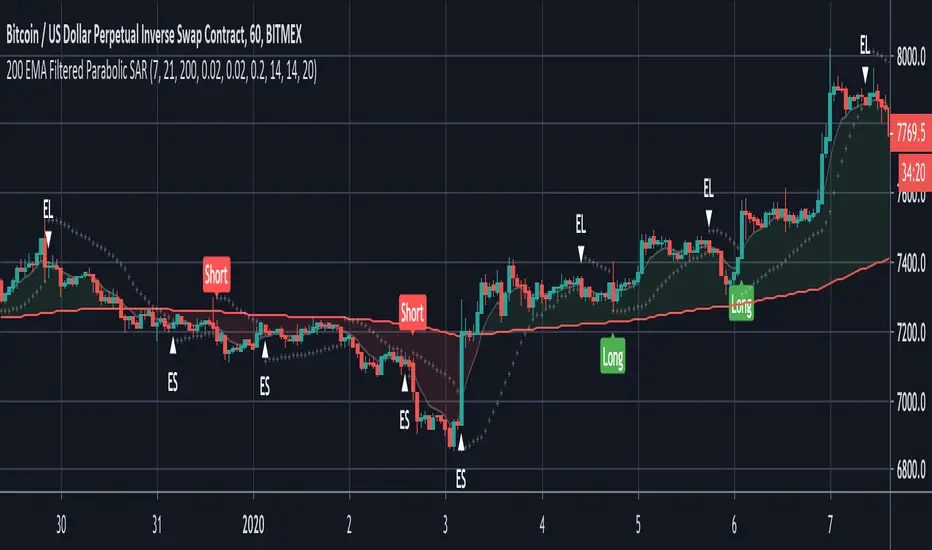
200 EMA Filtered Parabolic SARThis script uses Parabolic SAR with the 200 EMA to determine long and short trends. Only long signals are given when the price is above the 200MA and shorts when it is below. Signals are further filtered using ADX to reduce noise.
Suitable for trading bots where open positions in the same type are set to be ignored.
Alerts are built in.
Multi Timeframe ADX and DI w/ AlertsThis script is based off the public DMI code and used to get a quick visual of trend and direction across 3 different timeframes. Alert conditions have been setup for trend changes to bull/bear for all 3 timeframes. This script is meant to pull together the concepts of multi-time frame indicators, custom functions, and custom alert conditions.
The primary instructions for this script was to find a version of the ADX Indicator and give it the same treatment as we did with the Heiken Ashi demo (displaying green/red/gray circles to indicate trend and direction) over a configurable time frame. Display a matrix of each timeframe and the corresponding directional color (green=bull, red=bear, gray=non-trending). Have it produce an alert when the state of indicator changes to either bull or bear.

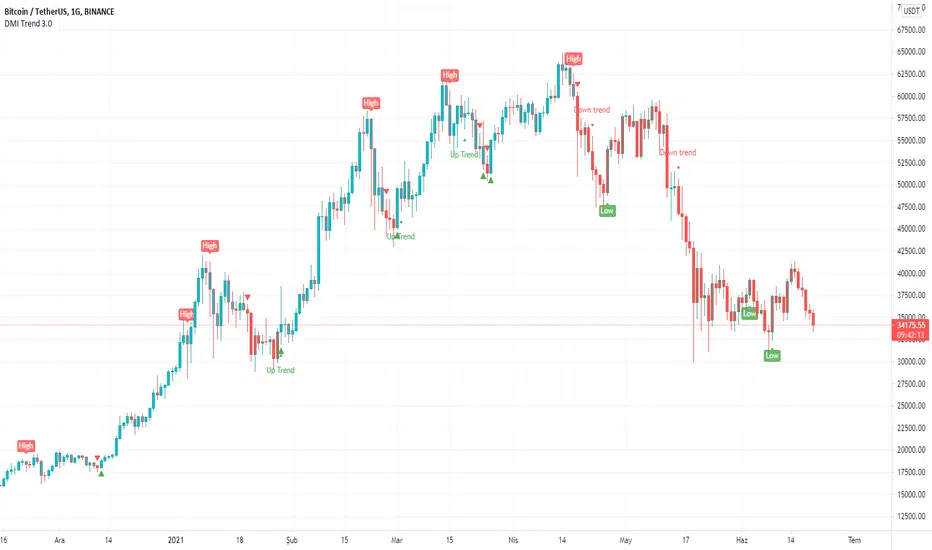
DMI-adxNothing special here
I just play with the formula of ADX and DMI that give this indicator which is combination of both
above zero =bullish
bellow zero =bearish
seems nice to spot trending
