kaka-Buff横盘系统与CVD和LVP
作用:此指标用于识别市场横盘(震荡)区间,检测累积成交量差额(CVD)背离(基于分形和参考方法),并标记基于大成交量K线的关键价格水平(Large Volume Price, LVP)。它通过结合横盘信号、成交量背离和关键价格水平,帮助交易者识别潜在的趋势反转或延续。指标还绘制可自定义的指数移动平均线(EMA)以辅助趋势分析。主要功能:横盘检测:使用EMA标准差(STD)、平均真实波幅(ATR)、平均方向指数(ADX)和布林带宽度(BB宽度)识别低波动性的横盘区间。
分形CVD背离:通过分形枢轴点和成交量差额计算,检测看涨(“+RD”)和看跌(“-RD”)背离,以标签形式显示在图表上。
参考CVD背离:在成交量分布区域(VAH、VAL、POC)内识别简单的CVD背离(基于价格和成交量差额高/低点),以绿色/红色三角形显示。
大成交量价格(LVP):在回看周期(可自主设置长度)内标记最大成交量K线的最高/最低价,绘制线和标签,指示关键支撑/阻力位。
EMA线:绘制20、50、100和200周期的EMA,带开关控制和可自定义颜色,用于趋势可视化。
表格:以可自定义的表格(字体大小/颜色均可调节)显示横盘指标(EMA STD、ATR、ADX、BB宽度)和整体横盘状态。
警报:提供横盘进入/退出、分形CVD背离、参考CVD背离和LVP价格突破的警报。
Consolidation System with CVD and LVP
Purpose: This indicator identifies market consolidation zones, detects Cumulative Volume Delta (CVD) divergences (both fractal-based and reference-based), and marks significant price levels based on large volume bars (Large Volume Price, LVP). It helps traders identify potential trend reversals or continuations by combining consolidation signals, volume-based divergence, and key price levels. The indicator also plots customizable Exponential Moving Averages (EMAs) to aid in trend analysis.Key Features:Consolidation Detection: Uses EMA Standard Deviation (STD), Average True Range (ATR), Average Directional Index (ADX), and Bollinger Bands (BB) width to identify low-volatility consolidation zones.
Fractal CVD Divergence: Detects bullish ("+RD") and bearish ("-RD") divergences using fractal pivot points and a volume delta calculation, displayed as labels on the chart.
Reference CVD Divergence: Identifies simpler CVD divergences (based on price and volume delta highs/lows) within volume profile zones (VAH, VAL, POC), shown as green/red triangles.
Large Volume Price (LVP): Marks the high/low of the highest volume bar within a lookback period with lines and labels, indicating key support/resistance levels.
EMA Lines: Plots EMA 20, 50, 100, and 200 with toggle switches and customizable colors for trend visualization.
Table: Displays consolidation metrics (EMA STD, ATR, ADX, BB width) and overall consolidation status in a customizable table.
Alerts: Provides alerts for consolidation entry/exit, fractal CVD divergences, reference CVD divergences, and LVP price crossings.
חפש סקריפטים עבור "adx"

Liquidity Grab Detector (Stop Hunt Sniper) v2.2📌 Purpose
This indicator detects Stop Hunts (Liquidity Grabs) — false breakouts above/below recent highs or lows — filtered by trend direction, volatility, and volume conditions.
It is designed for scalpers and intraday traders who want to identify high-probability reversal zones.
🧠 How It Works
1. Key Logic
Detects previous swing high / swing low over the Lookback Bars.
Marks a false breakout when price moves beyond the level and closes back inside.
Requires a volume spike on the breakout to confirm liquidity sweep.
2. Trend Filter (EMA 50)
Bullish signals only if price is above EMA 50.
Bearish signals only if price is below EMA 50.
This removes most counter-trend stop hunts.
3. ADX Filter
Signals appear only when ADX < Max ADX (low-trend conditions).
This avoids false signals in strong trending markets.
📈 How to Use
Green Arrows: Bullish stop hunt (potential long entry).
Red Arrows: Bearish stop hunt (potential short entry).
Works best in range conditions, liquidity zones, or near session highs/lows.
Combine with order flow, volume profile, or price action for extra confirmation.
Recommended Timeframes: 1m–15m for scalping; 30m–1h for intraday.
Markets: Crypto, Forex, Indices.
⚙️ Inputs
Lookback Bars — swing detection
Volume Spike Multiplier
EMA Length (trend filter)
Min Retrace — how much price must return inside range
Max ADX — trend filter sensitivity
⚠️ Disclaimer
This script is for educational purposes only and does not constitute financial advice.
Always test thoroughly before live trading.

Nexus v10Nexus v10 - Confluence-Driven Trading Indicator
The Nexus v10 is a sleek, modern, and versatile trading indicator that delivers precise buy and sell signals by synthesizing a confluence of technical factors, including Heikin Ashi candles, RSI, ADX, and EMA crossovers. The name "Nexus" captures its core strength—connecting and synthesizing multiple signals into a cohesive trading decision point. The term evokes a central hub or convergence, reflecting the script’s confluence-based approach, dynamic adaptability, and real-time precision for scalping. Designed for traders seeking clarity and efficiency, it’s a powerful tool for navigating dynamic markets.
Key Features:
Confluence-Based Signals: Combines weighted signals from Heikin Ashi, RSI, ADX, and EMA crossovers to generate high-probability buy/sell signals.
Neutral Status Logic: Limits consecutive signals to two per direction, requiring a "Neutral" status before the second signal to ensure disciplined trading.
Clean Visualization: Displays only the two most recent buy/sell signals, keeping the chart uncluttered and focused on current opportunities.
Dynamic Adaptability: Offers customizable RSI thresholds, EMA lengths, MTF settings, and dynamic overbought/oversold levels to fit any market or style.
Candle Coloring & Inside Bars: Highlights overbought/oversold conditions and inside bars with customizable colors for enhanced context.
Real-Time Debug Table: Provides live insights into signal status, RSI, MTF trends, and ADX for informed decision-making.
How It Works:
Nexus v10 integrates multiple technical factors, including MTF analysis (default: 3m, 15m, 240m, D), RSI, ADX, and EMA crossovers, to produce signals when confluence criteria are met. Signals appear as circles on the chart, with a maximum of two visible signals per direction (buy or sell). A second signal in the same direction requires a neutral status, ensuring precision. Ideal for scalping, swing, and trend trading across stocks, forex, futures, and more.
Usage Tips:
Customize settings like RSI thresholds and MTF periods to align with your trading strategy.
Use the debug table to monitor confluence factors and signal status in real-time.
Pair with sound risk management and personal analysis for optimal results.
Note:
Always backtest thoroughly in your trading environment to validate performance. Let the Nexus v10 guide your next trade with precision and clarity!

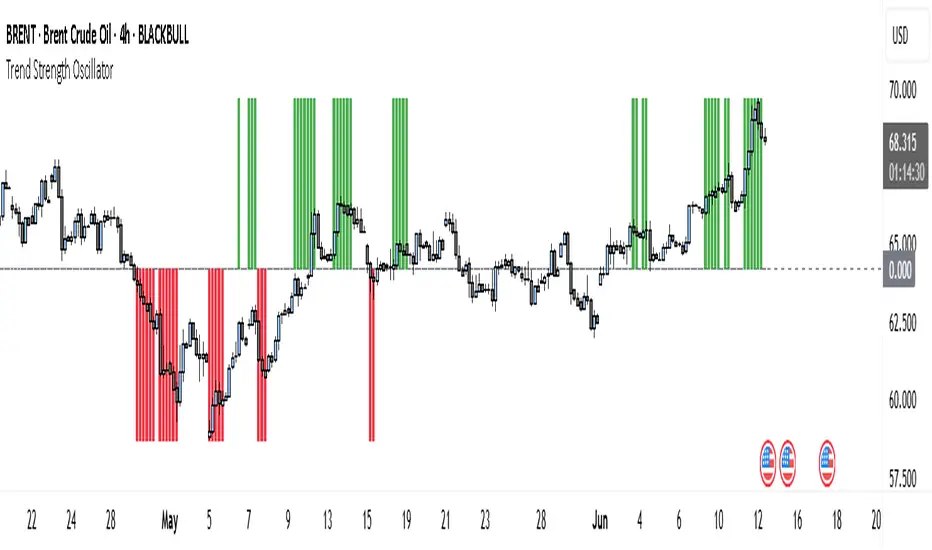
Trend Strength Oscillator📌 What Is the Trend Strength Oscillator?
The Trend Strength Oscillator is a visual tool that helps traders understand the overall direction and strength of the market trend. Instead of using multiple indicators separately, this tool combines three trusted methods into one clear, color-coded bar chart. The bars change based on whether the market is strongly trending up, down, or just moving sideways.
Imagine it as a traffic light for trading:
• Green means it’s safe to consider buying (strong uptrend).
• Red means consider selling or avoiding longs (strong downtrend).
• Gray means wait, the market isn’t clearly trending.
🧠 How It Works — The 3 Main Components
1. EMA Slope
The EMA (Exponential Moving Average) tracks the average price but reacts more quickly to changes. If the EMA is rising, it means the market is likely moving upward. If it’s falling, the trend is likely downward.
2. RSI Direction
RSI (Relative Strength Index) measures momentum. This tool compares the RSI to its smoothed average. If the RSI is above its average, momentum is up. If it’s below, momentum is down.
3. ADX Strength
ADX (Average Directional Index) measures how strong a trend is, not the direction. So even if EMA and RSI agree on a trend, the ADX must confirm it’s strong enough to be worth trading.
Only when all three indicators agree do we consider it a strong trend.
🧮 What the Oscillator Shows
The result of combining those components is a number that becomes a colored bar:
• +2 means all three signals are bullish → green bar.
• -2 means all three signals are bearish → red bar.
• Anything else (e.g., mixed signals or weak ADX) → gray bar.
This makes the chart super easy to read at a glance, even for beginners.
📈 How to Use It in Trading
You can use the Trend Strength Oscillator in a few simple ways:
• Entering Trades:
Look for a green bar when you want to buy or go long. Look for a red bar when you want to sell or go short. These bars mean all systems are “go” in the same direction.
• Avoiding Mistakes:
If the bar is gray, it’s a warning that the market is undecided or weak. It’s often better to wait for a clearer signal rather than force a trade.
• Managing Existing Trades:
If you’re in a trade and the bar color shifts back to gray, that can be a clue that the trend is losing strength. You might tighten your stop-loss or take some profit.
🧭 Final Thoughts
This indicator doesn’t give you a trade entry every few minutes. Instead, it helps you stay on the right side of strong moves and avoid choppy or sideways markets. It’s especially helpful for:
• Trend-following traders
• People who want clean, simple visuals
• Beginners who get overwhelmed with too many indicators
Let me know if you'd like to see this paired with another tool like volume or MACD, or if you’d like a chart screenshot to visualize how this looks live.
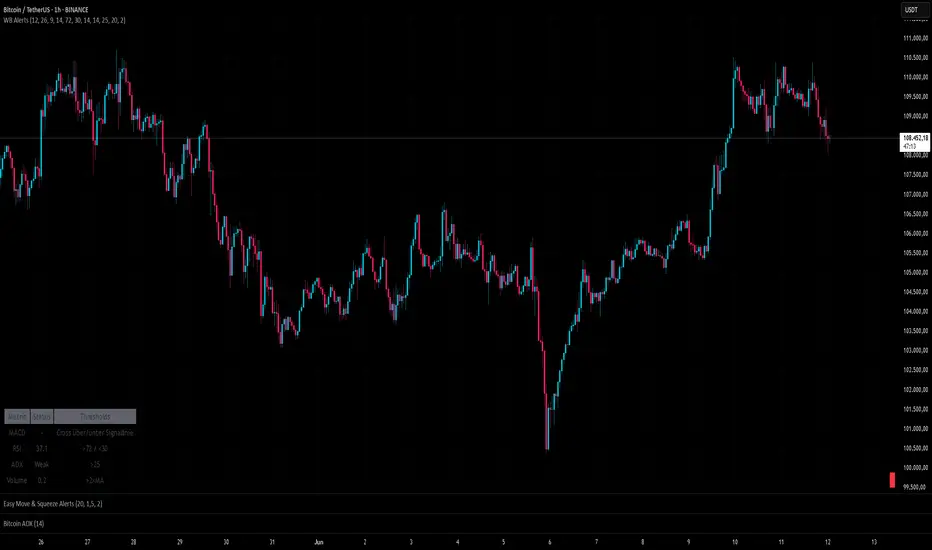
SignalWatcherThis script provides real-time monitoring of multiple technical indicators and generates visual alerts and configurable alarms:
Inputs & Mini-GUI
MACD Settings: Activation, fast, slow and signal line lengths.
RSI Settings: Activation, period length, overbought and oversold thresholds.
ADX Settings: Activation, period length, smoothing and trend strength thresholds.
Volume Settings: Activation, length of the volume MA, factor for detecting volume peaks.
Global Alert: A single composite alert for all signals.
Plot Settings: Activation and deactivation of the plot displays for RSI, MACD (lines) and ADX. Color and width selection for each line.
Display Table: Activation of the status table.
Calculations
MACD: Generates macdLine and signalLine, detects crossovers (bullish) and crossunders (bearish).
RSI: Calculates rsi_val, compares with rsi_ob and rsi_os to determine overbought/oversold.
ADX: Uses ta.dmi() to determine adx_val and checks against adx_thresh for trend strength.
Volume Spike: Exceptional trading activity detected by moving average (vol_ma) and factor (vol_factor).
Alert conditions
Six individual alertcondition() calls: MACD ↑/↓, RSI Overbought/Oversold, ADX Strong Trend, Volume Spike.
Optional composite alert (enable_global): A single notification when one of the indicator signals strikes.
Visual overlays
Alarm overlay (bottom right): Red table with text lines for currently triggered signals.
Status Table (bottom left): Overview of all indicators with current status (On/Off, Values, Thresholds).
Plots in the chart
RSI, MACD Line & Signal Line, ADX: Are displayed as lines if activated in the GUI; configurable colors & line thicknesses.
Toolbar-FrenToolbar-Fren is a comprehensive, data-rich toolbar designed to present a wide array of key metrics in a compact and intuitive format. The core philosophy of this indicator is to maximize the amount of relevant, actionable data available to the trader while occupying minimal chart space. It leverages a dynamic color-coded system to provide at-a-glance insights into market conditions, instantly highlighting positive/negative values, trend strength, and proximity to important technical levels.
Features and Data Displayed
The toolbar displays a vertical column of critical data points, primarily calculated on the Daily timeframe to give a broader market context. Each cell is color-coded for quick interpretation.
DAY:
The percentage change of the current price compared to the previous day's close. The cell is colored green for a positive change and red for a negative one.
LOD:
The current price's percentage distance from the Low of the Day.
HOD
The current price's percentage distance from the High of the Day.
MA Distances (9/21 or 10/20, 50, 200)
These cells show how far the current price is from key Daily moving averages (MAs).
The values are displayed either as a percentage distance or as a multiple of the Average Daily Range (ADR), which can be toggled in the settings.
The cells are colored green if the price is above the corresponding MA (bullish) and red if it is below (bearish).
ADR
Shows the 14-period Average Daily Range as a percentage of the current price. The cell background uses a smooth gradient from green (low volatility) to red (high volatility) to visualize the current daily range expansion.
ADR%/50: A unique metric showing the distance from the Daily 50 SMA, measured in multiples of the 14-period Average True Range (ATR). This helps quantify how extended the price is from its mean. The cell is color-coded from green (close to the mean) to red (highly extended).
RSI
The standard 14-period Relative Strength Index calculated on the Daily timeframe. The background color changes to indicate potentially overbought (orange/red) or oversold (green) conditions.
ADX
The 14-period Average Directional Index (ADX) from the Daily timeframe, which measures trend strength. The cell is colored to reflect the strength of the trend (e.g., green for a strong trend, red for a weak/non-trending market). An arrow (▲/▼) is also displayed to indicate if the ADX value is sloping up or down.
User Customization
The indicator offers several options for personalization to fit your trading style and visual preferences:
MA Type
Choose between using Exponential Moving Averages (EMA 9/21) or Simple Moving Averages (SMA 10/20) for the primary MA calculations.
MA Distance Display
Toggle the display of moving average distances between standard percentage values and multiples of the Average Daily Range (ADR).
Display Settings
Fully customize the on-chart appearance by selecting the table's position (e.g., Top Right, Bottom Left) and the text size. An option for a larger top margin is also available.
Colors
Personalize the core Green, Yellow, Orange, and Red colors used throughout the indicator to match your chart's theme.
Technical Parameters
Fine-tune the length settings for the ADX and DI calculations.

Q Impulse EntryQ Impulse Entry
A directional entry system combining impulse breakouts, Elder's momentum confirmation, and ADX trend validation. Designed for clean trade setups with multi-step filtering, entry markers, and real-time alerts.
🔧 Core Logic
This is not a basic mashup — each filter plays a distinct technical role:
1. Impulse Breakout Engine
• Detects sharp directional price breaks using ATR-adjusted dynamic zones
• Impulse window controls sensitivity to local highs/lows
2. Elder Momentum Filter
• Confirms signal using MACD histogram and EMA alignment
• Blocks entries when internal momentum contradicts price move
3. ADX Trend Strength Filter
• Uses threshold-based ADX logic to validate trend power
• Filters out noise in flat or weak markets
The system requires all three filters to agree before confirming an entry.
📈 Visual Feedback
• ⇑ / ⇓ arrows mark confirmed entry signals
• Colored entry dots plotted at signal price help confirm timing and aid in multi-position layering
• Impulse breakout zones and EMA are displayed for directional context
• Clean layout, no repainting, designed for real-time use
⚙️ Configurable Inputs
• Impulse Window — controls breakout signal sensitivity
• ATR Multiplier — defines width of impulse breakout zones
(Elder and ADX filters are embedded and fine-tuned)
✨ Highlights
• Triple-filter signal logic = fewer false positives
• Entry dots + arrows for visual clarity and scaling in
• Lightweight, non-repainting, and alert-ready
• Best suited for Forex and all timeframes
• Ideal for breakout, trend-following, or hybrid systems
• Built-in alerts and customizable zones
• Always apply risk management suited to your capital and strategy
Trade with clarity — stay for quality.
LANZ Strategy 4.0🔷 LANZ Strategy 4.0 — Trend Impulse Detection with Risk Management
LANZ Strategy 4.0 is a multi-indicator trend strategy designed for short to medium-term trading on any asset or timeframe. It combines Parabolic SAR, Supertrend, ADX, and time zone highlighting to detect and confirm trend impulses, while managing entries with dynamic Stop Loss (SL) and Take Profit (TP) levels.
🧠 Core Components:
Parabolic SAR: Identifies short-term trend reversals.
Supertrend: Highlights trend continuation zones.
ADX Filter: Ensures trend strength by filtering entries when ADX exceeds a defined threshold.
Impulse Detection Logic: Detects and confirms movement impulses with a counter, only generating trade signals on confirmed sequences.
Risk Management: Calculates dynamic SL/TP with a default risk-reward ratio of 1:2, minimum SL of 4 pts, and maximum of 12 pts.
📊 Visual Features:
Trend lines from Supertrend and SAR.
Colored background zones for different sessions (Asia, NY).
Labels and lines for entry, SL, and TP.
Movement number labels help visualize impulse progression.
Alerts when a new impulse is confirmed.
⚙️ How It Works:
The strategy waits for a confirmed impulse (i.e., change in SAR + Supertrend + ADX filter).
Once a valid impulse is confirmed:
A trade signal (BUY/SELL) is shown.
SL and TP levels are calculated and drawn.
The script monitors live price to determine if SL or TP is hit.
Impulse counter advances to label movement progression.
🔔 Alerts:
You will receive an alert each time a new valid impulse is confirmed, indicating a potential trading opportunity.
📝 Notes:
Script is intended for discretionary or assisted trading, not automated execution.
Works best during active sessions with visible trend direction.
You can adjust ATR period, multiplier, SL padding, and impulse thresholds.
Credits:
Developed by LANZ combines established technical indicators and original impulse-count logic.

DMI Percentile MTF📈 DMI Percentile MTF – Custom Technical Indicator
This indicator is an enhanced version of the classic Directional Movement Index (DMI), converting +DI, -DI, and ADX values into dynamic percentiles ranging from 0% to 100%, making it easier to interpret the strength and direction of a trend.
⚙️ Key Features:
Percentile Normalization: Calculates where current values stand within a historical range (default: 100 bars), providing clearer overbought/oversold context.
+DI (green): Indicates bullish directional strength.
-DI (orange): Indicates bearish directional strength.
ADX (fuchsia): Measures overall trend strength (rising = strong trend, falling = flat market).
20% / 80% reference lines: Help identify weak or strong conditions.
Multi-Timeframe (MTF) Support: Analyze a higher timeframe trend (e.g., daily) while viewing a lower timeframe chart (e.g., 1h).
📊 How to Read It:
+DI > -DI → bullish trend dominance.
-DI > +DI → bearish trend dominance.
ADX rising → strengthening trend (regardless of direction).
ADX falling → sideways or consolidating market.
Values above 80% → historically high / strong conditions.
Values below 20% → historically low / weak conditions or potential breakout setup.

Deadzone Pro @DaviddTechDeadzone Pro by @DaviddTech – Adaptive Multi-Strategy NNFX Trading System
Deadzone Pro by @DaviddTech is a meticulously engineered trading indicator that strictly adheres to the No-Nonsense Forex (NNFX) methodology. It integrates adaptive trend detection, dual confirmation indicators, advanced volatility filtering, and dynamic risk management into one powerful, visually intuitive system. Ideal for traders seeking precision and clarity, this indicator consistently delivers high-probability trade setups across all market conditions.
🔥 Key Features:
The Setup:
Adaptive Hull Moving Average Baseline: Clearly identifies trend direction using an advanced, gradient-colored Hull MA that intensifies based on trend strength, providing immediate visual clarity.
Dual Confirmation Indicators: Combines Waddah Attar Explosion (momentum detector) and Bull/Bear Power (strength gauge) for robust validation, significantly reducing false entries.
Volatility Filter (ADX): Ensures entries are only made during strong trending markets, filtering out weak, range-bound scenarios for enhanced trade accuracy.
Dynamic Trailing Stop Loss: Implements a SuperTrend-based trailing stop using adaptive ATR calculations, managing risk effectively while optimizing exits.
Dashboard:
💎 Gradient Visualization & User Interface:
Dynamic gradient colors enhance readability, clearly indicating bullish/bearish strength.
Comprehensive dashboard summarizes component statuses, real-time market sentiment, and entry conditions at a glance.
Distinct and clear buy/sell entry and exit signals, with adaptive stop-loss levels visually plotted.
Candlestick coloring based on momentum signals (Waddah Attar) for intuitive market reading.
📈 How to Interpret Signals:
Bullish Signal: Enter when Hull MA baseline trends upward, both confirmation indicators align bullish, ADX indicates strong trend (>25), and price breaks above the previous trailing stop.
Bearish Signal: Enter short or exit long when Hull MA baseline trends downward, confirmations indicate bearish momentum, ADX confirms trend strength, and price breaks below previous trailing stop.
📊 Recommended Usage:
Timeframes: Ideal on 1H, 4H, and Daily charts for swing trading; effective on shorter (5M, 15M) charts for day trading.
Markets: Compatible with Forex, Crypto, Indices, Stocks, and Commodities.
The Entry & Exit:
🎯 Trading Styles:
Choose from three distinct trading modes:
Conservative: Requires full alignment of all indicators for maximum accuracy.
Balanced (Default): Optimized balance between signal frequency and reliability.
Aggressive: Fewer confirmations needed for more frequent trading signals.
📝 Credits & Originality:
Deadzone Pro incorporates advanced concepts inspired by:
Hull Moving Average by @Julien_Eche
Waddah Attar Explosion by @LazyBear
Bull Bear Power by @Pinecoders
ADX methodology by @BeikabuOyaji
This system has been significantly refactored and enhanced by @DaviddTech to maximize synergy, clarity, and usability, standing apart distinctly from its original components.
Deadzone Pro exemplifies precision and discipline, aligning fully with NNFX principles to provide traders with a comprehensive yet intuitive trading advantage.

Money Flow Oscillator [BullByte]
Overview :
The Money Flow Oscillator is a versatile technical analysis tool designed to provide traders with insights into market momentum through the Money Flow Index (MFI). By integrating trend logic, dynamic support/resistance levels, multi-timeframe analysis, and additional indicators like ADX and Choppiness, this script delivers a detailed view of market conditions and signal strength—all while adhering to TradingView’s publication guidelines.
Key Features :
Money Flow Analysis :
Uses the MFI to assess buying and selling pressure, helping traders gauge market momentum.
Trend Switch Logic :
Employs ATR-based calculations to determine trend direction. The background color adjusts dynamically to signal bullish or bearish conditions, and a prominent center line changes color to reflect the prevailing trend.
Dynamic Support/Resistance :
Calculates oscillator support and resistance over a pivot lookback period. These levels help you identify potential breakouts or reversals as the MFI moves above or below prior levels.
Signal Metrics & Classifications :
Combines MFI values with additional metrics to classify signals into categories such as “Strong Bullish,” “Bullish,” “Bearish,” or “Strong Bearish.” An accompanying note provides details on momentum entry and overall signal strength.
Multi-Timeframe Order Flow Confirmatio n:
Analyzes the MFI on a higher timeframe to confirm order flow. This extra layer of analysis helps verify the short-term signals generated on your primary chart.
Volume and ADX Integration :
Incorporates volume analysis and a manual ADX calculation to further validate signal strength and trend stability. A dashboard displays these metrics for quick reference.
Choppiness Indicator :
Includes a choppiness index to determine if the market is trending or choppy. When the market is identified as choppy, the script advises caution by adjusting the overall signal note.
Comprehensive Dashboard :
A built-in dashboard presents key metrics—including ADX, MFI, order flow, volume score, and support/resistance details—allowing you to quickly assess market conditions at a glance.
How to Use :
Trend Identification : Monitor the dynamic background and center line colors to recognize bullish or bearish market conditions.
Signal Confirmation : Use the oscillator support/resistance levels along with the signal classifications and dashboard data to make informed entry or exit decisions.
Multi-Timeframe Analysis : Validate short-term signals with the higher timeframe MFI order flow confirmation.
Risk Management : Always combine these insights with your own risk management strategy and further analysis.
Disclaimer :
This indicator is provided for educational and informational purposes only. It does not constitute financial advice. Always perform your own analysis and use proper risk management before making any trading decisions. Past performance is not indicative of future results.

The JewelThe Jewel is a comprehensive momentum and trend-based indicator designed to give traders clear insights into potential market shifts. By integrating RSI, Stochastic, and optional ADX filters with an EMA-based trend filter, this script helps identify high-conviction entry and exit zones for multiple trading styles, from momentum-based breakouts to mean-reversion setups.
Features
Momentum Integration:
Leverages RSI and Stochastic crossovers for real-time momentum checks, reducing noise and highlighting potential turning points.
Optional ADX Filter:
Analyzes market strength; only triggers signals when volatility and directional movement suggest strong follow-through.
EMA Trend Filter:
Identifies broad market bias (bullish vs. bearish), helping traders focus on higher-probability setups by aligning with the prevailing trend.
Caution Alerts:
Flags potentially overbought or oversold conditions when both RSI and Stochastic reach extreme zones, cautioning traders to manage risk or tighten stops.
Customizable Parameters:
Fine-tune RSI, Stochastic, ADX, and EMA settings to accommodate various assets, timeframes, and trading preferences.
How to Use
Momentum Breakouts: Watch for RSI cross above a set threshold and Stochastic cross up, confirmed by ADX strength and alignment with the EMA filter for potential breakout entries.
Mean Reversion: Look for caution signals (RSI & Stoch extremes) as early warnings for trend slowdown or reversal opportunities.
Trend Continuation: In trending markets, rely on the EMA filter to stay aligned with the primary direction. Use momentum crosses (RSI/Stochastic) to time add-on entries or exits.
Important Notes
Non-Investment Advice
The Jewel is a technical analysis tool and does not constitute financial advice. Always use proper risk management and consider multiple confirmations when making trading decisions.
No Warranty
This indicator is provided as-is, without warranty or guarantees of performance. Traders should backtest and verify its effectiveness on their specific instruments and timeframes.
Collaborate & Share
Feedback and suggestions are welcome! Engaging with fellow traders can help refine and adapt The Jewel for diverse market conditions, strengthening the TradingView community as a whole.
Happy Trading!
If you find this script valuable, please share your feedback, ideas, or enhancements. Collaboration fosters a more insightful trading experience for everyone.
Divergence-Weighted clouds V 1.0Comprehensive Introduction to Divergence-Weighted Clouds V 1.0 (DW)
In financial markets, the analysis of volume and price plays a fundamental role in identifying trends, reversals, and making trading decisions. Volume indicates the level of market interest and liquidity focused on an asset, while price reflects changes in supply and demand. Alongside these two elements, market volatility, support and resistance levels, and cash flow are also critical factors that help analysts form a comprehensive view of the market. The Divergence-Weighted Clouds V 1.0 (DW) indicator is designed to simultaneously analyze these fundamental elements and other important market dynamics. To achieve this, it utilizes data generated from 13 distinct indicators, each measuring specific aspects of the market:
Trend and Momentum: Analyzing the direction and strength of price movements.
Volume and Cash Flow: Understanding the inflow and outflow of capital in the market.
Oscillators: Identifying overbought and oversold conditions.
Support and Resistance Levels: Highlighting key price levels.
The Core Challenge: Standardizing Diverse Data
The primary challenge lies in the fact that the outputs of these indicators differ significantly in scale and meaning. For example:
Volume often generates very large values (e.g., millions of shares).
Oscillators provide data within fixed ranges (e.g., 0 to 100).
Price-based metrics may vary in entirely different scales (e.g., tens or hundreds of units).
These differences make direct comparison of the data impractical. The DW indicator resolves this challenge through an advanced mathematical methodology:
Normalization and Hierarchical Evaluation:
To standardize the data, a process called hierarchical EMA evaluation is employed. Initially, the raw outputs of each indicator are computed over different timeframes using Exponential Moving Averages (EMA) based on prime-number intervals.
Hierarchical Scoring:
A pyramid-like structure is used to evaluate the performance of each indicator. This method examines the relationships and distances between EMAs for each indicator and assigns a numerical score.
Final Integration and Aggregation:
The scores of all 13 indicators are then mathematically aggregated into a single number. This final value represents the overall market performance at that moment, enabling a unified interpretation of volume, price, and volatility.
-------------------------------------------------------------------------------------------------
Indicators Used in DW
To achieve this comprehensive analysis, DW leverages 13 carefully selected indicators, each offering unique insights into market dynamics:
Trend and Momentum
- ALMA (Arnaud Legoux Moving Average): Reduces lag for faster trend identification.
- Aroon Up: Analyzes the stability of uptrends.
- ADX (Average Directional Index): Measures the strength of a trend.
Volume and Cash Flow
- CMF (Chaikin Money Flow): Identifies cash flow based on price and volume.
- EFI (Elder’s Force Index): Evaluates the strength of price changes alongside volume.
- Volume Delta: Tracks the balance between buying and selling pressure.
- Raw Volume: Analyzes unprocessed volume data.
Oscillators
- Fisher Transform: Normalizes data to detect price reversals.
- MFI (Money Flow Index): Identifies overbought and oversold levels.
Support, Resistance, and Price Dynamics
- Ichimoku Lines (Tenkan-sen & Kijun-sen): Analyzes support and resistance levels.
- McGinley Dynamic: Minimizes errors caused by rapid price movements.
- Price Hierarchy: Evaluates the relative position of prices across timeframes.
-------------------------------------------------------------------------------------------------
Example: Hierarchical Scoring for Price Analysis
To illustrate how the DW indicator processes data, let’s take the price as an example and analyze it using the first four prime numbers (2, 3, 5, and 7) as intervals for Exponential Moving Averages (EMAs). This example will demonstrate how the indicator evaluates price relationships and assigns a hierarchical score.
Step-by-Step Calculation:
1. Raw Data:
Let’s assume the closing prices for a specific asset over recent days are as follows:
Day 1: 100
Day 2: 102
Day 3: 101
Day 4: 104
Day 5: 103
Day 6: 105
Day 7: 106
2. Calculate EMAs for Prime Number Intervals:
Using the prime-number intervals (2, 3, 5, 7), we calculate the EMAs for these timeframes:
EMA(2): Averages the last 2 closing prices equal to 105.33
EMA(3): Averages the last 3 closing prices equal to 104.25
EMA(5): Averages the last 5 closing prices equal to 103.17
EMA(7): Averages the last 7 closing prices equal to 102.67
3. Compare EMAs Hierarchically:
To assign a score, the relationships between the EMAs are analyzed hierarchically. We evaluate whether each smaller EMA is greater or less than the larger ones:
Compare EMA(2) to EMA(3), EMA(5), and EMA(7):
EMA(2) > EMA(3):105.33>104.25 => +1
EMA(2) > EMA(5): 105.33>103.17 => +1
EMA(2) > EMA(7): 105.33 > 102.67 => +1
Compare EMA(3) to EMA(5) and EMA(7):
EMA(3) > EMA(5) : 104.25>103.17 => +1
EMA(3) > EMA(7):104.25 >102.67 => +1
Compare EMA(5) to EMA(7):
EMA(5) > EMA(7):103.17>102.67 => +1
Assign a Score:
Each positive comparison adds +1 to the score. In this example:
Total Score for Price = 1+1+1+1+1+1+1=6
-------------------------------------------------------------------------------------------------
Logic Behind Scoring:
The score reflects the "steepness" or "hierarchy" of price movement across different timeframes:
A higher score indicates that shorter EMAs are consistently above longer ones, signaling a strong upward trend.
A lower score or negative values would indicate the opposite (e.g., short-term prices lagging behind long-term averages, signaling weakness or potential reversal).
This method ensures that even complex data points (like price, volume, or oscillators) can be distilled into a single, comparable numerical value. When repeated across all 13 indicators, it enables the DW indicator to create a unified, normalized score that represents the overall market condition.
-------------------------------------------------------------------------------------------------
Settings and Customization in Divergence-Weighted Clouds V 1.0 (DW)
The Divergence-Weighted Clouds V 1.0 (DW) indicator provides extensive customization options to empower traders to fine-tune the analysis according to their specific needs and trading strategies. Each of the 13 indicators is fully customizable through the settings menu, allowing adjustments to parameters such as lookback periods, sensitivity, and calculation methods. This flexibility ensures that DW can adapt seamlessly to a wide range of market conditions and asset classes.
Key Features of the Settings Menu
1. Global Settings:
Lookback Periods: Define the timeframe for data aggregation and analysis across all indicators.
Normalization Settings: Adjust parameters to refine the process of scaling diverse outputs to a comparable range.
Divergence Sensitivity: Control the weight given to indicators deviating from the average, enabling a focus on outliers or broader trends.
2. Indicator-Specific Settings:
Each of the 13 indicators has its own dedicated section in the settings menu for precise customization. Examples include:
ALMA (Arnaud Legoux Moving Average):
Window Size: Set the number of bars used for calculating the average.
Offset: Control the sensitivity of trend detection.
Sigma: Adjust the smoothing factor for the calculation.
Aroon Up:
Length: Modify the lookback period for identifying highs and evaluating uptrends.
ADX (Average Directional Index):
DI Length: Specify the period for calculating directional indicators (DI).
ADX Smoothing: Adjust the smoothing period for trend strength analysis.
3. Oscillator Settings:
Fisher Transform:
Length: Customize the period for normalization and detecting reversals.
Money Flow Index (MFI):
Length: Set the timeframe for analyzing overbought and oversold conditions.
4. Volume and Cash Flow Settings:
Chaikin Money Flow (CMF):
Length: Define the period for analyzing cash flow based on price and volume.
Volume Delta:
Timeframe: Select a custom timeframe for analyzing buying and selling pressure.
5. Support and Resistance Settings:
In the Support and Resistance category of the DW indicator, we address the logic behind four components:
McGinley Dynamic
Price Hierarchy
Base Line
Conversion Line
The settings structure for this section primarily focuses on McGinley Dynamic, while the other three elements—Price Hierarchy, Base Line, and Conversion Line—operate based on predefined values derived from the mathematical structure and logic of the DW indicator. Let’s explore this in detail:
McGinley Dynamic
Length: The only customizable setting in this category. Users can adjust the length parameter to tailor the responsiveness of the McGinley Dynamic to different market conditions. McGinley Dynamic adapts dynamically to the speed of price changes, reducing lag and minimizing false signals. Its flexibility allows it to serve as both a trendline and a support/resistance guide.
Price Hierarchy
The Price Hierarchy component in DW leverages a pyramid structure and triangular scoring based on prime-number intervals (e.g., 2, 3, 5, 7). This methodology ensures a mathematically robust framework for evaluating the relative position of prices across multiple timeframes.
Why No Settings for Price Hierarchy?
The unique properties of prime numbers make them ideal for constructing this hierarchical scoring system. Changing these intervals would compromise the integrity of the calculations, as they are specifically designed to ensure precision and consistency. Therefore, no customization is allowed for this component in the settings menu.
Conversion Line and Base Line
The Conversion Line (Tenkan-sen) and Base Line (Kijun-sen) are integral components derived from DW’s scoring methodology and represent short-term and medium-term equilibrium levels, respectively. These lines are calculated using the Ichimoku framework, which provides a reliable and well-recognized mathematical basis:
Conversion Line: The average of the highest high and lowest low over a fixed period of 9 bars.
Base Line: The average of the highest high and lowest low over a fixed period of 26 bars./list]
Both lines are utilized in DW as part of the 13 generated indicator variables to assess market equilibrium.
Why Default Values for Conversion and Base Lines?
These values are fixed to the default Ichimoku parameters to:
- Ensure consistency with the broader Ichimoku logic for users familiar with its methodology.
- Prevent confusion in the settings menu, as customization of these parameters is unnecessary for DW’s scoring system.
Important Note: While these lines are derived using Ichimoku logic, they are not standalone Ichimoku components but are embedded into DW’s mathematical structure. In the next section, we will elaborate on how the Ichimoku framework is employed for the graphical visualization of DW’s calculations.
Displaying the Results of 13 Indicator Integration in DW Indicator
The Divergence-Weighted Clouds V 1.0 (DW) employs a rigorous methodology to integrate 13 distinct indicators into a single, normalized output. Here's how the process works, followed by an explanation of the visualization strategy leveraging Ichimoku logic.
Simultaneous Evaluation of 13 Indicators
1. Mathematical Integration Logic:
Normalization: The outputs of all 13 indicators (e.g., ALMA, ADX, CMF) are normalized into comparable ranges, ensuring compatibility despite their diverse scales.
Hierarchical Scoring with Prime Intervals: For each indicator, Exponential Moving Averages (EMAs) are calculated using prime-number intervals (e.g., 2, 3, 5, 7). These EMAs are evaluated through a triangular scoring system, creating individual scores for each indicator.
Divergence Weighting: Indicators showing significant divergence from group averages are given higher weights, amplifying their influence on the final score.
2. Unified Score Calculation:
The normalized and weighted outputs of all 13 indicators are aggregated into a single score.
This score represents the overall behavior of the market, based on the simultaneous evaluation of trend, volume, oscillators, and price metrics.
------------------------------------------------------------------------------------------
Challenge of Visualizing Results
The next challenge lies in effectively visualizing the score to make it actionable for traders. The DW indicator resolves this challenge by leveraging the Ichimoku framework.
Why Ichimoku for Visualization?
The Ichimoku system is known for its clear and predictive visualization capabilities, making it ideal for representing DW’s complex calculations:
1. Cloud-Based Display: Ichimoku Clouds (Kumo) are intuitive for identifying equilibrium zones and future price movements.
2. Projection Ability: The forward-projected Leading Spans (Senkou A and B) provide predictive insights based on past and current data.
3. Trader Familiarity: Ichimoku is widely recognized, reducing the learning curve for users.
Implementation of Ichimoku Logic
1. Mapping Score to Price:
The score is normalized and mapped to price using a scale factor, ensuring alignment with price data while preserving DW’s analytical integrity.
2. Ichimoku Cloud Lines:
Conversion Line (Tenkan-sen): Short-term equilibrium based on the score, calculated using a 9-period high-low average.
Base Line (Kijun-sen): Medium-term equilibrium calculated using a 26-period high-low average.
Leading Spans (Senkou A & B):
- Senkou A: Average of the Conversion and Base Lines.
- Senkou B: High-low average over a 52-period window.
Lagging Span (Chikou): Unlike traditional Ichimoku, DW’s Lagging Span reflects the Nebula Score shifted backward, providing a historical perspective on combined indicator behavior
3. Cloud Dynamics:
The Kumo Cloud is filled based on the relative position of Senkou A and Senkou B, using color shading to distinguish bullish and bearish conditions.
------------------------------------------------------------------------------------------
Customization in Computational Settings
The core computational components of DW allow some customization for sensitivity adjustments:
Divergence Sensitivity: Controls the weight assigned to indicators with higher divergence.
Volatility Normalization: Adjusts the lookback period for volatility adjustments, refining the Nebula Score scaling.
------------------------------------------------------------------------------------------
Advantages of Using Ichimoku Logic
1. Predictive Visualization:
The forward-projected cloud provides actionable insights for identifying trends and reversals earlier than traditional Ichimoku.
2. Aligned Lagging Span:
DW’s Lagging Span represents the normalized evaluation of all 13 indicators, offering a unique perspective beyond just closing price.
3. Intuitive Interpretation:
Traders familiar with Ichimoku can easily interpret DW’s outputs, making it accessible and effective.
Conclusion
By combining rigorous mathematical evaluation with Ichimoku’s visualization strengths, DW provides traders with a clear, actionable representation of market conditions. This ensures that the complex integration of 13 indicators is not only analytically robust but also visually intuitive.
------------------------------------------------------------------------------------------
Comparison Between Divergence-Weighted Clouds V 1.0 (DW) and Traditional Ichimoku: NVIDIA 4H Chart
The chart showcases a side-by-side comparison of the Divergence-Weighted Clouds V 1.0 (DW) indicator (on the left) and the Traditional Ichimoku indicator (on the right). This comparison highlights the differences in how the two indicators interpret market trends and project equilibrium zones using their respective methodologies.
Key Observations and Insights
1. Base and Conversion Line Movements:
On Thursday, November 21, 2024, 17:30, in the DW indicator (left chart), the Base Line crosses above the Conversion Line, signaling a shift in medium-term equilibrium relative to short-term equilibrium.
On the Traditional Ichimoku (right chart), this crossover is not reflected until Monday, November 25, 2024, 17:30, occurring 4 days later.
Significance:
The DW indicator identifies the crossover and equilibrium shift significantly earlier due to its ability to process and normalize data from 13 distinct indicators.
This predictive capability provides traders with earlier insights, enabling them to anticipate changes and adjust their strategies proactively.
2. Cloud Dynamics and Leading Spans:
In both charts, the cloud (Kumo) represents the equilibrium and potential support/resistance zones.
The DW indicator’s Leading Span A and Leading Span B react faster to market changes, creating a more responsive and forward-looking cloud compared to the traditional Ichimoku.
Example:
On the DW chart (left), the cloud begins shifting to reflect the crossover earlier, signaling potential future support/resistance levels.
In the Ichimoku chart (right), the cloud reacts more slowly, lagging behind the DW indicator.
3. Lagging Span (Chikou Line):
In the DW indicator, the Lagging Span is based on the normalized output of the 13 indicators, reflecting their aggregated behavior rather than just the closing price shifted backward as in the traditional Ichimoku.
This provides a unique perspective on past market strength, aligning the Lagging Span more closely with the overall market condition derived from DW’s computations.
4. Price Alignment:
In the DW indicator, all normalized scores and values are mapped to align with price action, ensuring that the visualization remains intuitive while incorporating complex calculations.
------------------------------------------------------------------------------------------
Advantages of DW Over Traditional Ichimoku
1.Earlier Signal Detection:
As demonstrated by the Base and Conversion Line crossover, DW detects changes in market equilibrium 4 days earlier, giving traders a significant advantage in anticipating price movements.
2. Enhanced Predictive Power:
The Leading Spans in DW’s cloud react faster, providing clearer forward-looking support and resistance zones compared to the traditional Ichimoku.
3. Comprehensive Data Integration:
While the Ichimoku relies solely on price-based calculations, DW integrates outputs from 13 distinct indicators, offering a more robust and comprehensive analysis of market conditions.
4. Alignment with Market Behavior:
The DW Lagging Span reflects the aggregated score of multiple indicators, aligning more closely with overall market sentiment and providing a deeper context than the price-based Lagging Span in Ichimoku.
------------------------------------------------------------------------------------------
Final Note
The chart comparison illustrates how the Divergence-Weighted Clouds V 1.0 (DW) indicator outperforms traditional Ichimoku in terms of signal responsiveness and predictive accuracy. By combining the mathematical rigor of DW’s calculations with the visual clarity of Ichimoku, traders gain a powerful tool for analyzing market trends and making informed decisions.
Look at the DW chart (left) to see how early signals and cloud adjustments provide actionable insights compared to the slower reactions of the Traditional Ichimoku chart (right).

TrigWave Suite [InvestorUnknown]The TrigWave Suite combines Sine-weighted, Cosine-weighted, and Hyperbolic Tangent moving averages (HTMA) with a Directional Movement System (DMS) and a Relative Strength System (RSS).
Hyperbolic Tangent Moving Average (HTMA)
The HTMA smooths the price by applying a hyperbolic tangent transformation to the difference between the price and a simple moving average. It also adjusts this value by multiplying it by a standard deviation to create a more stable signal.
// Function to calculate Hyperbolic Tangent
tanh(x) =>
e_x = math.exp(x)
e_neg_x = math.exp(-x)
(e_x - e_neg_x) / (e_x + e_neg_x)
// Function to calculate Hyperbolic Tangent Moving Average
htma(src, len, mul) =>
tanh_src = tanh((src - ta.sma(src, len)) * mul) * ta.stdev(src, len) + ta.sma(src, len)
htma = ta.sma(tanh_src, len)
Sine-Weighted Moving Average (SWMA)
The SWMA applies sine-based weights to historical prices. This gives more weight to the central data points, making it responsive yet less prone to noise.
// Function to calculate the Sine-Weighted Moving Average
f_Sine_Weighted_MA(series float src, simple int length) =>
var float sine_weights = array.new_float(0)
array.clear(sine_weights) // Clear the array before recalculating weights
for i = 0 to length - 1
weight = math.sin((math.pi * (i + 1)) / length)
array.push(sine_weights, weight)
// Normalize the weights
sum_weights = array.sum(sine_weights)
for i = 0 to length - 1
norm_weight = array.get(sine_weights, i) / sum_weights
array.set(sine_weights, i, norm_weight)
// Calculate Sine-Weighted Moving Average
swma = 0.0
if bar_index >= length
for i = 0 to length - 1
swma := swma + array.get(sine_weights, i) * src
swma
Cosine-Weighted Moving Average (CWMA)
The CWMA uses cosine-based weights for data points, which produces a more stable trend-following behavior, especially in low-volatility markets.
f_Cosine_Weighted_MA(series float src, simple int length) =>
var float cosine_weights = array.new_float(0)
array.clear(cosine_weights) // Clear the array before recalculating weights
for i = 0 to length - 1
weight = math.cos((math.pi * (i + 1)) / length) + 1 // Shift by adding 1
array.push(cosine_weights, weight)
// Normalize the weights
sum_weights = array.sum(cosine_weights)
for i = 0 to length - 1
norm_weight = array.get(cosine_weights, i) / sum_weights
array.set(cosine_weights, i, norm_weight)
// Calculate Cosine-Weighted Moving Average
cwma = 0.0
if bar_index >= length
for i = 0 to length - 1
cwma := cwma + array.get(cosine_weights, i) * src
cwma
Directional Movement System (DMS)
DMS is used to identify trend direction and strength based on directional movement. It uses ADX to gauge trend strength and combines +DI and -DI for directional bias.
// Function to calculate Directional Movement System
f_DMS(simple int dmi_len, simple int adx_len) =>
up = ta.change(high)
down = -ta.change(low)
plusDM = na(up) ? na : (up > down and up > 0 ? up : 0)
minusDM = na(down) ? na : (down > up and down > 0 ? down : 0)
trur = ta.rma(ta.tr, dmi_len)
plus = fixnan(100 * ta.rma(plusDM, dmi_len) / trur)
minus = fixnan(100 * ta.rma(minusDM, dmi_len) / trur)
sum = plus + minus
adx = 100 * ta.rma(math.abs(plus - minus) / (sum == 0 ? 1 : sum), adx_len)
dms_up = plus > minus and adx > minus
dms_down = plus < minus and adx > plus
dms_neutral = not (dms_up or dms_down)
signal = dms_up ? 1 : dms_down ? -1 : 0
Relative Strength System (RSS)
RSS employs RSI and an adjustable moving average type (SMA, EMA, or HMA) to evaluate whether the market is in a bullish or bearish state.
// Function to calculate Relative Strength System
f_RSS(rsi_src, rsi_len, ma_type, ma_len) =>
rsi = ta.rsi(rsi_src, rsi_len)
ma = switch ma_type
"SMA" => ta.sma(rsi, ma_len)
"EMA" => ta.ema(rsi, ma_len)
"HMA" => ta.hma(rsi, ma_len)
signal = (rsi > ma and rsi > 50) ? 1 : (rsi < ma and rsi < 50) ? -1 : 0
ATR Adjustments
To minimize false signals, the HTMA, SWMA, and CWMA signals are adjusted with an Average True Range (ATR) filter:
// Calculate ATR adjusted components for HTMA, CWMA and SWMA
float atr = ta.atr(atr_len)
float htma_up = htma + (atr * atr_mult)
float htma_dn = htma - (atr * atr_mult)
float swma_up = swma + (atr * atr_mult)
float swma_dn = swma - (atr * atr_mult)
float cwma_up = cwma + (atr * atr_mult)
float cwma_dn = cwma - (atr * atr_mult)
This adjustment allows for better adaptation to varying market volatility, making the signal more reliable.
Signals and Trend Calculation
The indicator generates a Trend Signal by aggregating the output from each component. Each component provides a directional signal that is combined to form a unified trend reading. The trend value is then converted into a long (1), short (-1), or neutral (0) state.
Backtesting Mode and Performance Metrics
The Backtesting Mode includes a performance metrics table that compares the Buy and Hold strategy with the TrigWave Suite strategy. Key statistics like Sharpe Ratio, Sortino Ratio, and Omega Ratio are displayed to help users assess performance. Note that due to labels and plotchar use, automatic scaling may not function ideally in backtest mode.
Alerts and Visualization
Trend Direction Alerts: Set up alerts for long and short signals
Color Bars and Gradient Option: Bars are colored based on the trend direction, with an optional gradient for smoother visual feedback.
Important Notes
Customization: Default settings are experimental and not intended for trading/investing purposes. Users are encouraged to adjust and calibrate the settings to optimize results according to their trading style.
Backtest Results Disclaimer: Please note that backtest results are not indicative of future performance, and no strategy guarantees success.

ToxicJ3ster - Day Trading SignalsThis Pine Script™ indicator, "ToxicJ3ster - Signals for Day Trading," is designed to assist traders in identifying key trading signals for day trading. It employs a combination of Moving Averages, RSI, Volume, ATR, ADX, Bollinger Bands, and VWAP to generate buy and sell signals. The script also incorporates multiple timeframe analysis to enhance signal accuracy. It is optimized for use on the 5-minute chart.
Purpose:
This script uniquely combines various technical indicators to create a comprehensive and reliable day trading strategy. Each indicator serves a specific purpose, and their integration is designed to provide multiple layers of confirmation for trading signals, reducing false signals and increasing trading accuracy.
1. Moving Averages: These are used to identify the overall trend direction. By calculating short and long period Moving Averages, the script can detect bullish and bearish crossovers, which are key signals for entering and exiting trades.
2. RSI Filtering: The Relative Strength Index (RSI) helps filter signals by ensuring trades are only taken in favorable market conditions. It detects overbought and oversold levels and trends within the RSI to confirm market momentum.
3. Volume and ATR Conditions: Volume and ATR multipliers are used to identify significant market activity. The script checks for volume spikes and volatility to confirm the strength of trends and avoid false signals.
4. ADX Filtering: The ADX is used to confirm the strength of a trend. By filtering out weak trends, the script focuses on strong and reliable signals, enhancing the accuracy of trade entries and exits.
5. Bollinger Bands: Bollinger Bands provide additional context for the trend and help identify potential reversal points. The script uses Bollinger Bands to avoid false signals and ensure trades are taken in trending markets.
6. Higher Timeframe Analysis: This feature ensures that signals align with broader market trends by using higher timeframe Moving Averages for trend confirmation. It adds a layer of robustness to the signals generated on the 5-minute chart.
7. VWAP Integration: VWAP is used for intraday trading signals. By calculating the VWAP and generating buy and sell signals based on its crossover with the price, the script provides additional confirmation for trade entries.
8. MACD Analysis: The MACD line, signal line, and histogram are calculated to generate additional buy/sell signals. The MACD is used to detect changes in the strength, direction, momentum, and duration of a trend.
9. Alert System: Custom alerts are integrated to notify traders of potential trading opportunities based on the signals generated by the script.
How It Works:
- Trend Detection: The script calculates short and long period Moving Averages and identifies bullish and bearish crossovers to determine the trend direction.
- Signal Filtering: RSI, Volume, ATR, and ADX are used to filter and confirm signals, ensuring trades are taken in strong and favorable market conditions.
- Multiple Timeframe Analysis: The script uses higher timeframe Moving Averages to confirm trends, aligning signals with broader market movements.
- Additional Confirmations: VWAP, MACD, and Bollinger Bands provide multiple layers of confirmation for buy and sell signals, enhancing the reliability of the trading strategy.
Usage:
- Customize the input parameters to suit your trading strategy and preferences.
- Monitor the generated signals and alerts to make informed trading decisions.
- This script is made to work best on the 5-minute chart.
Disclaimer:
This indicator is not perfect and can generate false signals. It is up to the trader to determine how they would like to proceed with their trades. Always conduct thorough research and consider seeking advice from a financial professional before making trading decisions. Use this script at your own risk.

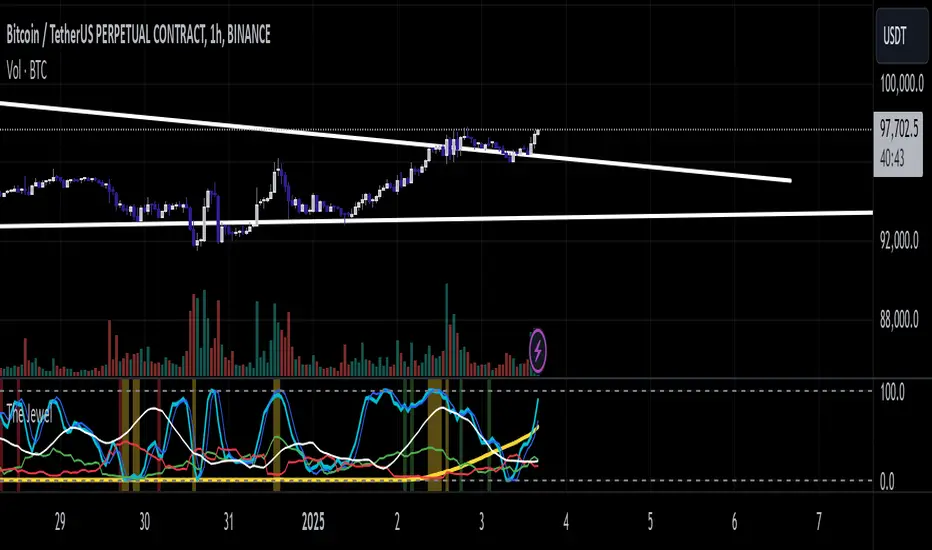
PUMP IndicatorsPUMP Indicator Description
★ Supported Markets and Assets
The PUMP indicator is a versatile tool that can be effectively applied to various markets and assets, including:
▶ Korean Stocks: KOSPI, KOSDAQ, etc.
▶ U.S. Stocks: NYSE, NASDAQ, etc.
▶ Cryptocurrencies: Major cryptocurrencies such as Bitcoin (BTC), Ethereum (ETH), etc.
▶ Futures: Major futures contracts like gold, silver, crude oil, etc.
▶ ETFs: SPY, QQQ, etc.
★ Indicator Description
The PUMP indicator is designed to analyze price divergence and volatility.
It is provided with minimal representation on the chart, allowing users to use it in conjunction with other indicators, such as classical RSI, TRIX, CCI, ADX, BWI, Bollinger Bands, etc.
Everything displayed on the chart can be turned on or off in the options, allowing users to customize their setup.
The PUMP indicator is based on the concept of the MACD indicator, which calculates the difference between the leading line and the lagging line to generate signals.
GOOD, UP, and CR signals predict price increases.
DOWN and BAD signals predict price decreases.
WARN emphasizes that the buy position is not certain, regardless of price increases or decreases.
Therefore, the PUMP indicator is good to use with other indicators. It visually displays divergence and volatility signals along with the MACD movements below, and users can receive alerts for movements in their interested stocks using the alarm function.
It can be used as an indicator for viewing buy and sell signals, as well as predicting the price flow.
▶ (Drawback) Unlike typical TRIX, RSI, TRIX, CCI, ADX, BWI indicators, which are implemented in a new lower window, the PUMP indicator displays both signals and the leading and lagging lines simultaneously, so it is not implemented in a new window, meaning the baseline may vary depending on the daily chart appearance.
★ The PUMP indicator consists of the following components:
▶ PUMP Indicator Leading and Lagging Lines
PUMP t: Leading line (yellow)
PUMP p: Lagging line (blue)
The MACD displayed at the bottom of the chart calculates the divergence between the PUMP t leading line and the PUMP p lagging line.
▶ EA Formula
The core calculation of the PUMP indicator is as follows:
EA (Exponential Average): 100 * (eavg1 / eavg2)
Where eavg1 is the short-term EMA, and eavg2 is the long-term EMA.
It calculates the divergence of the index.
▶ The PUMP indicator is a fixed indicator (cannot be arbitrarily modified).
▶ Highlights: The method of calculating the interval or number of uses is an important part of the index calculation and is therefore private.
★ Signal Description
The PUMP indicator provides a total of six major signals:
▶ UP Signal: Occurs when the divergence between the MACD PUMP t leading line and PUMP p lagging line narrows, and the divergence of the exponential moving average widens compared to before.
▶ DOWN Signal: Occurs when the MACD PUMP t leading line crosses above the PUMP p lagging line.
▶ GOOD Signal: Represents an UP signal with added volume.
(The GOOD signal is not necessarily better than the UP signal. If a GOOD signal appears in a stock that has sufficiently fallen in price, it helps understand that a rebound has started. Therefore, the GOOD signal is made to find a rebound in stocks that have continuously declined, rather than finding signals in consistently rising prices.)
▶ BAD Signal: Occurs when the PUMP t leading line crosses above the 0 baseline, indicating a potential sell signal.
▶ WARN Signal: A warning signal occurring at high levels, indicating that buying is not recommended (regardless of buy or sell).
▶ CR Signal: Occurs in all sections where the PUMP t leading line crosses below the PUMP p lagging line.
★ Lower MACD Horizontal Baseline
The PUMP indicator provides three horizontal baselines from the MACD indicator for additional analysis:
▶ Pump H
▶ PUMP M
▶ PUMP L
It visually provides the divergence of the lower MACD indicator for rising and falling changes, with the default set to 0, and users can change the numbers in the options as needed.
★ Moving Averages
The PUMP indicator provides three basic moving averages:
▶ Buzz 7: 7-day moving average
▶ Buzz 26: 26-day moving average
▶ Buzz 120: 120-day moving average
The number of moving averages is fixed, but users can use them in conjunction with the moving averages provided by TradingView as needed.
★ Alert Function
Using the Alert function of TradingView, you can set alerts for various signals generated by the PUMP indicator.
▶ GOOD Signal Alert
▶ UP Signal Alert
▶ CR Signal Alert
▶ DOWN Signal Alert
▶ BAD Signal Alert
▶ WARN Signal Alert
★ Usage
1. The PUMP indicator is not focused on buy and sell signals but calculates the current price movement and divergence and is designed to express it through MACD leading and lagging lines and signals.
2. The PUMP indicator can be used alone or in conjunction with other indicators for technical analysis.
3. You can analyze buy and sell using the signals of the PUMP indicator along with fundamental analysis, such as news, issues, national policies, company profits, and sales increases.
4. The MACD leading and lagging lines at the bottom of the chart move inversely to the price, ensuring that the PUMP indicator does not interfere when used with other indicators.
5. You can receive real-time alerts using the alarm function.
Below, we attach pictures to help users understand.
============================================
PUMP 인디케이터 설명(한글)
★ 지원되는 시장 및 자산
PUMP 표시기는 다음과 같은 다양한 시장 및 자산에 효과적으로 적용할 수 있는 다용도 도구입니다:
▶ 한국주식: KOSPI, KOSDAQ 등.
▶ 미국주식: NYSE, NASDAQ 등.
▶ 암호화폐: 비트코인(BTC), 이더리움(ETH) 등 주요 암호화폐.
▶ 선물 : 금, 은, 원유 등 주요 선물 계약.
▶ 상장지수펀드(ETF) : SPY, QQQ 등.
★ 지표 설명
PUMP 지표는 가격 이격과 변동성을 분석하도록 설계되었습니다.
사용자가 만든 지표 또는 고전 RSI, TRIX, CCI, ADX, BWI, Bollinger Bands 등과 함께 사용할 수 있게 차트에 최소한의 표현으로 제공됩니다.
그리고 차트에 표현되는 모든 것들을 옵션에서 on / off 가능하게 하였기에 사용자가 커스텀 할 수 있게 하였습니다.
PUMP 지표 신호를 생성하기 위해 선행 라인과 후행 라인 간의 차이를 계산하는 MACD 지표의 개념을 기반으로 합니다.
GOOD, UP, CR 신호는 가격 상승을 예측합니다.
DOWN, BAD 신호는 가격 하락을 예측합니다.
WARN은 가격 상승과 하락에 관계없이, 매수 자리는 확실히 아님을 강조한 신호입니다.
그러므로 PUMP 지표는 다른 지표와 함께 사용하기 좋고, 이격과 변동성을 신호와 하단 MACD 움직임을 눈으로 볼 수 있으며, 알람 기능을 활용하여 관심 있는 종목의 움직임을 알람으로 받아 볼 수 있는 지표입니다.
매수와 매도를 보는 지표로 사용할 수 있으며, 가격의 흐름을 예상하는 지표로 사용할 수 있습니다.
▶ (단점) 보통의 TRIX, RSI, TRIX, CCI, ADX, BWI 지표들은 하단의 새로운 창에서 구현됩니다. 하지만 PUMP 지표는 신호와 하단 선행과 후행을 동시에 표현하기 때문에 새로운 창에서 구현되지 않기에 기준 축이 일봉의 모습에 따라 달라질 수 있습니다.
★ PUMP 지표는 다음과 같은 구성요소로 구성됩니다
▶ PUMP 지표 선행과 후행
PUMP t : 선행라인 (노란색)
PUMP p : 후행라인 (파란색)
차트 하단에 나타나는 MACD는 PUMP t선행라인과 PUMP p 후행라인의 이격도를 계산합니다.
▶ EA공식
PUMP 지표의 핵심 계산식은 다음과 같습니다:
EA(지수평균): 100 * (eavg1 / eavg2)
여기서 eavg1은 단기 EMA이고 eavg2는 장기 EMA입니다.
지수의 이격도를 계산합니다.
▶ PUMP 지표는 고정 지표입니다. (임의 수정 불가)
▶ 강조 : 이격의 계산법이나 사용하는 숫자는 지표 계산의 중요한 부분이므로 비공개입니다.
★ 신호 설명
PUMP 표시등은 총 6개의 주요 신호를 제공합니다:
▶ UP 신호: MACD PUMP t 선행과 PUMP p 후행의 이격이 줄어들 때, 지수 이동 평균의 이격도가 이전 보다 넓어지면 발생합니다.
▶ DOWN 신호: MACD PUMP t 선행이 PUMP p 후행을 상향 교차할 때 발생합니다.
▶ GOOD 신호: 거래량이 추가된 UP 신호를 나타냅니다.
(GOOD 신호가 UP 신호보다 좋다기 보다, 충분히 가격 하락한 종목에서 GOOD 신호가 나온다면 반등이 시작되는 것을 이해할 수 있게 만든 지표입니다. 그러므로 GOOD 신호는 가격이 꾸준히 상승하는 곳에서 신호를 찾기보다, 지속 하락하다 반등을 찾는 신호로 만들었습니다.)
▶ BAD 신호: PUMP t 선행이 0 기준선 이상으로 교차할 때 발생하며, 이는 잠재적인 판매 신호를 나타냅니다.
▶ 경고 신호: 높은 수준에서 발생하는 경고 신호로, 매수가 권장되지 않음을 나타냅니다(매수, 매도와 무관함).
▶ CR 신호: PUMP t 선행 라인이 PUMP p 후행 라인 아래로 교차하는 모든 구간에서 발생합니다.
★ 하단 MACD 가로 기준선
PUMP 표시기는 추가 분석을 위해 MACD 지표에서 3가지 가로 기준을 제공합니다:
▶ pump H
▶ PUMP M
▶ PUMP L
하단의 MACD 지표의 이격도를 상승 및 하강의 변화를 시각적으로 기준을 만들 수 있게 제공하며, 기본은 0으로 제공하고, 사용자의 필요에 따라 옵션에서 숫자를 변경할 수 있게 하였습니다.
★ 이동 평균
PUMP 표시기는 세 가지 기본 이동 평균을 제공 합니다:
▶ Buzz 7: 7일 이동 평균
▶ Buzz 26: 26일 이동 평균
▶ Buzz 120 : 120일 이동 평균
이동 평균의 수는 고정되어 있지만, 사용자는 필요에 따라 TradingView에서 제공하는 이동 평균과 함께 사용할 수 있습니다.
★ 알림 기능
TradingView의 Alert 기능을 사용하여 PUMP 지표 생성되는 다양한 신호에 대한 Alert를 설정할 수 있습니다.
▶ GOOD 신호 알림
▶ UP 신호 알림
▶ CR 신호 알림
▶ DOWN 신호 알림
▶ BAD 신호 알림
▶ WARN 신호 알림
★ 사용법
1.PUMP 지표는 매수와 매도에 중점을 둔 지표가 아니며 현재 가격의 움직임과 이격도를 계산하며 MACD 선행과 후행 그리고 신호로 표현하기 위해 만들어진 지표입니다.
2. PUMP 지표는 단일로 사용할 수 있고, 또는 다른 지표와 함께 기술적분석으로 사용할 수 있습니다.
3. 뉴스와 이슈, 국가의 정책, 회사의 이익, 매출의 상승 등 기본적분석과 함께 PUMP 지표의 신호를 이용하여 매수와 매도 분석을 할 수 있습니다.
4. 차트 하단의 MACD 선행과 후행은 가격의 움직임을 반대로 움직이며, 가격과 반대로 움직이게 함으로써 다른 지표와 함께 사용하였을 때, PUMP 지표가 방해가 되지 않게 하였습니다.
5. 알람을 사용하여 실시간으로 알람을 받아 보실 수 있습니다.
아래 사진을 첨부하여 사용자 이해를 돕습니다.
============================================
UP신호는 이격을
▶ The UP signal indicates horizontal divergence.
CR신호는 선행이 후행을 아래로 돌파
▶ The CR signal indicates vertical divergence when the leading line crosses below the lagging line.
WARN 신호를 확인
▶ Check the WARN signal.
BAD와 DOWN 신호
▶ BAD and DOWN signals.
PUMP 지표의 기준 3개
3 criteria for PUMP indicators
따로 그림을 그리지 않은 차트
▶ A chart without separate drawings.
============================================
다른 지표와 + 조합
+ Combination with other indicators

Quantiple Direction IndexThis indicator indicates market trends by analyzing the following signals:
1. RSI which is a momentum oscillator
2. Directional Movement Index (DMI) which measures the direction of the movement
3. Price in comparison to EMA 13 and 21 to determine whether the trend is clear or there is an ambiguity
4. ADX that shows the strength of the momentum
Scoring logic
While we have kept the source code open which gives the scoring logic, for ease of the user, I am summarizing the scoring logic
A. We break down RSI and DMI into a 9 point scale (-4 to +4) from extremely bearish to bullish. Then we give equal weight to both and come out with a direction score.
B. We use EMA to determine if their is clarity in the price trend. While the direction is deduced from point A, if there is clarity we know that the confidence on the direction is high. If EMA 13 is higher than EMA 21 and the price is above EMA 13, then we assign it as a score of +1 as we get clear bullish trend. Similarly if EMA 13 is below EMA 21 and the price is below both the EMAs then we assign it a score of -1 as we get clear bearish trend. Anything else is considered as inconclusive and given a score of 0
C. We use ADX to determine the strength of the directional momentum. It is like acceleration. We use ADX score as an strength adjustment factor. If the value is above 25 - we multiply A+B by 1.25. Similarly we multiply it by 0.75 if the strength is weak and no change if the strength is neutral.
Finally this indicator categorizes market direction into five levels:
- Very Bullish
- Bullish
- Neutral
- Bearish
- Very Bearish
Scores range from +6 (very bullish) to -6 (very bearish), with the user setting thresholds for each category. The midpoint between Bullish and Bearish defines the neutral zone.
Again all the exact values are in the code and the user can also customize as per their trading system.
Why does it make sense to combine these different indicators rather than looking at them in isolation?
We give equal weight to RSI and DMI to derive the direction of the price movement. Using two different indicators provide a better confirmation on the direction. However, this alone is not sufficient.
We want clarity of the direction and for that we use the EMA score (please refer to point B above). If we have clarity, the probability of the direction being right goes up.
Once we know the direction, we want to know what is the strength of that direction. This point is very valuable for an option trader. This is where this indicator brings value.
Please note that by looking at these indicators in isolation one can get a sense of direction or a sense of strength of the direction. But, when you combine them, you get whether the direction move is with strength or not. If you are into option trading, you will clearly understand the rational behind it when you look at the trading rules provided in this description. For example if one knows that the direction is bullish (which one can potentially get from RSI or DMI), one can either buy a call or sell a put. But one knows that not only the direction is bullish, but it has the right acceleration (strength of the momentum), then one will assign higher probability of higher profit from buying call than from selling put.
To summarize we have combined indicators to achieve the following
1. Get confirmation from two different indicators on the direction of the price movement (RSI and DMI)
2. Confirm that the direction is clear (Price relative to EMA)
3. Combine with the strength of the direction (ADX)
Direction, clarity of the direction and the strength of the directional movement is a valuable trading indicator in our opinion.
Suggested trading rules
1. Short strangle strategy when the trend is neutral with one's usual option selling quantity. Equal quantity on put and call.
2. Full quantity short put and half quantity short call when the trend is bullish.
3. Full quantity short put and call long when the indicator is very bullish.
4. Vice versa for bearish ( full call short, half put short) and very bearish (full call short, put long)
Suggested to use 5 min timeframe for scalping, 15 min for intraday positions, 1 hour for weekly and monthly positions, and daily/weekly for investments.
The value of this indicator oscillates between +6 to -6. You can tweak the range for V bullish, bullish, bearish, and v bearish. The values in between will default to the neutral zone.
Disclaimers:
1. While the creator has used this in the live market, no claim is being made on its effectiveness or profit making ability. Please use it for trading only after you have tested it and are satisfied.
2. There may be thousands or millions of better trader in this world than the creator of this script. The creator makes no claim of his intelligence or trading ability.
3. The creator has no intention of selling this particular script now or in future. This is purely for community use and there's no intention to make any monetary profit from it.
4. The creator is not requesting or soliciting anyone to like or promote this script. The creator is also not asking anyone to give him any business now or in future even if they like this script and benefit from it.

Enhanced Reversal DetectionScript Description:
The "Enhanced Reversal Detection" indicator is a powerful tool designed to identify potential market reversals across various financial instruments. It incorporates a sophisticated algorithm that analyzes price action along with key technical indicators such as the Relative Strength Index (RSI), Bollinger Bands, and Moving Average (MA).
How to Use:
Adjustable Parameters: The indicator offers a range of adjustable parameters to cater to different trading preferences and market conditions.
RSI Length: Adjusts the length of the RSI calculation to fine-tune sensitivity.
Overbought Level: Sets the threshold for identifying overbought conditions on the RSI scale.
Oversold Level: Sets the threshold for identifying oversold conditions on the RSI scale.
Bollinger Bands Length: Determines the length of the Bollinger Bands calculation.
Bollinger Bands Multiplier: Adjusts the standard deviation multiplier for the Bollinger Bands, influencing band width.
Moving Average Length: Defines the length of the Moving Average calculation to capture trend direction.
Min Bars Between Signals: Sets the minimum number of bars required between consecutive reversal signals.
ADX Length: Adjusts the length of the Average Directional Index (ADX) calculation.
ADX Threshold: Defines the threshold value for ADX, serving as a filter for reversal signals.
Signal Generation: The indicator generates signals for both bullish and bearish reversals based on predefined criteria. A bullish reversal signal is triggered when the closing price exceeds the lower Bollinger Band and RSI falls below the oversold threshold. Conversely, a bearish reversal signal occurs when the closing price falls below the upper Bollinger Band and RSI surpasses the overbought threshold.
Alerts: Traders can opt to receive alerts for bullish and bearish reversal signals, enabling them to stay informed of potential trading opportunities even when away from the platform.
Publication Readiness:
To ensure readiness for publication in the TradingView public library, the script has been meticulously crafted and documented:
The code is extensively commented to provide clear explanations of parameters, calculations, and signal generation logic.
Best coding practices have been followed to enhance readability and maintainability.
Rigorous testing has been conducted to validate the accuracy and reliability of signal generation across various market conditions.
The script adheres to TradingView's guidelines and policies for script publication, ensuring compliance with platform standards and user expectations.
With its comprehensive features and user-friendly design, the "Enhanced Reversal Detection" indicator is poised to become a valuable asset for traders seeking to identify high-probability reversal opportunities in the financial markets.

Squeeze Momentum MTF [LPWN]//ENGLISH
Squeeze momentum of lazy bear, multiple time frames, It gives you information if the cycles with high temporality momentums are in harmony, by default two more momentums are shown, I prefer to use only one extra, in the options you can change the time frame of the momentums, in addition to the momentums you can add the RSI and ADX, if the momentum look small, you can change the value of general scale to make them bigger, the table gives us information on how the momentums and the adx are, in the options you can set the candles to color according to the harmony of the momentums
// SPANISH
Squeeze momentum de lazy bear, multiple time frames, te da informacion si los ciclos con momentums de temporalidad alta estan en armonia,por defecto se muestran dos momentums mas, yo prefiero usar solo uno extra, en las opcoines puedes cambiar la temporalidad de los momentums, ademas de los momentums puedes agregar el RSI y el ADX, si el momentum se ve pequeño, puedes cambiar el valor de general scale para hacerlos mas grandes, la tabla nos da infomracion de como estan los momentums y el adx, en las opciones puedes poner que las velas se pongan del color de acuerdo a la armonia de los momentums
[UPRIGHT] Awesome DMI+Hello Traders,
Today I'm releasing a spin on an 'oldie but goodie'; the Directional Movement Index (DMI).
DMI is a combination of 3 different indicators developed by the famous J. Welles Wilder. DMI has 3 different plots: the ADX, +DI, and -DI. The first is the ADX (Average Directional Index), which Wilder created in 1978 to show the strength of a trend by comparing the current price with the previous price range. The other two are the +DI (positive directional indicator) and the -DI show up as two separate lines, +DI is the difference between the highest price of the current day and the highest price of the day before, and -DI does the same calculation with the current and previous day's lows.
How does it work?
When the ADX line is above 25 (as a general rule, some traders use a different threshold, +/- 5), the trend is strong. When the +DI line is above the -DI line, the asset (stock) is moving in an uptrend, and the opposite means the asset is in a downtrend.
How is this different?
Uses multiple calculations to produce signals for an indicator than normally doesn't have any.
Multiple ADX's, +DI's, and -DI's for better accuracy and clearer direction changes.
Ability to use 2 different background highlight signals and several buy/sell signals.
Fully customizable (as always), ability to turn on or off any signals, change any of the colors to suit your needs.
Added pre-filled Alerts.
The ribbons created by the fill make it easier to see the change in direction of each plot.
The chart should look like:
Cheers,
Mike
(UPRIGHT TRADING)

Jigga - All TogetherHi All,
We know that one single indicator does not help to take decision. We need combination of indicator to make it work.
I have just added below indicator together
1) MACD
2) RSI
3) Moving average cross over
4) ADX
5) William %R
I have decided few condition as below.
Indicator: MACD , Positive : MACD > Signal Line , Negative : MACD < Signal line
Indicator: RSI , Positive: RSI > Upper band , Negative: RSI < Lower band
Indicator: EMA Cross over , Positive: Fast MA > Slow MA , Negative: Fast MA < Slow MA
Indicator: ADX , Positive: ADX increasing , Negative: ADX decreasing
Indicator: William%R , Positive: %R > Upper band , Negative: %R < Lower band
Calculation:
Indicator value = +1 if it satisfy positive condition and -1 if satisfy negative condition. Final output line will be sum of all indicator values.
I have also added higher time frame lines to have more visibility.
NOTE: This study will be used to see trend momentum and can not be used to trade using this. Please consider reversal candle pattern also.
My Trading style :
Step 1) Wait for indicator to go red for few days.
Step 2) Buy when line turns to green or touches 0 line.
Step 3) Keep stop loss at last swing low
Step 4) Keep trailing stop loss until you get reversal candle pattern.

MACD With Trend Filter: Visual Backtest Module TemplateSample Strategy: MACD Crossover with trend filter options
MA Filter : Price Close Above MA, Search for Buy, Price Close Below MA, Search for Sell
ADX Filter : Take trade only when ADX is above certain treshold
MACD Signal : MACD Cross above signal line while under 0 line indicate Buy Signal
MACD Cross below signal line while above 0 line indicate Sell Signal
-----------------------------
Using Alert Module:
Enable Alert --> Enable TV's alert and plot signal to chart
Alert Type --> Set to take Buy only, Sell only or Both alert
----------------------------
Using Backtest Module:
Enable Backtest --> Enable Backtest simulation
Backtest Type --> Set to take Buy only, Sell only or Both
SL Type -->
ATR : Set SL in ATR times Multiplier below/above entry price
Fixed : Set SL in fixed point below entry point (in 'Dollar'). e.g. for Stocks -> 0.5 equals to 50cent while for EURUSD currency -> 0.005 equal to 50 pips
HiLo Bar : Set SL at highest/lowest wick of previous bar plus/minus Fixed point. e.g. EURUSD HiLo=3 and Fixed Point = 0.0005, buy trade will place SL 5 Pips below lowest of previous 3 bar
SL ATR Period --> Set Lookback Period used for SL's ATR calculation
SL ATR Multi --> Set ATR Multiplier for SL
SL Fixed --> Set Fixed Level for SL (Use when SL Type is either Fixed or HiLo Bar)
SL Bar --> Set Number of previous bar to check for SL placement
TP RR Ratio --> Set TP based on RR multiplier. e.g. 2 means TP level will be twice further from entry point compared to Entry-SL distance.
Notes: The point is for preliminary testing, so it only supports 1 trade at a time and no Trailing Stop
----------------------------
Disclaimer:
This script main objective is to create my personal indicator template so that i just have to modify the indicator module for preliminary testing in future.
Testing Alert Module so i can re-use it as template in future study/indicator
Testing Visual Backtest Module so i can re-use it as template in future study/indicator
i believe using Strategy function is a better approach for this but the entry/exit level seems to be hit n miss (at least for me, still trying to figure what i did wrong)
also, i rather code the strategy in other platform where i can use the more accurate tick data if i want to validate backtest statistics.
My study scripts was built only to test/visualize an idea to see its viability and if it can be used to optimize existing strategy.
credit: ADX code are originally from "ADX and DI" by @BeikabuOyaji although i re-wrote so i can have cleaner read and use RMA instead of SMA
