Consolidation Zones[RanaAlgo]Overview
This indicator helps traders identify price consolidation zones (ranges) and potential breakouts in the market. It is useful for spotting periods of low volatility before significant price movements.
How It Works
Detects Consolidation Zones
Uses the ADX (Average Directional Index) to determine when the market is in a consolidation phase .
When ADX is below the threshold , the indicator marks the start of a consolidation zone.
Draws a semi-transparent box around the price range, adjusting its height as new highs/lows form.
Tracks Breakouts
When price breaks above/below the consolidation box, it signals a potential trend continuation.
Displays breakout arrows/labels (configurable shape & style) when price exits the range.
Visual Features
Boxes highlight consolidation areas (customizable color, border, and style).
Labels show real-time status ("CONSOLIDATING" or "TRENDING").
Breakout signals appear as arrows or shapes (up/down).
Usefulness in Trading
Range Trading: Helps traders identify sideways markets for buying low and selling high.
Breakout Trading: Signals potential trend entries when price exits consolidation.
Trend Confirmation: Low ADX + consolidation box = weak trend; breakout = possible trend start.
Example: If price stays in a blue box (consolidation) and then breaks above with an arrow, it suggests a bullish move.
חפש סקריפטים עבור "adx"

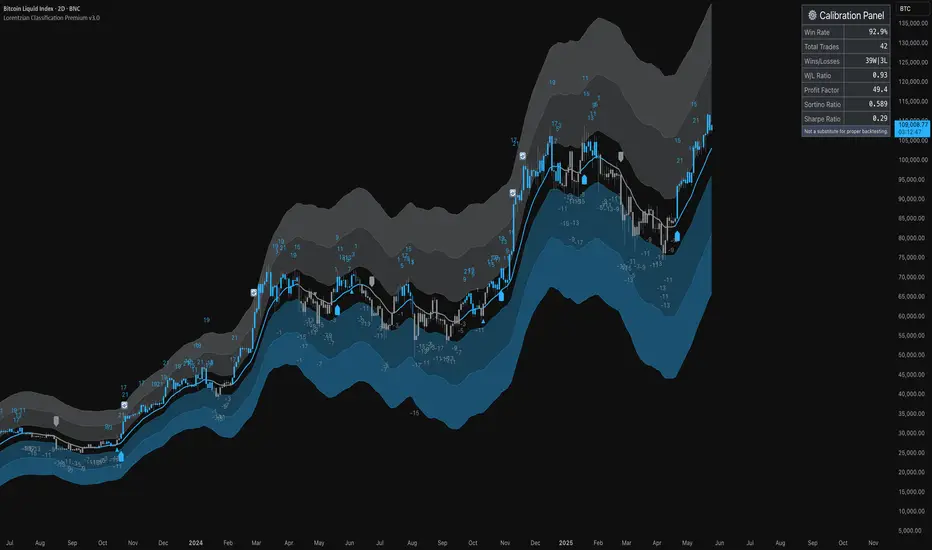
ML: Lorentzian Classification Premium█ OVERVIEW
Lorentzian Classification Premium represents the culmination of two years of collaborative development with over 1,000 beta testers from the TradingView community. Building upon the foundation of the open-source version, this premium edition introduces powerful enhancements that transform how machine-learning classification can be applied to market analysis.
The premium version maintains the core Lorentzian distance-based classification algorithm while expanding its capabilities through triple the feature dimensionality (up to 15 features), sophisticated mean-reversion detection, first-pullback identification, and a comprehensive signal taxonomy that goes far beyond simple buy/sell signals. Whether you're building automated trading systems, conducting deep market research, or integrating proprietary indicators into ML workflows, this tool provides the advanced edge needed for professional-grade analysis.
█ BACKGROUND
Lorentzian Classification analyzes market structures, especially those exhibiting non-linear distortions under stress, by employing advanced distance metrics like the Lorentzian metric, prominent in fields such as relativity theory. Where traditional indicators assume flat space, we embrace the curve. The heart of this approach is the Lorentzian distance metric—a sophisticated mathematical tool. This framework adeptly navigates the complex curves and distortions of market space, aiming to provide insights that traditional analysis might miss, especially during moments of extreme volatility. It analyzes historical data from a multi-dimensional feature space consisting of various technical indicators of your choosing. Where traditional approaches fail, Lorentzian space reveals the true geometry of market dynamics.
Neighborhoods in Different Geometries: In the above figure, the Lorentzian metric creates distinctive cross-patterns aligned with feature axes (RSI, CCI, ADX), capturing both local similarity and dimensional extremes. This unique geometry allows the algorithm to recognize similar market conditions that Euclidean spheres and Manhattan diamonds would miss entirely. In LC Premium, users can have up to 15 features -- you are not limited to 3-dimensions.
Among the thousands of distance metrics discovered by mathematicians, each perceives data through its own geometric lens. The Lorentzian metric stands apart with its unique ability to capture market behavior during volatile events.
█ COMMUNITY-DRIVEN EVOLUTION
It has been profoundly humbling over the past 2 years to witness this indicator's evolution through the collaborative efforts of our incredible community. This journey has been shaped by thousands of user suggestions and validated through real-world application.
A particularly amazing milestone was the development of a complete community-driven Python port, which meticulously matched even the most minute PineScript quirks. Building on this solid foundation, a new command-line interface (CLI) has opened up exciting possibilities for chart-specific parameter optimization:
Early insights from parameter optimization research: Through grid-search testing across thousands of parameter combinations, the analysis identifies which parameters have the biggest effects on performance and maps regions of stability across different market regimes. This reveals that optimal neighbor counts vary significantly based on market conditions—opening up incredible potential for timeframe-specific optimization.
This is just one of the insights gleaned so far from this ongoing investigation. The potential for chart-specific optimization for any given timeframe could transform how traders approach parameter selection.
Demand from power users for extra capabilities—while keeping the open-source version simple—sparked this Premium release. The open-source branch remains maintained, but the premium tier adds unique features for those who need an analytical edge and to leverage their own custom indicators as feature series for the algorithm.
█ KEY PREMIUM FEATURES
📈 First Pullback Detection System
Automatically identifies high-probability trend-continuation entries after initial momentum moves.
Detects when price retraces to optimal entry zones following breakouts or trend initiations.
Green/red triangle signals often fire before main classification arrows.
Dedicated alerts for both bullish and bearish pullback opportunities.
Based on veryfid's extensive research into pullback mechanics and market structure.
🔄 Dynamic Kernel Regression Envelope
Powerful, zero-setup confluence layer that immediately communicates trend shifts.
Dual-kernel system creates a visual envelope between trend estimates.
Color gradient dynamically represents prediction strength and market conviction.
Crossovers provide additional confirmation without cluttering your chart.
Professional visualization that rivals institutional-grade analysis tools.
✨ Massively Expanded Dimensionality: 10 Custom Sources, 5 Built-In Sources
Transform the indicator from 5 built-in standard to 15 total total features—triple the analytical power.
Integrate ANY TradingView indicator as a machine learning feature.
Built-in normalization ensures all indicators contribute equally regardless of scale.
Create theme-based systems: pure volume analysis, multi-timeframe momentum, or hybrid approaches.
📊 Tiered Mean Reversion Signals with Scalping Alerts
Regular (🔄) and Strong (⬇️/⬆️) mean reversion signals based on statistical extremes.
Opportunities often arise before candle close—perfect for scalping entries.
Visual markers appear at high-probability reversal zones.
Four specialized alert types: upward/downward for both regular and strong reversals.
Pre-optimized probability thresholds, no fine-tuning required.
📅 Daily Kernel Trend Filter
Instantly cleans up noisy intraday charts by aligning with higher timeframe trends.
Swing traders report immediate signal quality improvement.
Automatically deactivates on daily+ timeframes (intelligent context awareness).
Reduces counter-trend signals by up to 60% on lower timeframes.
Simple toggle—no complex multi-timeframe setup required.
📋 Professional Backtesting Stream (-6 to +6)
Multiple distinct signal types (including pullbacks, mean reversions, and kernel deviations) vs. basic binary (buy/sell) output for nuanced analysis.
Enables detailed walk-forward analysis and ML model training.
Compatible with external backtesting frameworks via numeric stream.
Rare precision for TradingView indicators—usually only found in institutional tools.
Perfect for quants building sophisticated strategy layers.
⚡ Performance Optimizations
Faster distance calculations through algorithmic improvements.
Reduced indicator load time (measured via Pine Profiler).
Handles 15 active features without timeouts—critical for multi-chart setups.
Optimized for live auto-trading bots requiring minimal latency.
🎨 Full Visual Customization & Accessibility
Complete color control for all visual elements.
Colorblind-safe default palette with customization options.
Dark mode optimization for extended trading sessions.
Professional appearance matching your trading workspace.
Accessibility features meeting modern UI standards.
🛠️ Advanced Training Modes
Downsampling mode for training on diverse market conditions; Down-sampling and remote-fractals for exotic pattern discovery.
Remote fractals option extends analysis to deep historical patterns.
Reset factor control for fine-tuning neighbor diversity; Reset-factor tuning to control neighbor diversity.
Appeals to systematic traders exploring exotic data approaches.
Prevents temporal clustering bias in model training.
█ HOW TO USE
Understanding the Approach (Core Concept):
Lorentzian Classification uses a k-Nearest Neighbors (k-NN) algorithm. It searches for historical price action "neighborhoods" similar to the current market state. Instead of a simple straight-line (Euclidean) distance, it primarily uses a Lorentzian distance metric, which can account for market "warping" or distortions often seen during high volatility or significant events. Each historical neighbor "votes" on what happened next in its context, and these votes aggregate into a classification score for the current bar.
Interpreting Bar Scores & Signals (Interpreting the Chart):
Bar Prediction Values: Numbers over each candle (e.g., ranging from -8 to +8 if Neighbors Count is 8) represent the aggregated vote from the nearest neighbors. Strong positive scores (e.g., +7, +8) indicate a strong bullish consensus among historical analogs. Strong negative scores (e.g., -7, -8) indicate a strong bearish consensus. Scores near zero suggest neutrality or conflicting signals from neighbors. The intensity of bar colors (if Use Confidence Gradient is on) often reflects these scores.
Main Arrows (Main Buy/Sell Labels): Large ▲/▼ labels are the primary entry signals generated when the overall classification (after filters) is bullish or bearish.
Pullback Triangles: Small green/red ▲/▼ identify potential trend continuation entries. These signals often appear after an initial price move and a subsequent minor retracement, suggesting the trend might resume. This is based on recognizing patterns where a brief counter-movement is followed by a continued advance in the initial trend direction.
Mean-Reversion Symbols: 🔄 (Regular Reversion) appears when price has crossed the average band of the Dynamic Kernel Regression Envelope. ⬇️/⬆️ (Strong Reversion) means price has crossed the far band of the envelope, indicating a more extreme deviation and potentially a stronger reversion opportunity.
Custom Mean Reversion Deviation Markers (Deviation Dots): If Enable Custom Mean Reversion Alerts is on, these dots appear when price deviates from the main kernel regression line by a user-defined ATR multiple, signaling a custom-defined reversion opportunity.
Kernel Regression Lines & Envelope: The Main Kernel Estimate (thicker line) is an adaptive moving average that smooths price and helps identify trend direction. Its color indicates the current trend bias. The Envelope (outer bands and a midline) creates a channel around price, and its interaction with price generates mean reversion signals.
Key Input Groups & Their Purpose:
🔧 GENERAL SETTINGS:
Reduce Price-Time Warping : Toggles the distance metric. When enabled, it reduces the characteristic "warping" effect of the default Lorentzian metric, making the distance calculation more Euclidean in nature. This may be suited for periods exhibiting less pronounced price-time distortions.
Source : Price data for calculations (default: close ).
Neighbors Count : The 'k' in k-NN – number of historical analogs considered.
Max Bars Back : How far back the indicator looks for historical patterns.
Show Exits / Use Dynamic Exits : Controls visibility and logic for exit signals.
Include Full History (Use Remote Fractals) : Allows model to pick "exotic" fractals from deep chart history.
Use Downsampling / Reset Factor : Advanced training parameters affecting neighbor selection.
Show Trade Stats / Use Worst Case Estimates : Displays a real-time performance table (for calibration only).
🎛️ DEFINE CUSTOM SOURCES (OPTIONAL):
Integrate up to 10 external data series (e.g., from other indicators) as features. Each can be optionally normalized. Load the external indicator on your chart first for it to appear in the dropdown.
🧠 FEATURE ENGINEERING:
Configure up to 15 features for the k-NN algorithm. Select type (RSI, WT, CCI, ADX, Custom Sources), parameters, and enable/disable. Start simple (3-5 features) and add complexity gradually. Normalize features with vastly different scales.
🖥️ DISPLAY SETTINGS:
Controls visibility of chart elements: bar colors, prediction values/labels, envelope, etc.
Align Signal with Current Bar : If true, pullback signals appear on the current bar (calculated on closed data). If false (default), they appear on the next bar.
Use ATR Offset : Positions bar prediction values using ATR for visibility.
🧮 FILTERS SETTINGS:
Refine raw classification signals: Volatility, Regime, ADX, EMA/SMA, and Daily Kernel filters.
🌀 KERNEL SETTINGS (Main Kernel):
Adjust parameters for the primary Nadaraya-Watson Kernel Regression line. Lookback Window , Relative Weighting , Regression Level , Lag control sensitivity and smoothness.
✉️ ENVELOPE SETTINGS (for Mean Reversion):
Configure the dynamic Kernel Regression Envelope. ATR Length , Near/Far ATR Factor define band width.
🎨 COLOR SETTINGS (Colors):
Customize colors for all visual elements; override every palette element.
General Approach to Using the Indicator (Suggested Workflow):
Load defaults and observe behavior: Familiarize yourself with the indicator's behavior.
Feature Engineering: Experiment with features, considering momentum, trend, and volatility. Add/replace features gradually.
Apply Filters: Refine signals according to your trading style.
Contextualize: Use kernels and envelope to understand broader trend and potential overbought/oversold areas.
Observe Signals: Pay attention to the interplay of main signals, pullbacks, and mean reversions. Watch interplay of main, pullback & mean-reversion signals.
Calibrate (Not Backtest): Use the "Trade Stats" table for real-time feedback on current settings. This is for calibration, *not a substitute for rigorous backtesting.*
Iterate & refine: Adjust settings, observe outcomes, and refine your approach.
█ ACKNOWLEDGMENTS
This premium version wouldn't exist without the invaluable contributions of:
veryfid for his groundbreaking ideas on unifying pullback detection with Lorentzian Classification, but most of all for always believing in and encouraging me and so many others. For being a mentor and, most importantly, a friend. We all miss you.
RikkiTavi for his help in creating the settings optimization framework and for other invaluable theoretical discussions.
The 1,000+ beta testers worldwide who provided continuous feedback over two years.
The Python porting team who created the foundation for advanced optimization; for the cross-language clone.
The broader TradingView community for making this one of the platform's most popular indicators.
█ FUTURE DEVELOPMENT
The Premium version will continue to evolve based on community feedback. Planned enhancements include:
Specialized exit model trained independently from entry signals (ML-based exit model).
Feature hub with pre-normalized, commonly requested indicators (Pre-normalized feature hub).
Better risk-management options (Enhanced risk-management options).
Fully automated settings optimization (Auto-settings optimization tool).
סקריפט בתשלום
MA Pullback Signal V1.1 [Tujac]This indicator will help you to find a MA Pullback Signal.
Features
Entry signals are generated under the following conditions:
Condition 1: When the 10, 20, and 50-period Moving Averages (MAs) are in either a bullish or bearish alignment , and their intervals narrow before expanding , a signal will appear.
Additionally , the Stochastic oscillator must be in an oversold/overbought zone , and the signal will only trigger if volume increases upon the 10-period MA breaking through the 20-period MA after a bounce.
Condition 2: When the 20, 50, and 100-period MAs are in either a bullish or bearish alignment , and their intervals narrow before expanding , a signal will appear.
Additionally , the Stochastic oscillator must be in an oversold/overbought zone , and the signal will only trigger if volume increases upon the 20-period MA breaking through the 50-period MA after a bounce.
Condition 3: If the 50-period MA and 200-period MA are in a bullish alignment , but the 10, 20, and 50-period MAs are in a bearish alignment , a signal will appear on a candle where a double bottom/double top forms, followed by an increase in volume .
Convergence Zone
Entry signals are hidden when the market is in a convergence zone .
Bollinger Bands, Keltner Channels, ADX, and Volume are used to determine if the market is in a convergence zone.
By default, entry signals will not appear in a convergence zone.
You can change the settings to allow signals to appear on candles that meet the entry conditions, even within a convergence zone.
Setting Options
Trend Type: Sets the type of Moving Average to determine pull-back entries.
MA F: Uses all four MAs (10/20/50/200) to determine pull-backs.
MA A/B/C: Uses only the 10/20/50 MAs to determine pull-backs.
MA F Trend: Sets which MA crossing the 200-period MA defines the base trend. The default is the 5-period MA.
MA Style: Sets the display style of the Moving Averages.
A: Displays the 200-period MA as a line and the 10/20-period MAs as a cloud.
B: Displays all 10/20/50/200-period MAs as lines.
C: Displays the 10/20-period MAs and the 90/100-period MAs as a cloud.
ADX Default: Sets the ADX value used to define the convergence zone.
Filter Squeeze: Enable this setting to hide entry signals during convergence zones.
Filter Over Sold/Bought: Enable this setting to hide entry signals when the market is in oversold/overbought zones.
Show Strong Signal: Displays signals with particularly high volume and price volatility.
Strength Level: Displays the strength of the signal.
Show All Signal: Displays both weak and strong signals.
Displays the 200-period MA as a line and the 10/20-period MAs as a cloud.
When the 10, 20, and 50-period Moving Averages (MAs) are in either a bullish or bearish alignment, and their intervals narrow before expanding, a signal will appear. Additionally, the Stochastic oscillator must be in an oversold/overbought zone, and the signal will only trigger if volume increases upon the 10-period MA breaking through the 20-period MA after a bounce.
Entry signals are hidden when the market is in a convergence zone.
The "Show All Signal" option allows you to display both weak and strong signals, providing a comprehensive view of all potential entry points identified by the system, regardless of their strength level.
If the 50-period MA and 200-period MA are in a bullish alignment, but the 10, 20, and 50-period MAs are in a bearish alignment, a signal will appear on a candle where a double bottom/double top forms, followed by an increase in volume.

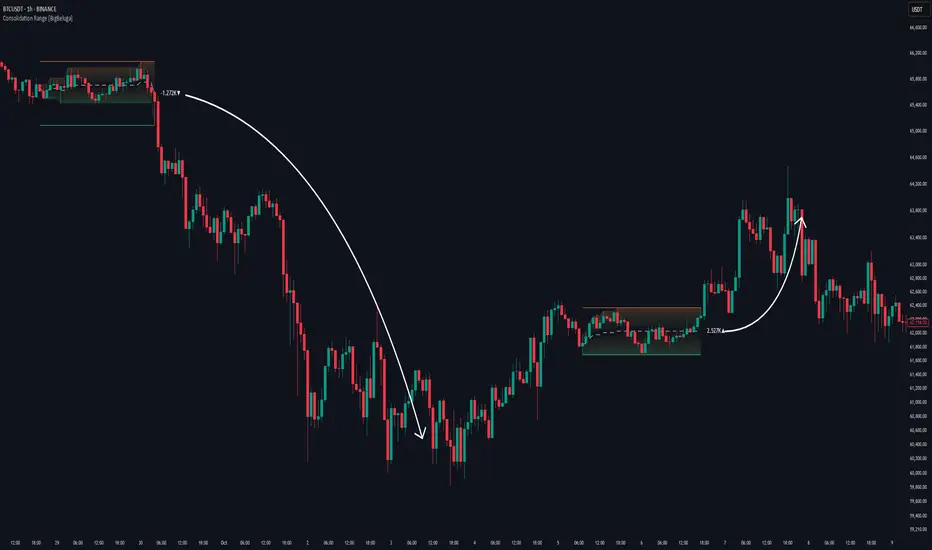
Consolidation Range [BigBeluga]A hybrid volatility-volume indicator that isolates periods of price equilibrium and reveals the directional force behind each range buildup.
Consolidation Range is a powerful tool designed to detect compression phases in the market using volatility thresholds while visualizing volume imbalance within those phases. By combining low-volatility detection with directional volume delta, it highlights where accumulation or distribution is occurring—giving traders the confidence to act when breakouts follow. This indicator is particularly valuable in choppy or sideways markets where range identification and sentiment context are key.
🔵 CONCEPTS
Volatility Compression: Uses ADX (Average Directional Index) to detect periods of low trend strength—specifically when ADX drops below a configurable threshold.
Range Structure: Upon a low-volatility trigger, the script dynamically anchors horizontal upper and lower bounds based on local highs and lows.
Directional Volume Delta: Inside each active range, it calculates the net difference between buy and sell volume, showing who controlled the range.
Sentiment Bias: A label appears in the center of the zone on breakout, showing the accumulated delta and bias direction (▲ for positive, ▼ for negative).
Range Validity Filter: Only ranges with more than 15 bars are considered valid—short-lived consolidations are auto-filtered.
🔵 KEY FEATURES
Detects low volatility market phases using ADX logic (crosses under "Volatility Threshold Input").
Automatically plots adaptive consolidation zones with upper and lower boundary lines.
Includes dynamic midline to visualize the price average inside the range.
Visual range is filled with a progressive gradient to reflect distance between highs and lows.
When the range is active, the indicator accumulates volume delta (Buy - Sell volume) .
Upon breakout, the total volume delta is displayed at the midpoint , providing insight into market sentiment during the consolidation phase.
Filters out weak or short-lived consolidations under 15 bars.
🔵 HOW TO USE
Spot ranging or compression zones with minimal effort.
Use breakouts with volume delta bias to assess the strength or weakness of moves.
Combine with trend-following tools or volume-based confirmation for stronger setups.
Apply to higher timeframes for macro consolidation tracking .
🔵 CONCLUSION
Consolidation Range now brings together volatility filtering and directional volume delta into one smart module. This hybrid logic allows traders to not only identify balance zones but also understand who was in control during the buildup—offering a sharper edge for breakout and trend continuation strategies.
Canuck Trading IndicatorOverview
The Canuck Trading Indicator is a versatile, overlay-based technical analysis tool designed to assist traders in identifying potential trading opportunities across various timeframes and market conditions. By combining multiple technical indicators—such as RSI, Bollinger Bands, EMAs, VWAP, MACD, Stochastic RSI, ADX, HMA, and candlestick patterns—the indicator provides clear visual signals for bullish and bearish entries, breakouts, long-term trends, and options strategies like cash-secured puts, straddles/strangles, iron condors, and short squeezes. It also incorporates 20-day and 200-day SMAs to detect Golden/Death Crosses and price positioning relative to these moving averages. A dynamic table displays key metrics, and customizable alerts help traders stay informed of market conditions.
Key Features
Multi-Timeframe Adaptability: Automatically adjusts parameters (e.g., ATR multiplier, ADX period, HMA length) based on the chart's timeframe (minute, hourly, daily, weekly, monthly) for optimal performance.
Comprehensive Signal Generation: Identifies short-term entries, breakouts, long-term bullish trends, and options strategies using a combination of momentum, trend, volatility, and candlestick patterns.
Candlestick Pattern Detection: Recognizes bullish/bearish engulfing, hammer, shooting star, doji, and strong candles for precise entry/exit signals.
Moving Average Analysis: Plots 20-day and 200-day SMAs, detects Golden/Death Crosses, and evaluates price position relative to these averages.
Dynamic Table: Displays real-time metrics, including zone status (bullish, bearish, neutral), RSI, MACD, Stochastic RSI, short/long-term trends, candlestick patterns, ADX, ROC, VWAP slope, and MA positioning.
Customizable Alerts: Over 20 alert conditions for entries, exits, overbought/oversold warnings, and MA crosses, with actionable messages including ticker, price, and suggested strategies.
Visual Clarity: Uses distinct shapes, colors, and sizes to plot signals (e.g., green triangles for bullish entries, red triangles for bearish entries) and overlays key levels like EMA, VWAP, Bollinger Bands, support/resistance, and HMA.
Options Strategy Signals: Suggests opportunities for selling cash-secured puts, straddles/strangles, iron condors, and capitalizing on short squeezes.
How to Use
Add to Chart: Apply the indicator to any TradingView chart by selecting "Canuck Trading Indicator" from the Pine Script library.
Interpret Signals:
Bullish Signals: Green triangles (short-term entry), lime diamonds (breakout), blue circles (long-term entry).
Bearish Signals: Red triangles (short-term entry), maroon diamonds (breakout).
Options Strategies: Purple squares (cash-secured puts), yellow circles (straddles/strangles), orange crosses (iron condors), white arrows (short squeezes).
Exits: X-cross shapes in corresponding colors indicate exit signals.
Monitor: Gray circles suggest holding cash or monitoring for setups.
Review Table: Check the top-right table for real-time metrics, including zone status, RSI, MACD, trends, and MA positioning.
Set Alerts: Configure alerts for specific signals (e.g., "Short-Term Bullish Entry" or "Golden Cross") to receive notifications via TradingView.
Adjust Inputs: Customize input parameters (e.g., RSI period, EMA length, ATR period) to suit your trading style or market conditions.
Input Parameters
The indicator offers a wide range of customizable inputs to fine-tune its behavior:
RSI Period (default: 14): Length for RSI calculation.
RSI Bullish Low/High (default: 35/70): RSI thresholds for bullish signals.
RSI Bearish High (default: 65): RSI threshold for bearish signals.
EMA Period (default: 15): Main EMA length (15 for day trading, 50 for swing).
Short/Long EMA Length (default: 3/20): For momentum oscillator.
T3 Smoothing Length (default: 5): Smooths momentum signals.
Long-Term EMA/RSI Length (default: 20/15): For long-term trend analysis.
Support/Resistance Lookback (default: 5): Periods for support/resistance levels.
MACD Fast/Slow/Signal (default: 12/26/9): MACD parameters.
Bollinger Bands Period/StdDev (default: 15/2): BB settings.
Stochastic RSI Period/Smoothing (default: 14/3/3): Stochastic RSI settings.
Uptrend/Short-Term/Long-Term Lookback (default: 2/2/5): Candles for trend detection.
ATR Period (default: 14): For volatility and price targets.
VWAP Sensitivity (default: 0.1%): Threshold for VWAP-based signals.
Volume Oscillator Period (default: 14): For volume surge detection.
Pattern Detection Threshold (default: 0.3%): Sensitivity for candlestick patterns.
ROC Period (default: 3): Rate of change for momentum.
VWAP Slope Period (default: 5): For VWAP trend analysis.
TradingView Publishing Compliance
Originality: The Canuck Trading Indicator is an original script, combining multiple technical indicators and custom logic to provide unique trading signals. It does not replicate existing public scripts.
No Guaranteed Profits: This indicator is a tool for technical analysis and does not guarantee profits. Trading involves risks, and users should conduct their own research and risk management.
Clear Instructions: The description and usage guide are detailed and accessible, ensuring users understand how to apply the indicator effectively.
No External Dependencies: The script uses only built-in Pine Script functions (e.g., ta.rsi, ta.ema, ta.vwap) and requires no external libraries or data sources.
Performance: The script is optimized for performance, using efficient calculations and adaptive parameters to minimize lag on various timeframes.
Visual Clarity: Signals are plotted with distinct shapes and colors, and the table provides a concise summary of market conditions, enhancing usability.
Limitations and Risks
Market Conditions: The indicator may generate false signals in choppy or low-liquidity markets. Always confirm signals with additional analysis.
Timeframe Sensitivity: Performance varies by timeframe; test settings on your preferred chart (e.g., 5-minute for day trading, daily for swing trading).
Risk Management: Use stop-losses and position sizing to manage risk, as suggested in alert messages (e.g., "Stop -20%").
Options Trading: Options strategies (e.g., straddles, iron condors) carry unique risks; consult a financial advisor before trading.
Feedback and Support
For questions, suggestions, or bug reports, please leave a comment on the TradingView script page or contact the author via TradingView. Your feedback helps improve the indicator for the community.
Disclaimer
The Canuck Trading Indicator is provided for educational and informational purposes only. It is not financial advice. Trading involves significant risks, and past performance is not indicative of future results. Always perform your own due diligence and consult a qualified financial advisor before making trading decisions.

Elliott Wave Noise FilterElliott Wave Noise Filter
Overview
The Elliott Wave Noise Filter is a specialized indicator for TradingView, designed to solve one of the biggest challenges in Elliott Wave analysis on lower timeframes: the identification of market noise. By combining multiple advanced filtering techniques, this indicator helps distinguish meaningful price action from random fluctuations.
The Problem
On lower timeframes—especially below 15 minutes—Elliott Wave analysis is significantly impacted by excessive market noise. This noise can lead to misinterpretation of wave structures, making it difficult to execute reliable trading decisions.
The Solution
The Elliott Wave Noise Filter utilizes four powerful methods to detect and filter noise:
ATR-Based Volatility Analysis: Identifies price movements too small to be structurally meaningful
Volume Confirmation: Filters out price moves that occur with insufficient volume
Trend Strength Measurement (ADX): Detects periods of weak trend activity, where noise tends to dominate
Fractal Pattern Recognition: Marks significant turning points that could be relevant for Elliott Wave analysis
Features
Visual Indicators
Background Coloring: Red indicates noise; green signifies a clear signal
Hull Moving Average: Smooths price action and highlights the prevailing trend
Fractal Markers: Triangles mark significant highs and lows
Status Panel: Displays current noise status and ADX value
Customization Options
ATR Period: Adjust the lookback period for ATR calculations
Noise Threshold: Defines the percentage of ATR below which a movement is considered noise
Volume Filter: Can be enabled or disabled
Volume Threshold: Sets the ratio to average volume for a move to be deemed significant
Hull MA Display and Length: Configure the moving average settings
ADX Parameters: Adjust trend strength sensitivity
Use Cases
For Elliott Wave Analysis
Eliminate noise to identify cleaner wave structures
Use fractal markers as potential wave endpoints
Reference the Hull MA for determining the broader trend
For General Trading
Identify high-noise periods to avoid low-quality setups
Spot clearer market phases for better entries
Assess price action quality through visual cues
Multi-Timeframe Approach
Apply the indicator across different timeframes for a comprehensive view
Prefer trading when both higher and lower timeframes align with consistent signals
Optimal Settings
For Very Short Timeframes (1–5 minutes)
Higher Noise Threshold (0.4–0.5)
Longer ATR Period (20–30)
Higher Volume Threshold (1.0–1.2)
For Medium Timeframes (15–60 minutes)
Medium Noise Threshold (0.2–0.3)
Standard ATR Period (14)
Standard Volume Threshold (0.8)
For Higher Timeframes (4h and above)
Lower Noise Threshold (0.1–0.2)
Shorter ATR Period (10)
Lower Volume Threshold (0.6–0.7)
Conclusion
The Elliott Wave Noise Filter is an essential tool for any Elliott Wave analyst or trader working on lower timeframes. By reducing noise and emphasizing significant market movements, it enables more precise analysis and potentially more profitable trading decisions.
Note: As with any technical indicator, the Elliott Wave Noise Filter should be used as part of a broader trading strategy and not as a standalone signal for trade execution.

Gradient Range [BigBeluga]
This indicator highlights range-bound market conditions by dynamically plotting gradient-colored candlesticks within a defined price box. It detects whether the market is ranging or trending using ADX and can identify mean reversion points when price steps outside the established range.
🔵KEY FEATURES:
Range Detection Box:
➣ A transparent box is drawn based on the highest and lowest price close over a user-defined period.
➣ Helps visualize range boundaries and the midline for support/resistance reference.
Gradient Candlestick Coloring:
➣ Candles inside the range are colored with a gradient from top to bottom based on proximity to the midline.
➣ Top range candles are shaded with bearish tones, while bottom range candles use bullish tones.
Ranging/Trending State Detection:
➣ Uses ADX to determine if the market is currently in a ranging or trending state.
➣ A label in the bottom right corner shows a real-time status (🟢 Ranging / 🟡 Trending).
Mean Reversion Signal Circles:
➣ When the market is ranging, white circles are plotted at highs/lows that breach the box boundary, indicating potential mean reversion points.
➣ These levels can act as fade trade setups or exhaustion markers.
🔵USAGE:
Range Trading: Trade between the upper and lower boundaries during range-bound conditions with clearer visual feedback.
Mean Reversion Plays: Use circle signals as early alerts to identify when price extends beyond the range and may revert to the mean.
Visual Trend Strength: Instantly recognize where price is concentrated inside the range via the color gradient system.
Ranging Filter: Use the ADX label to avoid false setups during strong trending periods.
Gradient Range provides an elegant and data-driven approach to range-bound market analysis. With its gradient visualization and smart reversion detection, it empowers traders to better time entries and exits within consolidation zones.

Signal Indicator + SAR + 30min Trend Background🔹 BTC/USD 3-Minute Trend Signal Indicator + SAR + 30-Minute Background Trend
📌 Overview
This indicator is designed for high-precision BTC/USD trading on the 3-minute timeframe. It integrates multiple trend confirmation tools to improve signal accuracy, reduce false entries, and help traders align with higher timeframe trends.
⚡ Key Features & Enhancements
✅ Multi-Timeframe Trend Confirmation:
Uses 3-minute EMA trend filter + 30-minute EMA confirmation.
Background color changes dynamically based on 30-minute trend.
✅ Smart Parabolic SAR Filter (Optional):
Reduces false signals with an adjustable confirmation delay.
Helps avoid premature exits in strong trends.
✅ Momentum & Trend Strength Analysis:
Uses MACD for directional confirmation.
RSI filtering to avoid overbought/oversold conditions.
ADX filter ensures trades are taken in strong trends.
✅ Breakout Confirmation & Heikin-Ashi Filtering:
Detects breakouts from key resistance & support levels.
Uses Heikin-Ashi candle trend confirmation for smoother signals.
✅ Bollinger Bands Trend Validation:
Filters trades based on price position relative to Bollinger Bands.
Avoids choppy market conditions.
✅ Session Time Filtering:
Limits trades to high-liquidity trading hours (9 AM - 8 PM UTC).
✅ BUY/SELL Alerts & Labels:
Displays BUY/SELL labels on the chart when conditions are met.
TradingView Alerts for automated bot integration.
🛠️ How It Works
1️⃣ Trend Confirmation
Short-term (3-min) trend: Calculated using EMA(20).
Higher timeframe (30-min) trend: Acts as a filter (optional background color).
Valid BUY/SELL signals must align with the higher timeframe trend.
2️⃣ Entry Signals (BUY & SELL Conditions)
🚀 BUY Signal
Price breaks above resistance (last 20 candles).
MACD bullish crossover.
EMA Trend + Higher TF EMA confirms uptrend.
Bollinger Bands validation (trading above mid-band).
SAR confirms uptrend (optional).
Heikin-Ashi trend aligns bullish.
ADX > 20 (ensures strong trend).
Time filter active (9 AM - 8 PM UTC).
🔻 SELL Signal
Price breaks below support (last 20 candles).
MACD bearish crossover.
EMA Trend + Higher TF EMA confirms downtrend.
Bollinger Bands validation (trading below mid-band).
SAR confirms downtrend (optional).
Heikin-Ashi trend aligns bearish.
ADX > 20 (ensures strong trend).
Time filter active (9 AM - 8 PM UTC).
3️⃣ Alerts & Labels
BUY alert triggers 🚀 when all conditions align.
SELL alert triggers 🔻 when all conditions align.
Labels appear on the chart to indicate signals.
⚙️ Customization & Settings
🔧 User-Configurable Options:
Parabolic SAR filter (optional).
SAR confirmation delay (prevents false exits).
Background trend color from 30-min timeframe.
Adjustable background opacity for better visibility.
Trading session filter (to avoid low-volume periods).
📊 Best Use Cases
✅ Scalping BTC/USD on a 3-minute chart.
✅ Trend-following strategy with multiple confirmations.
✅ Reducing false signals with multi-indicator validation.
✅ Automated trading (TradingView alerts integration).
⚠️ Disclaimer
📌 This indicator is for educational purposes only and should not be considered financial advice.
📌 Always backtest and validate the strategy before using it for live trading.
📌 Past performance does not guarantee future results.
💬 How to Use?
1️⃣ Add the indicator to your 3-minute BTC/USD chart.
2️⃣ Enable/disable filters based on your trading style.
3️⃣ Set alerts for automated notifications.
4️⃣ Follow trend confirmations before entering trades.

Pro Scalper AI [BullByte]The Pro Scalper AI is a powerful, multi-faceted scalping indicator designed to assist active traders in identifying short-term trading opportunities with precision. By combining trend analysis, momentum indicators, dynamic weighting, and optional AI forecasting, this tool provides both immediate and latched trading signals based on confirmed (closed bar) data—helping to avoid repainting issues. Its flexible design includes customizable filters such as a higher timeframe trend filter, and adjustable settings for ADX, ATR, and Hull Moving Average (HMA), giving traders the ability to fine-tune the strategy to different markets and timeframes.
Key Features :
- Confirmed Data Processing :
Utilizes a helper function to lock in price and volume data only from confirmed (closed) bars, ensuring the reliability of signals without the risk of intrabar repainting.
- Trend Analysis :
Employs ADX and Directional Movement (DI) calculations along with a locally computed HMA to detect short-term trends. An optional higher timeframe trend filter can further refine the analysis.
- Flexible Momentum Modes :
Choose between three momentum calculation methods—Stochastic RSI, Fisher RSI, or Williams %R—to match your preferred style of analysis. This versatility allows you to optimize the indicator for different market conditions.
- Dynamic Weighting & Volatility Adjustments :
Adjusts the contribution of trend, momentum, volatility, and volume through dynamic weighting. This ensures that the indicator responds appropriately to varying market conditions by scaling its sensitivity with user-defined maximum factors.
- Optional AI Forecast :
For those who want an extra edge, the built-in AI forecasting module uses linear regression to predict future price moves and adjusts oscillator thresholds accordingly. This feature can be toggled on or off, with smoothing options available for more stable output.
- Latching Mode for Signal Persistenc e:
The script features a latching mechanism that holds signals until a clear reversal is detected, preventing whipsaws and providing more reliable trade entries and exits.
- Comprehensive Visualizations & Dashboard :
- Composite Oscillator & Dynamic Thresholds : The oscillator is plotted with dynamic upper and lower thresholds, and the area between them is filled with a color that reflects the active trading signal (e.g., Strong Buy, Early Sell).
- Signal Markers : Both immediate (non-latching) and stored (latched) signals are marked on the chart with distinct shapes (circles, crosses, triangles, and diamonds) to differentiate between signal types.
- Real-Time Dashboard : A customizable dashboard table displays key metrics including ADX, oscillator value, chosen momentum mode, HMA trend, higher timeframe trend, volume factor, AI bias (if enabled), and more, allowing traders to quickly assess market conditions at a glance.
How to Use :
1. S ignal Interpretation :
- Immediate Signals : For traders who prefer quick entries, the indicator displays immediate signals such as “Strong Buy” or “Early Sell” based on the current market snapshot.
- Latched Signals : When latching is enabled, the indicator holds a signal state until a clear reversal is confirmed, offering sustained trade setups.
2. Trend Confirmation :
- Use the HMA trend indicator and the optional higher timeframe trend filter to confirm the prevailing market direction before acting on signals.
3. Dynamic Thresholds & AI Forecasting :
- Monitor the dynamically adjusted oscillator thresholds and, if enabled, the AI bias to gauge potential shifts in market momentum.
4. Risk Management :
- Combine these signals with additional analysis and sound risk management practices to determine optimal entry and exit points for scalping trades.
Disclaimer :
This script is provided for educational and informational purposes only and does not constitute financial advice. Trading involves risk, and past performance is not indicative of future results. Always perform your own analysis and use proper risk management strategies before trading.

Sentiment Master Oscillator[BullByte]
The Sentiment Master Oscillator is a modern market sentiment indicator designed for traders seeking to identify early trend shifts and potential reversals with clarity. This oscillator combines multiple technical tools—RSI, MACD, EMAs, ADX, ATR, and volume filters—to deliver layered signals that help you assess market momentum in a clear and simplified manner.
Key Features:
- Multi-Indicator Approach :
Integrates RSI (with a smoothing function), MACD, and two EMAs to gauge momentum and trend direction. The oscillator also includes ADX and ATR filters to ensure that only markets with sufficient directional strength and volatility generate signals.
- Dynamic Signal Zones :
The oscillator produces a raw value ranging roughly from -3 to +3 (adjustable via a scaling factor). Positive readings suggest bullish conditions, while negative readings indicate bearish trends. Visual zones (Early, Confirmed, Strong) are clearly marked with color-coded horizontal lines to help you interpret the strength of the signal at a glance.
- Adaptive Smoothing :
For those who prefer quicker, more responsive signals (ideal for scalping), an adaptive smoothing option is available. When enabled, it applies a shorter smoothing period to the oscillator; otherwise, a more conservative base period is used.
- Reversal Alerts :
Yellow dots are plotted on the chart to highlight potential reversal points. These alerts are triggered when the oscillator crosses specific thresholds, coupled with volume and ATR conditions, signaling that a top or bottom may be forming.
- Customizable Filters :
- ATR Filter :Ensures that the market's volatility is above a set threshold before signaling.
- ADX Filter :Confirms sufficient trend strength.
- Volume Filter : Requires that trading volume surges above a multiple of its simple moving average, filtering out low-volume noise.
- Clear Signal Messaging :
Based on the combined signals from various indicators, the script categorizes market sentiment into actionable messages such as "Early Buy", "Confirmed Buy", "Strong Buy", "Early Sell", "Confirmed Sell", and "Strong Sell". A "Grey Zone" label is used when the oscillator is near neutral, indicating that no clear trend is present.
How to Use :
1. Entry and Exit Decisions : Use the different signal stages (Early, Confirmed, Strong) as guides for your entries and exits.
2. Trend Confirmation : Rely on the multi-indicator setup for added confirmation of prevailing market conditions before executing trades.
3. Reversal Cues : Pay attention to the reversal dots for potential turning points in the market, which can be used to adjust positions or initiate trades.
Disclaimer:
This indicator is intended for educational and informational purposes only. It should not be taken as financial advice. Always use appropriate risk management and combine it with your analysis before making any trading decisions. Past performance is not indicative of future results.
By adhering to TradingView's publishing guidelines, the BullByte Sentiment Master is designed to provide transparency, simplicity, and robust analysis tools to enhance your trading strategy. Enjoy a clearer view of market sentiment and make more informed trading decisions!
Dynamic Trend Indicator (DTI) - VWAP FilterThe Dynamic Trend Indicator (DTI) with VWAP Filter is a trend-following indicator.
It aims to identify and follow market trends while minimizing false signals in choppy or ranging markets.
The DTI combines a dynamically adjusted Exponential Moving Average (EMA) with a daily Volume Weighted Average Price (VWAP) confirmation filter and a cooldown mechanism to enhance signal reliability. This indicator is particularly useful for traders on intraday timeframes (e.g., 4-hour charts) who want to align their trades with the broader daily trend while avoiding whipsaws.
Key Features:
Dynamic Trend Line:
The core of the DTI is a trend line calculated using a custom EMA that adjusts its period dynamically based on market conditions.
The period of the EMA is determined by a combination of volatility (measured via ATR) and trend strength (measured via price momentum). In strong trends, the period shortens for faster responsiveness; in weak or ranging markets, it lengthens to reduce noise.
An optional smoothing EMA can be applied to the dynamic trend line to further reduce noise, with a user-defined smoothing length.
Daily VWAP Confirmation Filter:
A daily VWAP is calculated to provide a higher-timeframe trend bias. VWAP represents the average price paid for an asset during the day, weighted by volume, and is often used as a benchmark by institutional traders.
Buy signals are only generated when the price is above the daily VWAP (indicating a bullish daily bias), and sell signals are only generated when the price is below the VWAP (indicating a bearish daily bias).
The VWAP resets at the start of each day, ensuring it reflects the current day’s trading activity.
Cooldown Mechanism:
To prevent rapid signal reversals (whipsaws), the indicator includes a cooldown period between signals. After a buy or sell signal is generated, no new signals can be generated for a user-defined number of bars (default: 5 bars).
This helps filter out noise in choppy markets, ensuring signals are spaced out and more likely to align with significant trend changes.
Visual Elements:
Trend Line: Plotted on the chart, colored green when the price is above (uptrend) and red when below (downtrend). A gray color indicates a neutral trend.
Buy/Sell Signals: Displayed as green triangles below the bar for buy signals and red triangles above the bar for sell signals.
Background Coloring: The chart background is shaded green during uptrends and red during downtrends, providing a quick visual cue of the trend direction.
Daily VWAP Line: Optionally plotted as a purple step line, allowing traders to see the VWAP level and its relationship to the price.
Alerts:
The indicator includes built-in alerts for buy and sell signals, triggered when the price crosses the trend line and satisfies the VWAP filter and cooldown conditions.
Alert messages specify whether the signal is a buy or sell and confirm that the VWAP condition was met (e.g., "DTI Buy Signal: Price crossed above trend line and VWAP").
Input Parameters
Base Length (default: 14): The base period for calculating volatility and trend strength, used to adjust the dynamic EMA period.
Volatility Multiplier (default: 1.5): Adjusts the sensitivity of the dynamic period to market volatility (via ATR).
Trend Threshold (default: 0.5): Controls the sensitivity of the dynamic period to trend strength (via price momentum).
Use Smoothing (default: true): Enables/disables smoothing of the trend line with an additional EMA.
Smoothing Length (default: 3): The period for the smoothing EMA, if enabled.
Cooldown Bars (default: 5): The minimum number of bars between consecutive signals, reducing signal frequency in choppy markets.
Show Daily VWAP (default: true): Toggles the display of the daily VWAP line on the chart.
How It Works
Dynamic Trend Line Calculation:
Volatility is measured using the Average True Range (ATR) over the base length, scaled by the volatility multiplier.
Trend strength is calculated as the absolute price momentum (change in price over the base length) divided by the volatility factor.
The dynamic EMA period is adjusted based on the trend strength: stronger trends result in a shorter period (faster response), while weaker trends result in a longer period (more stability). The period is constrained between 5 and 50 to avoid extreme values.
A custom EMA function is used to handle the dynamic period, as Pine Script’s built-in ta.ema() requires a fixed length. The trend line is optionally smoothed with a secondary EMA.
Signal Generation:
A buy signal is generated when the price crosses above the trend line, the price is above the daily VWAP, and the cooldown period has elapsed.
A sell signal is generated when the price crosses below the trend line, the price is below the daily VWAP, and the cooldown period has elapsed.
The cooldown mechanism ensures that signals are not generated too frequently, reducing false signals in ranging markets.
Daily VWAP Calculation:
The VWAP is calculated by accumulating the price-volume product (close * volume) and total volume for the day, resetting at the start of each new day.
The VWAP is then computed as the cumulative price-volume divided by the cumulative volume, providing a volume-weighted average price for the day.
Usage
Timeframe: Best suited for intraday timeframes (e.g., 1-hour, 4-hour) where the daily VWAP provides a higher-timeframe trend bias. It can also be used on daily charts with adjustments to the cooldown period.
Markets: Works well in trending markets (e.g., forex, crypto, stocks) where the dynamic trend line can capture sustained price movements. The VWAP filter helps align signals with the daily trend, making it effective for assets with clear daily biases.
Trading Strategy:
Buy: Enter a long position when a green triangle (buy signal) appears, indicating the price has crossed above the trend line and is above the daily VWAP.
Sell: Enter a short position (or exit a long) when a red triangle (sell signal) appears, indicating the price has crossed below the trend line and is below the daily VWAP.
Use the trend line and VWAP as dynamic support/resistance levels to set stop-losses or take-profit targets.
Backtesting: Use TradingView’s strategy tester to evaluate the indicator’s performance on your chosen market and timeframe, adjusting parameters like cooldown_bars and volatility_mult to optimize for profitability.
Example
On a 4-hour SOLUSDT chart, the DTI with VWAP Filter might show:
An uptrend with the price above the green trend line and above the daily VWAP, generating buy signals as the price continues to rise.
A downtrend where the price falls below the red trend line and the daily VWAP, generating sell signals that align with the bearish daily bias.
During choppy periods, the cooldown mechanism and VWAP filter reduce false signals, ensuring trades are taken only when the price aligns with the daily trend.
Limitations
Lagging Nature: Like all trend-following indicators, the DTI may lag during sharp price reversals, as the dynamic EMA needs time to adjust.
Ranging Markets: While the VWAP filter and cooldown mechanism reduce whipsaws, the indicator may still generate some false signals in strongly ranging markets. Combining it with a trend strength filter (e.g., ADX) can help.
VWAP Dependency: The effectiveness of the VWAP filter depends on the market’s respect for the daily VWAP as a support/resistance level. In markets with low volume or erratic price action, the VWAP may be less reliable.
Potential Improvements
VWAP Buffer: Add a percentage buffer around the VWAP (e.g., require the price to be 1% above/below) to further reduce noise.
Multi-Timeframe VWAP: Incorporate a weekly VWAP for additional trend confirmation on longer timeframes.
Trend Strength Filter: Add an ADX filter to ensure signals are generated only during strong trends (e.g., ADX > 25).

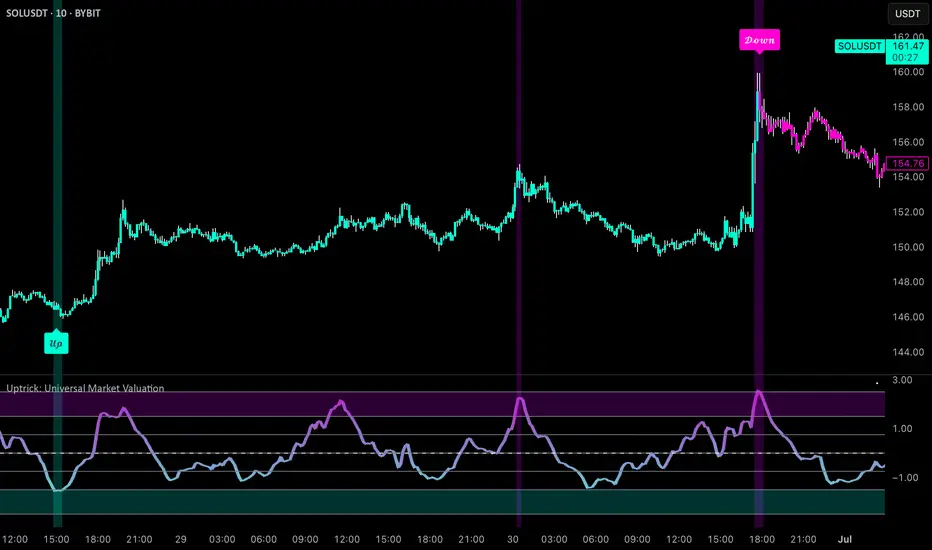
Uptrick: Universal Market ValuationIntroduction
Uptrick: Universal Market Valuation is created for traders who seek an analytical tool that brings together multiple signals in one place. Whether you focus on intraday scalping or long-term portfolio management, the indicator merges various well-known technical indicators to help gauge potential overvaluation, undervaluation, and trend direction. It is engineered to highlight different market dimensions, from immediate price momentum to extended cyclical trends.
Overview
The indicator categorizes market conditions into short-term, long-term, or a classic Z-Score style reading. Additionally, it draws on a unified trend line for directional bias. By fusing elements from traditionally separate indicators, the indicator aims to reduce “false positives” while giving a multidimensional view of price behavior. The indicator works best on cryptocurrency markets while remaining a universal valuation indicator that performs well across all timeframes. However, on lower timeframes, the Long-Term Combo input may be too long-term, so it's recommended to select the Short-Term Combo in the inputs for better adaptability.
Originality and Value
The Uptrick: Universal Market Valuation indicator is not just a simple combination of existing technical indicators—it introduces a multi-layered, adaptive valuation model that enhances signal clarity, reduces false positives, and provides traders with a more refined assessment of market conditions.
Rather than treating each included indicator as an independent signal, this script normalizes and synthesizes multiple indicators into a unified composite score, ensuring that short-term and long-term momentum, mean reversion, and trend strength are all dynamically weighted based on market behavior. It employs a proprietary weighting system that adjusts how each component contributes to the final valuation output. Instead of static threshold-based signals, the indicator integrates adaptive filtering mechanisms that account for volatility fluctuations, drawdowns, and momentum shifts, ensuring more reliable overbought/oversold readings.
Additionally, the script applies Z-Score-based deviation modeling, which refines price valuation by filtering out extreme readings that are statistically insignificant. This enhances the detection of true overvaluation and undervaluation points by comparing price behavior against a dynamically calculated standard deviation threshold rather than relying solely on traditional fixed oscillator bands. The MVRV-inspired ratio provides a unique valuation layer by incorporating historical fair-value estimations, offering deeper insight into market overextension.
The Universal Trend Line within the indicator is designed to smooth trend direction while maintaining responsiveness to market shifts. Unlike conventional trend indicators that may lag significantly or produce excessive false signals, this trend-following mechanism dynamically adjusts to changing price structures, helping traders confirm directional bias with reduced noise. This approach enables clearer trend recognition and assists in distinguishing between short-lived pullbacks and sustained market movements.
By merging momentum oscillators, trend strength indicators, volume-driven metrics, statistical deviation models, and long-term valuation principles into a single framework, this indicator eliminates the need for juggling multiple individual indicators, helping traders achieve a holistic market perspective while maintaining customization flexibility. The combination of real-time alerts, dynamic color-based valuation visualization, and customizable trend-following modes further enhances usability, making it a comprehensive tool for traders across different timeframes and asset classes.
Inputs and Features
• Calculation Window (Short-Term and Long-Term)
Defines how much historical data the indicator uses to evaluate the market. A smaller window makes the indicator more reactive, benefiting high-frequency traders. A larger window provides a steadier perspective for longer-term holders.
• Smoothing Period (Short-Term and Long-Term)
Controls how much the raw indicator outputs are “smoothed out.” Lower values reveal subtle intraday fluctuations, while higher values aim to present more robust, stable signals.
• Valuation Mechanism (Short Term Combo, Long Term Combo, Classic Z-Score)
Allows you to pick how the indicator evaluates overvaluation or undervaluation. Short Term Combo focuses on rapid oscillations, Long Term Combo assesses market health over more extended periods, and the Classic Z-Score approach highlights statistically unusual price levels.
Short-Term
• Determination Mechanism (Strict or Loose)
Governs the tolerance for labeling a market as overvalued or undervalued. Strict requires stronger confirmation; Loose begins labeling sooner, potentially catching moves earlier but risking more false signals.
Strict
Loose
• Select Color Scheme
Lets you choose the aesthetic style for your charts. Visual clarity can significantly improve reaction time, especially when multiple indicators are combined.
• Z-Score Coloring Mode (Heat or Slope)
Determines how the Classic Z-Score line and bars are colored. In Heat mode, the indicator intensifies color as readings move further from a baseline average. Slope mode changes color based on the direction of movement, making turning points more evident.
Classic Z-Score - Heat
Classic Z-Score - Slope
• Trend Following Mode (Short, Long, Extra Long, Filtered Long)
Offers various ways to compute and smooth the universal trend line. Short is more sensitive, Long and Extra Long are meant for extended time horizons, and Filtered Long applies an extra smoothing layer to help you see overarching trends rather than smaller fluctuations.
Short Term
Long Term
Extra Long Term
Filtered Long Term
• Table Display
An optional feature that places a concise summary table on the chart. It shows valuation states, trend direction, volatility condition, and other metrics, letting you observe multi-angle readings at a glance.
• Alerts
Multiple alert triggers can be set up—for crossing into overvaluation zones, for abrupt changes in trend, or for high volatility detection. Traders can stay informed without needing to watch charts continuously.
Why These Indicators Were Merged
• RSI (Relative Strength Index)
RSI is a cornerstone momentum oscillator that interprets speed and change of price movements. It has widespread recognition among traders for detecting potential overbought or oversold conditions. Including RSI provides a tried-and-tested layer of momentum insight.
• Stochastic Oscillator
This oscillator evaluates the closing price relative to its recent price range. Its responsiveness makes it valuable for pinpointing near-term price fluctuations. Where RSI offers a broader momentum picture, Stochastic adds fine-tuned detection of short-lived rallies or pullbacks.
• MFI (Money Flow Index)
MFI assesses buying and selling pressure by incorporating volume data. Many technical tools are purely price-based, but MFI’s volume component helps address questions of liquidity and actual money flow, offering a glimpse of how robust or weak a current move might be.
• CCI (Commodity Channel Index)
CCI shows how far price lies from its statistically “typical” trend. It can spot emerging trends or warn of overextension. Using CCI alongside RSI and Stochastic further refines the valuation layer by capturing price deviation from its underlying trajectory.
• ADX (Average Directional Index)
ADX reveals the strength of a trend but does not specify its direction. This is especially useful in combination with other oscillators that focus on bullish or bearish momentum. ADX can clarify whether a market is truly trending or just moving sideways, lending deeper context to the indicator's broader signals.
• MACD (Moving Average Convergence Divergence)
MACD is known for detecting momentum shifts via the interaction of two moving averages. Its inclusion ensures the indicator can capture transitional phases in market momentum. Where RSI and Stochastic concentrate on shorter-term changes, MACD has a slightly longer horizon for identifying robust directional changes.
• Momentum and ROC (Rate of Change)
Momentum and ROC specifically measure the velocity of price moves. By indicating how quickly (or slowly) price is changing compared to previous bars, they help confirm whether a trend is gathering steam, losing it, or is in a transitional stage.
• MVRV-Inspired Ratio
Drawn loosely from the concept of comparing market value to some underlying historical or fair-value metric, an MVRV-style ratio can help identify if an asset is trading above or below a considered norm. This additional viewpoint on valuation goes beyond simple price-based oscillations.
• Z-Score
Z-Score interprets how many standard deviations current prices deviate from a central mean. This statistical measure is often used to identify extreme conditions—either overly high or abnormally low. Z-Score helps highlight potential mean reversion setups by showing when price strays far from typical levels.
By merging these distinct viewpoints—momentum oscillators, trend strength gauges, volume flow, standard deviation extremes, and fundamental-style valuation measures—the indicator aims to create a well-rounded, carefully balanced final readout. Each component serves a specialized function, and together they can mitigate the weaknesses of a single metric acting alone.
Summary
This indicator simplifies multi-indicator analysis by fusing numerous popular technical signals into one tool. You can switch between short-term and long-term valuation perspectives or adopt a classic Z-Score approach for spotting price extremes. The universal trend line clarifies direction, while user-friendly color schemes, optional tabular summaries, and customizable alerts empower traders to maintain awareness without constantly monitoring every market tick.
Disclaimer
The indicator is made for educational and informational use only, with no claims of guaranteed profitability. Past data patterns, regardless of the indicators used, never ensure future results. Always maintain diligent risk management and consider the broader market context when making trading decisions. This indicator is not personal financial advice, and Uptrick disclaims responsibility for any trading outcomes arising from its use.
Impulse MACD enhancedThis indicator is designed to provide robust trade entry signals by combining multiple technical filters. Here’s a summary of its key components:
Impulse MACD Calculation:
Uses a Zero-Lag EMA (ZLEMA) based approach to generate a momentum indicator (with a signal line and histogram) that identifies shifts in market momentum.
Simulated Higher Timeframe (HTF) Trend Filter:
Computes an SMA over a multiplied period to simulate a higher timeframe trend. It requires the price to be in line with this broader trend before signaling an entry.
RSI Filter:
Ensures that for bullish entries the RSI is above a set threshold (indicating momentum) and for bearish entries it’s below a threshold.
ADX Filter:
Uses a manually calculated ADX to confirm that the market is in a strong trend (ADX > 30) to reduce false signals in weakly trending or sideways markets.
Volume Filter:
Compares the current volume to a 20‑bar SMA of volume, requiring volume to be significantly higher (by a user-defined percentage) to confirm the strength of the move.
VWAP Confirmation:
Uses the Volume-Weighted Average Price as an extra layer of confirmation: bullish signals require the price to be above VWAP, bearish signals below.
Optional Long-Term & Short-Term MA Filters:
These filters can be enabled to ensure the price is trading above (or below) longer-term and shorter-term moving averages, further aligning the trade with the prevailing trend.
ATR Volatility Filter:
Checks that volatility (as measured by the ATR relative to price) is below a maximum threshold, which helps avoid taking trades in overly volatile conditions.
Price Action Filter:
Ensures that for a bullish signal the current close is above the highest high over a specified lookback period (and vice versa for bearish), indicating a clear breakout.
Signal Throttling:
Signals are limited to one every 10 bars to prevent excessive trading.
When all these conditions are met, the indicator outputs an entry signal for either a bullish or bearish trade.
This multi-filter approach aims to increase win rate by reducing false signals and aligning trades with strong, confirmed trends while filtering out noise.

Altcoins Screener [SwissAlgo]Introduction: The Altcoins Screener at a Glance
The Altcoins Screener is a cryptocurrency analysis tool designed to provide an overview of potential trading opportunities across multiple crypto coins/tokens and categories. By combining technical analysis, price action assessment, and social metrics (via LunarCrush data), it presents market information and trading signals for a broad range of altcoins (approx. 300 USDT.P pairs of 9 crypto categories).
The screener is designed to consolidate market information onto a single chart , aiming to streamline the analysis of market conditions. It provides a consolidated market overview, which can simplify the assessment of market conditions, compared to monitoring individual charts with several layered indicators.
Key Features:
🔹 Multi-category analysis covering 300 crypto pairs of 9 categories on a single chart (Layer 1 & Top Coins, Layer2 & Scaling, Defi & Landing, Gaming & Metaverse, AI & Data, Exchanges & Trading, NFT & Social, Memes & Community, Other, User's Custom Portfolio).
🔹 Technical analysis with trade signals (Long/Short) based on an aggregated view of technical and social data points
🔹 Social sentiment integration through LunarCrush metrics (GalaxyScore, AltRank, Social Sentiment)
🔹 Real-time market scanning provides automated alerts when market conditions for specified coins/tokens potentially change.
🔹 Custom watchlist support for personalized monitoring (users can define a custom category containing a set of specific cryptocurrencies, i.e. own portfolio).
The screener presents data in a table format, using color-coded indicators to aid visual analysis. Detailed technical information is also provided. The assessments/trade signals provided by this indicator should be considered as one input among many when forming your trading strategy.
--------------------------------------
What It Does
The Altcoins Screener is a cryptocurrency analysis tool that offers:
Data Display and Analysis (Technical/Social):
🔹 Technical Metrics
* Technical Raw Data : Displays raw values for a range of technical indicators, including RSI, Stochastic RSI, DMI/ADX, RVI, ATR, OBV, and Hull Moving Averages (including their recent trends and potential significance).
Detailed view of key technical indicators, for further analysis and evaluation:
* Technical Analysis (Summary) : Provides a summarized interpretation of technical conditions based on aggregated parameters:
* Price Action
* Trend
* Momentum
* Volatility
* Volume
Summarized view of confluences for potential long/short bias:
🔹 Social Metrics (LunarCrush) : Presents data from LunarCrush®, including Galaxy Score®, AltRank®, and Social Sentiment® (including their recent trends and potential significance).
Lunarcrush data for the top 10 coins for each crypto category:
🔹 PVSRA (Price Volume & Market Makers Activity) Candles : Shows special candles highlighting potential market maker activity and volume anomalies, helping identify possible manipulation zones (including imbalance zones, i.e. price areas that market makers may revisit)
--------------------------------------
Key Features:
Automated trade signals (Long/Short) are generated based on algorithmic calculations and signal confidence levels across technical and social data points. These signals are intended to be used as one component of a broader trading strategy.
Custom sensitivity settings allow users to adjust the analysis timeframe (options: 1D, 2D, or 1W). Higher timeframes may provide a broader perspective, while the 2D setting is the default configuration.
Multi-category analysis covering a selection of approximately 300 crypto pairs across 9 predefined crypto categories.
Custom symbol selection: Users can define a custom list of up to 10 symbols for focused monitoring.
Automated Alerts to track potential trend changes across crypto categories (Long to Short to Neutral, or vice versa)
Visual Interface:
Organized table display with color-coded indicators to aid interpretation.
Clear and efficient format for scanning market information.
--------------------------------------
Target Audience
🔹 The screener is designed for cryptocurrency traders who:
Need to efficiently monitor multiple USDT perpetual futures markets
Use technical analysis in their trading decisions
Want to track sector-wide movements across crypto categories
🔹 Suitable for different trading styles:
Scalpers requiring quick market assessment
Swing traders analyzing multi-day trends
Position traders monitoring longer-term setups
The color-coded interface makes it accessible for intermediate traders while providing detailed metrics for advanced users. A basic understanding of technical analysis and crypto trading is recommended.
--------------------------------------
How It Works
The Altcoins Screener evaluates cryptocurrencies through a multi-layered analysis:
🔹 Core Analysis Components
Each parameter combines multiple indicators for comprehensive evaluation:
Price Action
EMA crossovers and momentum
Support/resistance zones
Candlestick patterns
Trend
Hull Moving Average system
DMI/ADX trend strength
Multi-timeframe confirmation
Momentum
RSI/Stochastic RSI readings
MACD convergence/divergence
Oscillator confirmations
Volatility
RVI/ATR measurements
Bollinger Bands behavior
Historical volatility trends
Volume
OBV trend analysis
Volume/price correlations
Volume profile assessment
🔹 Signal Generation Process
1. Real-time data collection across timeframes
2. Weighted indicator calculations
3. Parameter aggregation and analysis
4. Signal strength determination
5. Color-coding and alert generation
--------------------------------------
How to Use
🔹 Initial Setup:
Add the indicator to a chart (use the 1D timeframe)
Select your preferred crypto category or create a custom list
Choose between Technical Analysis or Technical Metrics view
Set data sensitivity based on your trading style
🔹 Using the Technical Analysis View:
Monitor color-coded dots for quick market assessment
Green: bullish conditions
Red: bearish conditions
Gray: neutral conditions
Check the "Trade Signal" column for potential Long/Short entries signaled by confluences among technical and/or social data points
🔹 Using the Technical Metrics View:
Review detailed numerical values
Monitor slopes (↑↓ arrows) for the most recent trend direction of each data point
Watch for pivotal points (highlighted cells): these are data points that suggest potential trend reversals
Focus on the confluence of multiple indicators
The technical metrics view corroborates the conclusions shown in the Technical Analysis View, providing more details about some critical data points.
🔹 Alert Configuration:
Enable Technical Alerts for signal notifications (which coin/token seems most suited for Long or Short trades, and which coin/token is in a neutral/uncertain state for trading = "No Trade")
Configure alert conditions based on trading style
Set timeframe-appropriate sensitivity
Monitor alert messages for trade signals
Instructions on how to set alerts are provided in the script (enable "Signals Setup Instructions" in User Interface to get a step-by-step guide about setting up alerts)
Best Practices:
Confirm signals across multiple timeframes
Use appropriate sensitivity for your trading style
Monitor multiple categories for sector rotation
Combine signals with your trading strategy
Verify signals with price action confirmation and deep dive into the charts of your potential targets
--------------------------------------
About the Settings
🔹 Crypto Category Selection
Layer 1 & Major: Top market cap coins (BTC, ETH, XRP,...), established protocols
Layer 2 & Scaling: ETH L2s, scaling solutions
DeFi & Lending: Decentralized finance protocols
Gaming & Metaverse: Gaming and virtual world tokens
AI & Data: Artificial intelligence and data projects
Exchange & Trading: Exchange tokens, trading protocols
NFT & Social: NFT platforms, social tokens
Memes & Community: Community-driven tokens
Others & Misc: Other categories
Custom Category: User-defined list (up to 10 symbols)
Data Type Options
Technical Analysis: Color-coded summary view
Technical Metrics: Detailed numerical values of some key technical data points
Sensitivity Settings
Higher: Shorter timeframe, more frequent signals
Default: Balanced timeframe, standard signals
Lower: Longer timeframe, stronger signals
Alert Settings
Technical Alerts: Trade signal notifications
Data Timeframe: Minimum 1D required
Theme: Dark/Light mode options
Note: All analysis is performed on USDT Perpetual Futures pairs from Binance
--------------------------------------
FAQ
Q: Does the screener work on other exchanges besides Binance?
A: No, it's designed specifically for Binance USDT Perpetual Futures pairs. Binance offers the highest liquidity and trading volume in the crypto derivatives market, making it ideal for technical analysis. The extensive range of trading pairs and reliable data streams help ensure more accurate signals and analysis. Using a single high-liquidity exchange also helps avoid inconsistencies that could arise from aggregating data across multiple platforms with varying liquidity levels.
Q: What's the minimum timeframe required?
A: The screener requires a minimum 1D (daily) timeframe. This requirement ensures that the technical analysis has sufficient data points for reliable signal generation. Lower timeframes can produce more noise and false signals, while daily timeframes help filter out market noise and identify stronger trends.
Q: Why are some social metrics showing "NaN"?
A: "NaN" (Not a Number) appears when cryptocurrencies don't have associated LunarCrush data. This typically occurs with newer tokens or those with lower market caps. The technical analysis remains fully functional regardless of social metric availability, as these are complementary data points.
Q: How often are signals updated?
A: Signals update with each new candle on the selected timeframe (1D, 2D, or 1W). For example, on the default 2D setting, signals are recalculated every two days as new candles form. This helps reduce noise while maintaining timely analysis of market conditions.
Q: Can I add spot trading pairs?
A: No, the screener is optimized for Binance USDT perpetual futures pairs for data consistency and analysis purposes. While spot and perpetual prices typically align closely due to arbitrage, using a single data source (Binance) and contract type (USDT perpetual) ensures uniform data quality and analysis across all pairs. This standardization helps maintain reliable technical analysis and signal generation.
Q: How many coins can I add to my custom list?
A: Users can add up to 10 custom symbols to their watchlist. This limit is designed to maintain optimal performance while allowing focused monitoring of specific assets. The custom list complements the predefined categories that cover over 300 pairs.
Q: What determines signal confidence levels?
A: Signal confidence is calculated through a weighted algorithm that considers multiple factors: trend strength (Hull MA, DMI/ADX), momentum indicators (RSI, SRSI), volatility measurements (RVI, ATR, BB), volume analysis (OBV, volume trends), and price action patterns. Higher confidence levels indicate stronger alignment across these factors.
Q: Are signals guaranteed to work?
A: No. Signals are analytical tools based on historical and current market data, not guaranteed predictions. They should be used as one component of a comprehensive trading strategy that includes proper risk management, position sizing, and additional confirmation factors. Past performance does not guarantee future results.
Q: Why does the screener need higher timeframes?
A: Higher timeframes (1D minimum) provide several benefits: reduced market noise, more reliable technical signals, better trend identification, and lower likelihood of false signals. They also align better with institutional trading patterns and allow for a more thorough analysis of market conditions across multiple indicators.
--------------------------------------
Conclusion
The Altcoins Screener is a comprehensive crypto market analysis tool that:
Scans 300+ cryptocurrencies across 9 sectors on a single chart
Combines technical indicators and social metrics for signal generation
Identifies potential trading opportunities through color-coded visuals
Saves time by eliminating the need to monitor multiple charts
The tool is suited for:
Market overview and sector rotation analysis
Quick assessment of market conditions
Technical and social sentiment tracking
Systematic trading approach with alerts
Use this screener with caution and as a complement to any other tool you use to define your trading strategy.
--------------------------------------
Disclaimer
This indicator is for informational and educational purposes only:
Not financial advice: This indicator should not be considered investment advice.
No guarantee of accuracy: The indicator's calculations and signals are based on specific algorithms and data sources, but accuracy cannot be guaranteed. Market conditions can change rapidly.
Past performance is not predictive: Past performance of the indicator's signals or any specific asset is not indicative of future results.
Substantial risk of loss: Trading cryptocurrencies involves a substantial risk of loss. You can lose money trading these assets.
User responsibility: Users are solely responsible for their own trading decisions and should exercise caution.
Independent research required: Always conduct thorough independent research (DYOR) before making any trading decisions.
Technical analysis is one of many tools: Technical analysis, including the output of this indicator, is just one tool among many and should not be relied upon exclusively.
Risk management is essential: Use proper risk management techniques, including position sizing and stop-loss orders.
Comprehensive strategy: Use this tool as part of a comprehensive trading strategy, not as a standalone solution.
No liability for trading results: The Author assumes no responsibility or liability for any trading results or losses incurred as a result of using this indicator.
No TradingView affiliation: SwissAlgo is an independent entity and is not affiliated with or endorsed by TradingView.
LunarCrush data: The indicator utilizes publicly available data from LunarCrush. LunarCrush data and trademarks are the property of LunarCrush.
Consult a financial advisor: Consult with a qualified financial advisor before making any investment decisions.
By using this indicator, you acknowledge and agree to these terms. If you do not agree with these terms, please refrain from using this indicator.

[MAD] Weighted Trend Detector--> Purpose
The Weighted Trend Detector evaluates market direction by combining multiple technical indicators (RSI, MACD, Moving Averages, ADX, and Volume) across up to three different timeframes.
It calculates an overall trend score to help visualize whether conditions are bullish, bearish, or neutral.
--> Scaling & Weightings
Each component indicator contributes a score between -1.0 and +1.0. User-defined weights (e.g., 0.2 for RSI, 0.3 for MACD) determine how much each indicator influences the final score. An adaptive scaling mechanism ensures extreme values remain in view by dynamically setting the minimum and maximum of the score range over a specified lookback period.
--> Basic Parameters of Individual Indicators
RSI Period: Number of bars for the Relative Strength Index calculation; higher values smooth out noise but may lag.
MACD Fast/Slow/Signal: EMA-based periods to identify momentum shifts. A shorter “Fast” length reacts quickly, while a longer “Slow” length is smoother.
Moving Averages (Short & Long Lengths): Simple Moving Averages used to gauge shorter- vs. longer-term price direction.
ADX Length: Defines how many bars are considered when measuring trend strength. Higher values produce smoother ADX lines.
Volume MA Length: Period over which the average volume is calculated to compare against current volume.
--> Colors & How They Are Mixed
The background color scales from a negative color (for lower scores) to a positive color (for higher scores).
Near the highest or lowest parts of the score range, additional blending occurs if the slope (change in score) reverses:
Turning Down: Mixes with a user-chosen “warning” color if the score is high but moving lower.
Turning Up: Mixes with a user-chosen “recovery” color if the score is low but moving higher.
All colors (including line and label text) can be adjusted in the script’s inputs to suit personal preferences.colors are customizable via inputs.
Have fun :-)

DIN: Dynamic Trend NavigatorDIN: Dynamic Trend Navigator
Overview
The Dynamic Trend Navigator script is designed to help traders identify and capitalize on market trends using a combination of Weighted Moving Averages (WMA), Volume Weighted Average Price (VWAP), and Anchored VWAP (AVWAP). The script provides customizable settings and flexible alerts for various crossover conditions, enhancing its utility for different trading strategies.
Key Features
- **1st and 2nd WMA**: Allows users to set and visualize two Weighted Moving Averages. These can be customized to any period, providing flexibility in trend identification.
- **VWAP and AVWAP**: Incorporates both VWAP and AVWAP, offering insights into price levels adjusted by volume.
- **ATR and ADX Indicators**: Includes the Average True Range (ATR) and Average Directional Index (ADX) to help assess market volatility and trend strength.
- **Flexible Alerts**: Configurable buy and sell alerts for any crossover condition, making it versatile for various trading strategies.
How to Use the Script
1. **Set the WMA Periods**: Customize the periods for the 1st and 2nd WMAs to suit your trading strategy.
2. **Enable VWAP and AVWAP**: Choose whether to include VWAP and AVWAP in your analysis by enabling the respective settings.
3. **Configure Alerts**: Set up alerts for the desired crossover conditions (WMA, VWAP, AVWAP) to receive notifications for potential trading opportunities.
4. **Monitor Signals**: Watch for buy and sell signals indicated by triangle shapes on the chart, which appear at the selected crossover points.
When to Use
- **Best Time to Use**: The script is most effective in trending markets where price movements are well-defined. It helps traders stay on the right side of the trend and avoid false signals during periods of low volatility.
- **When Not to Use**: Avoid using the script in choppy or sideways markets where price action lacks direction. The script may generate false signals in such conditions, leading to potential losses.
Benefits of VWAP and AVWAP
- **VWAP**: The Volume Weighted Average Price provides a price benchmark that adjusts for volume, helping traders identify fair value levels. It is particularly useful for intraday trading and gauging market sentiment.
- **AVWAP**: The Anchored VWAP allows traders to set a starting point for VWAP calculations, providing flexibility in analyzing price levels over specific periods or events. This helps in identifying key support and resistance levels based on volume.
Unique Aspects
- **Customizability**: The script offers extensive customization options for WMA periods, VWAP, AVWAP, and alert conditions, making it adaptable to various trading strategies.
- **Combining Indicators**: By integrating WMAs, VWAP, AVWAP, ATR, and ADX, the script provides a comprehensive view of market conditions, enhancing decision-making.
- **Real-Time Alerts**: The flexible alert system ensures traders receive timely notifications for potential trade setups, improving responsiveness to market changes.
Examples
- **Example 1**: A trader sets the 1st WMA to 8 and the 2nd WMA to 100, enabling the VWAP. When the 1st WMA crosses above the 2nd WMA or VWAP, a buy signal is triggered, indicating a potential long entry.
- **Example 2**: A trader sets the AVWAP to start 30 bars ago and monitors for crossovers with the 1st WMA. When the 1st WMA crosses below the AVWAP, a sell signal is triggered, suggesting a potential short entry.
Final Notes
The Dynamic Trend Navigator script is a powerful tool for traders looking to enhance their market analysis and trading decisions. Its unique combination of customizable indicators and flexible alert system sets it apart from other scripts, making it a valuable addition to any trader's toolkit.
Disclaimer: Never any financial advice. Just ThisGirl loving experimenting with indicators to help myself, as well as others.

Perfect MACD Overview
This script is an advanced implementation of the Moving Average Convergence Divergence (MACD) indicator, enhanced with adaptive features, reinforcement learning concepts, and improved trend detection mechanisms. It aims to provide a more responsive and dynamic tool for technical analysis by adjusting its parameters based on current market conditions.
Key Components
Inputs and Parameters:
Lookback Periods: Defines the periods for volatility calculations.
Weighting Factors: Base values for momentum, volatility, and volume influences.
MACD Parameters: Initial fast and slow lengths, and signal smoothing period.
Reinforcement Learning Parameters: Learning rate, memory factor, reward threshold, and decay factor.
Simulation Parameters: Number of simulations and history depth for Monte Carlo simulation.
Feature Extraction:
Rate of Change (ROC): Measures the percentage change in price over a specified period.
Average True Range (ATR): Calculates market volatility.
Trend Detection using ADX:
Average Directional Index (ADX): Assesses the strength of a trend.
Volume Analysis: Compares short-term and long-term volume to detect high-volume periods.
Market State Determination: Categorizes the market as "Trending Strong," "Trending," "High Volume," or "Range Bound" based on ADX and volume.
Adaptive Weight Adjustments:
Modifies weighting factors for momentum, volatility, and volume based on the current market state to enhance responsiveness.
Adaptive Learning Rate:
Adjusts the learning rate dynamically based on the ratio of short-term to long-term volatility.
Reinforcement Learning:
Error Calculation: Computes the difference between the predicted and actual MACD values.
Reward System: Applies a reward mechanism to fine-tune MACD lengths, aiming to minimize prediction error.
Monte Carlo Simulation:
Simulates future returns using historical data to predict potential price movements.
Uses the Box-Muller transform to generate random values assuming a normal distribution.
MACD Length Adjustment:
Adjusts the fast and slow lengths of the MACD based on simulated returns and reinforcement learning outcomes.
MACD Calculation:
Calculates both the standard MACD and the adaptive MACD using the adjusted lengths.
Signal Reinforcement:
Enhances the MACD signal by incorporating volatility and volume-based reinforcements.
Applies an adaptive memory factor to balance the influence of new information against historical data.
Plotting:
Plots the adaptive MACD line, signal line, and histogram.
Uses background colors to indicate the current market state for visual emphasis.
Usage
Customization: Users can adjust input parameters to suit different assets and timeframes.
Interpretation:
Adaptive MACD Line and Signal Line: Used similarly to the traditional MACD but adapt to market conditions.
Histogram: Represents the difference between the MACD line and the signal line, indicating momentum.
Background Colors: Provide a visual cue of the market state, helping users make informed decisions.

KaracaticaKaracatica Indicator - Dynamic Trend Following.
The Karacatica Indicator is designed for traders looking for a comprehensive approach to trend trading by combining directional movements and Average True Range (ATR).
Key Features: ATR-Based Trend Detection: The indicator uses Average True Range (ATR) to measure market volatility and integrates with price action to capture strong trend movements.
Directional Indicators (DI's): Calculates DI's (Positive Directional Index Di+ and Negative Directional Index Di-) to compare buying and selling pressure. This allows for more accurate trend identification, highlighting when buyers or sellers dominate.
Signal Generation: Buy Signal: Generated when price action is bullish (close is above the previous period's close) and DI+ exceeds DI-, indicating that buyers are in control.
Sell Signal: Triggered when price action is bearish (close is below the previous period’s close) and DI- exceeds DI+, showing that sellers dominate the market.
Visual Signals: Green triangle (▲) indicating a buy opportunity, plotted below the bar.
Fuchsia triangle (▼) signaling a sell opportunity, plotted above the bar.
Customizable Inputs: The indicator allows users to adjust the ATR period, DI length, and ADX smoothing parameters, giving it the flexibility to suit different trading styles and timeframes.
Why should you use it?
This indicator simplifies the process of analyzing the combination market direction and trend strength. It is especially useful for traders who like strong directional movements and want clear, visually represented entry signals. The Karacatica Indicator can generate good buy or sell signals in trading and can be used on multiple assets and timeframes, making it adaptable to different market conditions.
Settings Overview: ATR Period: Sets the period for calculating ATR, used to determine market volatility.
DI Length: The length of the lookback period for DI+ and DI- calculations.
ADX Smoothing: Smooths the ADX (Average Directional Index) to reduce noise.
Feel free to experiment with this indicator, share feedback, and adapt it to your trading strategy. Good trading!
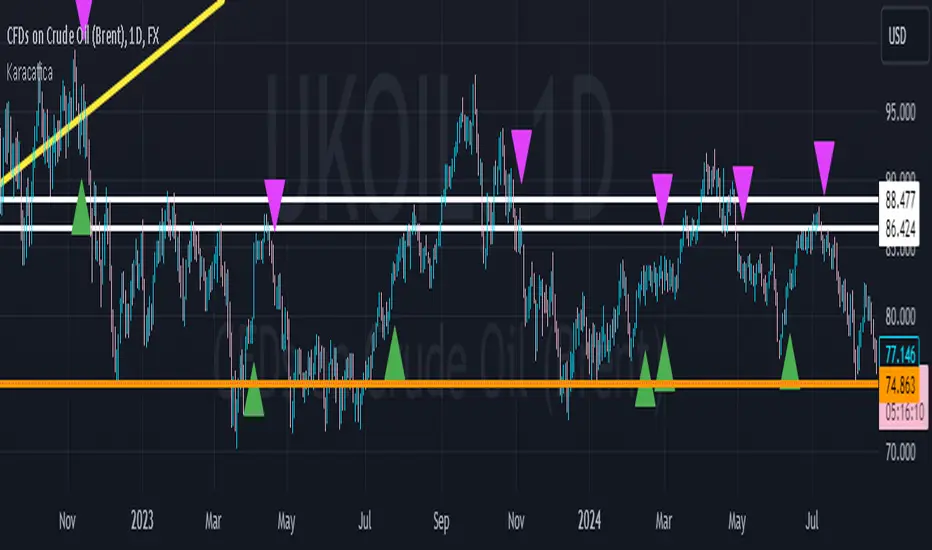
ZERO LAG TRADE SIGNALS by BootcampZeroThe ZERO LAG TRADE SIGNALS by BootcampZero indicator is a versatile tool designed to help traders identify optimal entry and exit points for both short-term scalping and long-term trading across multiple time frames. It combines several well-known technical analysis methods, including moving averages, trend analysis, directional indicators, and adaptive trend calculations, to deliver reliable buy and sell signals.
Short-Term Scalping (Under 5-Minute Time Frames)
For short-term traders who prefer quick trades on lower time frames, such as under 5 minutes, this indicator uses a combination of the EMA (Exponential Moving Average) and SMA (Simple Moving Average) to spot fast trend reversals. The indicator is particularly useful for scalpers because it focuses on detecting short-term price momentum by comparing the faster-moving averages with slower ones, triggering signals based on their crossover.
Buy Signals are generated when a fast-moving EMA crosses above a slower-moving SMA, indicating upward momentum.
Sell Signals are triggered when the fast-moving EMA crosses below the slower-moving SMA, signaling potential downward price movement.
In addition, the Adaptive Trend Finder feature dynamically adjusts to recent price deviations and volatility, making it easier for scalpers to spot the prevailing short-term trend with high confidence. The indicator also uses ADX (Average Directional Index) for momentum confirmation, ensuring that signals are only generated during strong price trends, reducing false positives in sideways markets.
Long-Term Trading (Above 1-Day Charts)
When applied to higher time frames such as daily charts or above, this indicator excels in generating reliable long-term buy and sell signals, perfect for swing traders and long-term investors. The Kaufman Adaptive Moving Average (KAMA) and the Ichimoku Cloud are used to assess long-term trends by filtering out market noise and focusing on sustainable price direction.
KAMA helps to adapt the moving average based on market volatility, providing smoother signals that minimize whipsawing in longer-term trades.
Ichimoku Cloud provides additional trend confirmation by identifying whether the market is bullish or bearish based on the relationship between key lines like the Tenkan-Sen (Conversion Line) and Kijun-Sen (Base Line), and how the current price interacts with the Ichimoku Cloud itself.
The indicator also integrates PPO (Percentage Price Oscillator) to capture divergences between price and momentum, further supporting traders in holding positions for extended periods when the signal strength is robust.
Key Technical Values and Factors for Signals
EMA and SMA Crossover: Fast EMA vs. Slow SMA to detect short-term trend reversals.
ADX: Helps gauge the strength of the trend; signals are only generated in trending markets.
KAMA: Filters noise in long-term trends, providing smooth signals based on market volatility.
Ichimoku Cloud: Offers insight into long-term trends and momentum by analyzing price relative to the cloud.
PPO: Detects divergences between price and momentum for trend continuation or reversal signals.
How It Works
Buy signals are generated when bullish conditions are met, and the indicator confirms momentum with ADX, crossover of the EMAs, or a bullish breakout from the Ichimoku Cloud.
Sell signals are triggered when bearish conditions prevail, confirmed by the same factors in reverse, such as a bearish EMA crossover or weakness in ADX.
By combining these powerful tools, ZERO LAG TRADE SIGNALS by BootcampZero offers traders a comprehensive system for both quick scalping trades and more conservative long-term positioning, providing reliable and adaptive signals across different market conditions.
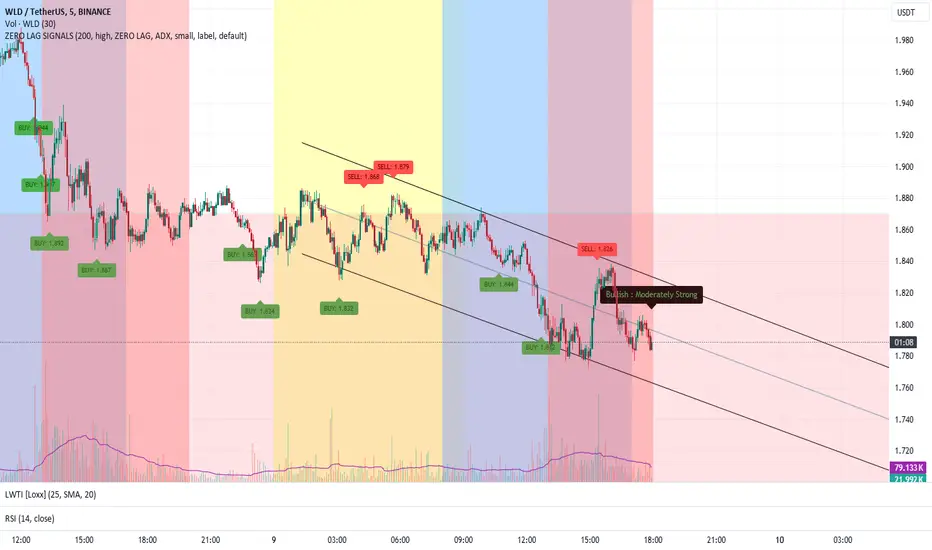
DILM TRADING - Market Sentiment and FibonacciDILM TRADING - Market Sentiment and Fibonacci
Overview
The DILM TRADING - Market Sentiment and Fibonacci indicator is designed to provide traders with a comprehensive view of market trends and potential trading opportunities. By combining several popular technical indicators such as the SuperTrend, Fibonacci levels, and multiple sentiment indicators, this tool offers a deep analysis of market dynamics. Each component has been carefully selected to work in harmony, providing users with reliable entry and exit signals and helping them navigate volatile markets.
Why This Combination?
This indicator brings together different elements with specific purposes:
SuperTrend: A trend-following indicator that helps identify the market's current direction and acts as a dynamic stop-loss tool.
Fibonacci Levels: Known for pinpointing potential market reversal points, these levels provide crucial support and resistance areas for traders to set stop-losses and take-profits.
Sentiment Indicators: Tools like RSI, MACD, and Ichimoku are combined to gauge market momentum, allowing traders to assess whether a market is overbought or oversold, and whether the current trend is strong enough to continue or reverse.
The combination of these indicators gives traders a complete framework for analyzing the market: trend direction, market sentiment, and key price levels. Each of these elements works in tandem to provide signals that are both timely and accurate.
Key Features
SuperTrend
Based on the Average True Range (ATR), the SuperTrend indicator is an excellent way to determine the current trend. If the price is above the SuperTrend line, it suggests an uptrend, whereas if the price is below it, a downtrend is indicated. It is also a highly effective tool for setting trailing stop-losses, thereby improving risk management.
Fibonacci Levels
The script automatically calculates Fibonacci retracement levels based on the highest and lowest points within a specific timeframe. These levels are essential for identifying potential reversal zones, key areas for stop-losses, and take-profit levels. The levels adjust according to the prevailing trend, making them a dynamic and responsive tool for any market condition.
Sentiment Indicators
This section integrates multiple sentiment indicators to give a holistic view of market direction:
Ichimoku Cloud: Measures the strength of trends and identifies potential reversal zones using clouds (Kumo).
OBV (On-Balance Volume): Tracks volume changes to confirm the direction of price movements.
CMF (Chaikin Money Flow): Monitors the money flow to identify buying or selling pressure.
RSI (Relative Strength Index): Highlights overbought or oversold conditions, signaling potential trend reversals.
MACD: A reliable tool for identifying bullish and bearish crossovers.
ADX (Average Directional Index): Determines the strength of the prevailing trend, helping to confirm whether it's likely to continue or weaken.
Volatility Filter
The ATR (Average True Range) acts as a filter to identify periods of high or low volatility, helping traders to adapt their strategies to the current market environment. High volatility suggests larger price swings, potentially offering better trading opportunities, while low volatility indicates consolidation or range-bound conditions.
Order Blocks
The script visually identifies bullish and bearish order blocks on the chart. These zones represent areas where significant buying or selling occurred, making them crucial for spotting potential breakout or reversal points.
How to Use
Entry/Exit: Fibonacci levels (50% or 61.8%) serve as potential entry points, while the 0% and 100% levels can be used to set take-profit and stop-loss levels.
Sentiment Analysis: The overall market sentiment is derived from the combination of Ichimoku, OBV, CMF, RSI, ADX, and other tools, helping traders make informed decisions on whether to buy or sell.
Risk Management: Use SuperTrend and Fibonacci levels to set precise stop-loss points and improve risk management.
New Feature: Moving Average and RSI Confirmation
A recent addition allows users to calculate two moving averages (short and long) and the RSI on a timeframe of their choice. An entry signal is generated when the short moving average crosses above the long, and the RSI is below a specific threshold. Conversely, a sell signal is displayed when the short moving average crosses below the long, and the RSI is above a defined level.
Limitations
This indicator may be less effective during periods of low volatility or range-bound markets. It's important to use this tool in conjunction with other analysis techniques, as relying on a single indicator could lead to false signals.
DILM TRADING - Sentiment de marché et Fibonacci
Vue d'ensemble
L'indicateur DILM TRADING - Sentiment de marché et Fibonacci a été conçu pour offrir une vue d'ensemble des tendances du marché et des opportunités de trading potentielles. En combinant plusieurs indicateurs techniques populaires, tels que le SuperTrend, les niveaux de Fibonacci, et divers indicateurs de sentiment, cet outil fournit une analyse complète des dynamiques du marché. Chaque composant a été soigneusement sélectionné pour fonctionner ensemble, offrant des signaux d'entrée et de sortie fiables.
Pourquoi cette combinaison ?
Cette combinaison d'indicateurs permet de fournir un cadre complet pour analyser le marché. Le SuperTrend permet d'identifier la tendance, tandis que les niveaux de Fibonacci aident à déterminer les zones de retournement clés. Les indicateurs de sentiment, comme le RSI et le MACD, ajoutent une dimension supplémentaire en mesurant la force et la direction du marché.
Caractéristiques clés et Utilisation
SuperTrend : Indique la tendance actuelle et propose des niveaux de stop-loss dynamiques.
Niveaux de Fibonacci : Utilisés pour repérer des points de retournement potentiels et définir des niveaux de stop-loss et de take-profit.
Indicateurs de Sentiment : Outils comme l'Ichimoku, le RSI, et l'ADX fournissent une analyse globale du marché, permettant de prendre des décisions éclairées.
Nouvelle fonctionnalité : Confirmation des Moyennes Mobiles et RSI
Cette fonctionnalité permet d'utiliser deux moyennes mobiles et le RSI pour générer des signaux d'achat et de vente basés sur les croisements et les niveaux de surachat/survente du RSI.
Conclusion
Le DILM TRADING - Sentiment de marché et Fibonacci est un outil puissant et polyvalent, conçu pour les traders cherchant à affiner leurs stratégies grâce à une analyse complète des tendances et du sentiment du marché.

Six PillarsGeneral Overview
The "Six Pillars" indicator is a comprehensive trading tool that combines six different technical analysis methods to provide a holistic view of market conditions.
These six pillars are:
Trend
Momentum
Directional Movement (DM)
Stochastic
Fractal
On-Balance Volume (OBV)
The indicator calculates the state of each pillar and presents them in an easy-to-read table format. It also compares the current timeframe with a user-defined comparison timeframe to offer a multi-timeframe analysis.
A key feature of this indicator is the Confluence Strength meter. This unique metric quantifies the overall agreement between the six pillars across both timeframes, providing a score out of 100. A higher score indicates stronger agreement among the pillars, suggesting a more reliable trading signal.
I also included a visual cue in the form of candle coloring. When all six pillars agree on a bullish or bearish direction, the candle is colored green or red, respectively. This feature allows traders to quickly identify potential high-probability trade setups.
The Six Pillars indicator is designed to work across multiple timeframes, offering a comparison between the current timeframe and a user-defined comparison timeframe. This multi-timeframe analysis provides traders with a more comprehensive understanding of market dynamics.
Origin and Inspiration
The Six Pillars indicator was inspired by the work of Dr. Barry Burns, author of "Trend Trading for Dummies" and his concept of "5 energies." (Trend, Momentum, Cycle, Support/Resistance, Scale) I was intrigued by Dr. Burns' approach to analyzing market dynamics and decided to put my own twist upon his ideas.
Comparing the Six Pillars to Dr. Burns' 5 energies, you'll notice I kept Trend and Momentum, but I swapped out Cycle, Support/Resistance, and Scale for Directional Movement, Stochastic, Fractal, and On-Balance Volume. These changes give you a more dynamic view of market strength, potential reversals, and volume confirmation all in one package.
What Makes This Indicator Unique
The standout feature of the Six Pillars indicator is its Confluence Strength meter. This feature calculates the overall agreement between the six pillars, providing traders with a clear, numerical representation of signal strength.
The strength is calculated by considering the state of each pillar in both the current and comparison timeframes, resulting in a score out of 100.
Here's how it calculates the strength:
It considers the state of each pillar in both the current timeframe and the comparison timeframe.
For each pillar, the absolute value of its state is taken. This means that both strongly bullish (2) and strongly bearish (-2) states contribute equally to the strength.
The absolute values for all six pillars are summed up for both timeframes, resulting in two sums: current_sum and alternate_sum.
These sums are then added together to get a total_sum.
The total_sum is divided by 24 (the maximum possible sum if all pillars were at their strongest states in both timeframes) and multiplied by 100 to get a percentage.
The result is rounded to the nearest integer and capped at a minimum of 1.
This calculation method ensures that the Confluence Strength meter takes into account not only the current timeframe but also the comparison timeframe, providing a more robust measure of overall market sentiment. The resulting score, ranging from 1 to 100, gives traders a clear and intuitive measure of how strongly the pillars agree, with higher scores indicating stronger potential signals.
This approach to measuring signal strength is unique in that it doesn't just rely on a single aspect of price action or volume. Instead, it takes into account multiple factors, providing a more robust and reliable indication of potential market moves. The higher the Confluence Strength score, the more confident traders can be in the signal.
The Confluence Strength meter helps traders in several ways:
It provides a quick and easy way to gauge the overall market sentiment.
It helps prioritize potential trades by identifying the strongest signals.
It can be used as a filter to avoid weaker setups and focus on high-probability trades.
It offers an additional layer of confirmation for other trading strategies or indicators.
By combining the Six Pillars analysis with the Confluence Strength meter, I've created a powerful tool that not only identifies potential trading opportunities but also quantifies their strength, giving traders a significant edge in their decision-making process.
How the Pillars Work (What Determines Bullish or Bearish)
While developing this indicator, I selected and configured six key components that work together to provide a comprehensive view of market conditions. Each pillar is set up to complement the others, creating a synergistic effect that offers traders a more nuanced understanding of price action and volume.
Trend Pillar: Based on two Exponential Moving Averages (EMAs) - a fast EMA (8 period) and a slow EMA (21 period). It determines the trend by comparing these EMAs, with stronger trends indicated when the fast EMA is significantly above or below the slow EMA.
Directional Movement (DM) Pillar: Utilizes the Average Directional Index (ADX) with a default period of 14. It measures trend strength, with values above 25 indicating a strong trend. It also considers the Positive and Negative Directional Indicators (DI+ and DI-) to determine trend direction.
Momentum Pillar: Uses the Moving Average Convergence Divergence (MACD) with customizable fast (12), slow (26), and signal (9) lengths. It compares the MACD line to the signal line to determine momentum strength and direction.
Stochastic Pillar: Employs the Stochastic oscillator with a default period of 13. It identifies overbought conditions (above 80) and oversold conditions (below 20), with intermediate zones between 60-80 and 20-40.
Fractal Pillar: Uses Williams' Fractal indicator with a default period of 3. It identifies potential reversal points by looking for specific high and low patterns over the given period.
On-Balance Volume (OBV) Pillar: Incorporates On-Balance Volume with three EMAs - short (3), medium (13), and long (21) periods. It assesses volume trends by comparing these EMAs.
Each pillar outputs a state ranging from -2 (strongly bearish) to 2 (strongly bullish), with 0 indicating a neutral state. This standardized output allows for easy comparison and aggregation of signals across all pillars.
Users can customize various parameters for each pillar, allowing them to fine-tune the indicator to their specific trading style and market conditions. The multi-timeframe comparison feature also allows users to compare pillar states between the current timeframe and a user-defined comparison timeframe, providing additional context for decision-making.
Design
From a design standpoint, I've put considerable effort into making the Six Pillars indicator visually appealing and user-friendly. The clean and minimalistic design is a key feature that sets this indicator apart.
I've implemented a sleek table layout that displays all the essential information in a compact and organized manner. The use of a dark background (#030712) for the table creates a sleek look that's easy on the eyes, especially during extended trading sessions.
The overall design philosophy focuses on presenting complex information in a simple, intuitive format, allowing traders to make informed decisions quickly and efficiently.
The color scheme is carefully chosen to provide clear visual cues:
White text for headers ensures readability
Green (#22C55E) for bullish signals
Blue (#3B82F6) for neutral states
Red (#EF4444) for bearish signals
This color coding extends to the candle coloring, making it easy to spot when all pillars agree on a bullish or bearish outlook.
I've also incorporated intuitive symbols (↑↑, ↑, →, ↓, ↓↓) to represent the different states of each pillar, allowing for quick interpretation at a glance.
The table layout is thoughtfully organized, with clear sections for the current and comparison timeframes. The Confluence Strength meter is prominently displayed, providing traders with an immediate sense of signal strength.
To enhance usability, I've added tooltips to various elements, offering additional information and explanations when users hover over different parts of the indicator.
How to Use This Indicator
The Six Pillars indicator is a versatile tool that can be used for various trading strategies. Here are some general usage guidelines and specific scenarios:
General Usage Guidelines:
Pay attention to the Confluence Strength meter. Higher values indicate stronger agreement among the pillars and potentially more reliable signals.
Use the multi-timeframe comparison to confirm signals across different time horizons.
Look for alignment between the current timeframe and comparison timeframe pillars for stronger signals.
One of the strengths of this indicator is it can let you know when markets are sideways – so in general you can know to avoid entering when the Confluence Strength is low, indicating disagreement among the pillars.
Customization Options
The Six Pillars indicator offers a wide range of customization options, allowing traders to tailor the tool to their specific needs and trading style. Here are the key customizable elements:
Comparison Timeframe:
Users can select any timeframe for comparison with the current timeframe, providing flexibility in multi-timeframe analysis.
Trend Pillar:
Fast EMA Period: Adjustable for quicker or slower trend identification
Slow EMA Period: Can be modified to capture longer-term trends
Momentum Pillar:
MACD Fast Length
MACD Slow Length
MACD Signal Length These can be adjusted to fine-tune momentum sensitivity
DM Pillar:
ADX Period: Customizable to change the lookback period for trend strength measurement
ADX Threshold: Adjustable to define what constitutes a strong trend
Stochastic Pillar:
Stochastic Period: Can be modified to change the sensitivity of overbought/oversold readings
Fractal Pillar:
Fractal Period: Adjustable to identify potential reversal points over different timeframes
OBV Pillar:
Short OBV EMA
Medium OBV EMA
Long OBV EMA These periods can be customized to analyze volume trends over different timeframes
These customization options allow traders to experiment with different settings to find the optimal configuration for their trading strategy and market conditions. The flexibility of the Six Pillars indicator makes it adaptable to various trading styles and market environments.

CulturaTrading IndicadorThe CULTURATRADING INDICATOR refines trading signals by integrating advanced analysis techniques across RSI, MACD, and ADX indicators. Here's a deep dive into its functionalities:
RSI Analysis:
Buying Signal Identification: The RSI component is calibrated not just to flag potential reversal points but to identify strong momentum. An RSI exceeding 60 is not merely an overbought signal; it indicates a robust buying momentum when it turns blue, aligning with CULTURATRADING STRATEGY's criteria for a potential long position.
Level 55 Significance: This level acts as a transitional threshold. When the RSI retreats below this point, it suggests a weakening momentum, prompting a reassessment of open positions.
Oversold Condition & Action: An RSI dipping below 40 signals an oversold condition, turning red, and aligning with a potential for a next long signal. staying alert when RSI stay over 40 level again and over on RSI Moving Average Following the idea CULTURATRADING STRATEGY.
Moving Average on RSI (MA RSI):
The inclusion of a Moving Average on the RSI serves as a trend filter. When the RSI is above the MA RSI, it underscores the strength of the current trend; conversely, if the RSI falls below the MA RSI, it calls for close all RSI long trade.
Volatility Histogram:
Color Coding & Market Response: The histogram changes colors based on market volatility and trend strength. Blue indicates a bullish trend continuation, where traders might consider entering long or holding positions. Rose suggests a market shift where traders should be vigilant, potentially taking profits from long or opening shorts positions. Grey denotes low volatility, signaling a period of market indecision where entering new trades may carry higher risk. staying out
Stop-Loss Placement: The histogram assists in identifying optimal stop-loss levels, providing visual cues for setting them just beyond the recent volatility extremes to protect against market whipsaws.
ADX Trend Strength Layer:
This layer offers a visual representation of the trend's strength. A rising ADX above the 25 level with a slope on the MACD line indicates a strong trend and defining directionality to trade (long if it close blue or short if its close rose), reinforcing the confidence in following the trend.
Usage & Importance:
While the CULTURATRADING STRATEGY provides a robust framework for trade execution, the CULTURATRADING INDICATOR is crucial for visualizing and confirming the signals it generates. It simplifies the complex interplay of various technical signals into a coherent visual format, aiding traders in making informed decisions.
The combination of RSI, MA RSI, and the volatility histogram offers a tri-layered approach to market analysis, enabling traders to discern between strong trends, pullbacks, and consolidations.
By integrating these elements, the CULTURATRADING INDICATOR serves as an indispensable tool for traders utilizing the CULTURATRADING STRATEGY, providing clarity and enhancing decision-making efficacy.
Disclaimer:
This indicator is designed for educational purposes to provide a visual aid in market analysis. Traders are advised to use it as part of a comprehensive risk-managed strategy. It is not intended as financial advice.
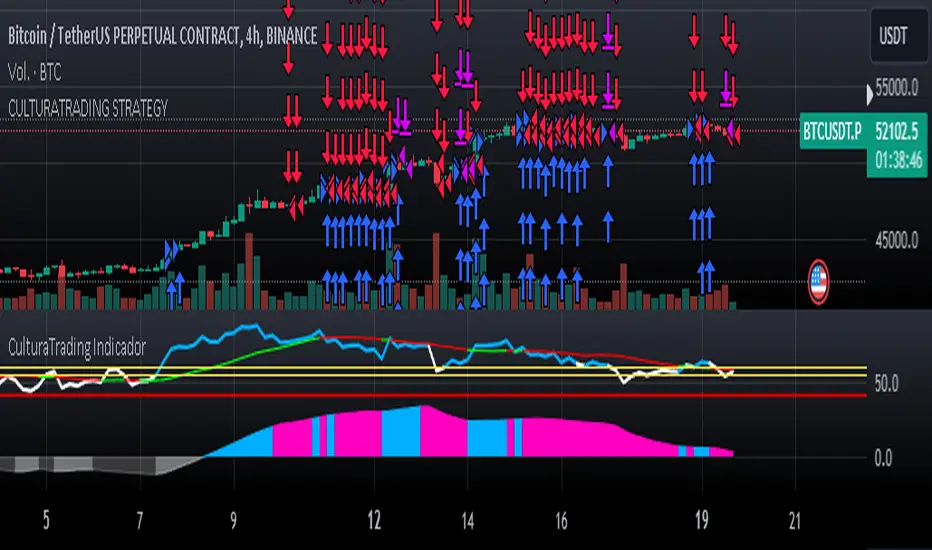
Market Trend Indicator (FinnoVent)The Market Trend Indicator (FinnoVent) is a comprehensive trading tool designed to provide clear visual cues for market trends on TradingView charts. This indicator combines the principles of Exponential Moving Averages (EMAs), Bollinger Bands, the Average Directional Index (ADX), and the Relative Strength Index (RSI) to offer a nuanced view of market movements.
How It Works:
Trend Identification with EMAs: The indicator uses two EMAs (3-period and 30-period) to identify the primary trend. An upward trend is signaled when the 3-period EMA crosses above the 30-period EMA, while a downward trend is indicated when the 3-period EMA crosses below the 30-period EMA.
Sideways Market Detection: To identify sideways trends, the indicator employs Bollinger Bands, ADX, and RSI. A sideways (or consolidating) market condition is identified when:
The price is between the middle 60% of the Bollinger Bands (avoiding the top and bottom 20%).
The ADX is below 30, indicating a lack of a strong trend.
The RSI is between 40 and 60, suggesting a neutral market momentum.
Visual Representation:
Bar Colors: The indicator colors the price bars on the chart based on the identified trend:
Green Bars: Indicate an upward trend.
Red Bars: Indicate a downward trend.
Grey Bars: Indicate a sideways or consolidating market.
How to Use:
Trend Following: Use the colored bars as a guide for trend following. Green bars suggest a potential entry for a long position, while red bars may indicate opportunities for short positions.
Sideways Market Caution: Grey bars signal a sideways market. In such conditions, traders might exercise caution and avoid trend-following strategies, as the market lacks a clear direction.
Complementary Analysis: While the Market Trend Indicator (FinnoVent) provides valuable insights, it's recommended to use it in conjunction with other forms of analysis (like fundamental analysis, other technical indicators, or price action) for comprehensive decision-making.
Suitable for: This indicator is versatile and can be applied to various timeframes and trading instruments, including stocks, forex, commodities, and indices.
Important Notes:
The indicator is designed to minimize repainting but always consider the latest data for the most accurate analysis.
Like all indicators, it is not foolproof. It works best when combined with a solid trading plan and risk management strategies.