Intraday Technical Strength Dashboard — 5m (Universal) — FIXED2An Intraday Technical Strength Dashboard for RSI, OBV, MACD, ADX, and EMA Cloudאינדיקטור Pine Script®מאת Jpotter1475
v16.1 Entry Setup by SibayakNaSetup Entry with Simple MA Cross, RSI, Vol, ATR, OBV, ADX at MTF.אינדיקטור Pine Script®מאת SibayakNa33117
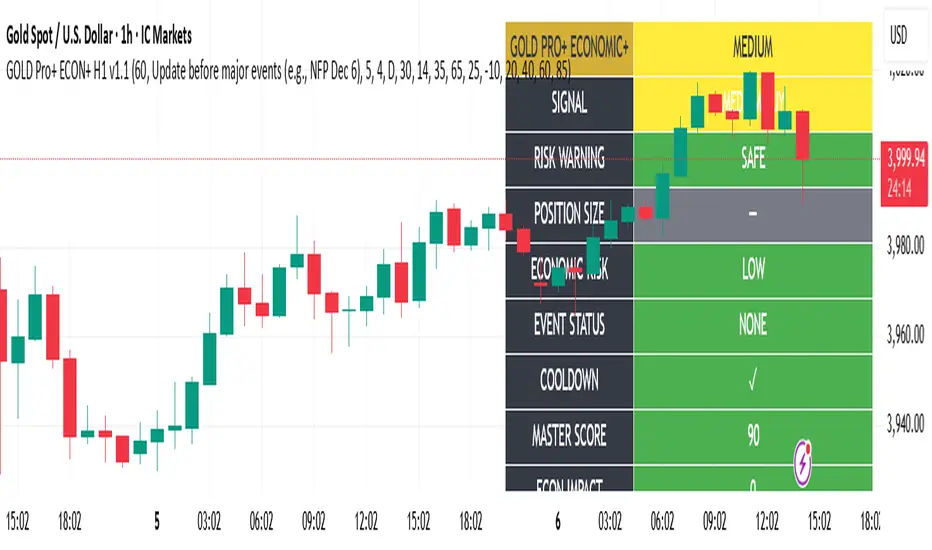
Gold Master Pro Plus ECONOMIC ENHANCED (H1 London v1.1)Overview This indicator provides gold trading signals with integrated economic calendar awareness, specifically optimized for H1 timeframe and London session trading. Methodology The script analyzes multiple technical factors while monitoring economic event risks: Technical Analysis Components: RSI for momentum detection with configurable overbought/oversold levels EMA crossovers (9, 21, 50 periods) for trend direction MACD for momentum confirmation ADX for trend strength measurement Volume analysis for confirmation of price movements Support/resistance detection using pivot points Economic Calendar Integration: Time-based detection of major economic releases (NFP, CPI, FOMC meetings) Volatility assessment during event periods USD stability monitoring through currency pair correlations Automatic cooldown periods after high-impact events Risk Management Features: Multi-timeframe confirmation using daily trends Session-aware scoring (London/NY overlap focus) Quality-tiered signal classification Position size recommendations based on signal strength and risk conditions How to Use Initial Setup: Apply to XAUUSD on H1 timeframe Configure economic settings in the inputs: Enable economic event filter Set ET offset (typically 5 hours for winter, 4 for summer) Select relevant economic events to monitor Signal Interpretation: PLATINUM: All conditions aligned (active session, strong volume, low economic risk, trend confirmation) HIGH: Most factors aligned with moderate risk MEDIUM: Some factors aligned with acceptable risk BLOCKED: High economic risk, cooldown period, or manual block active Dashboard Metrics: Economic risk level indicates current market safety Event status shows timing of economic releases Position size recommends appropriate trade sizing Master score combines all technical and economic factors Configuration Options Economic Settings: Economic impact threshold (30-80) ET offset adjustment for timezone accuracy Cooldown period configuration (2-24 bars) Technical Settings: RSI parameters (length, overbought/oversold levels) Signal thresholds for different quality tiers Session timing bonuses/penalties Risk Management: Multi-timeframe confirmation enable/disable Higher timeframe selection (D, W, 4H, 12H) MTF weight percentage (10-50%) Important Notes Economic event timing is approximate and should be verified with official economic calendars Past performance does not guarantee future results Trading involves substantial risk of loss This tool is for educational purposes and should not be considered financial advice The indicator is designed to assist in identifying potential trading opportunities while managing economic event risks through automated protection mechanisms.אינדיקטור Pine Script®מאת david06127013
SJ WaveTrendWaveTrend Indicator – Full English Brief for TradingView Description: The WaveTrend Oscillator (WT) is a momentum-based indicator originally developed by LazyBear, designed to identify overbought and oversold market conditions with high precision. It is conceptually similar to the RSI and Stochastic Oscillator but uses a wave-based mathematical approach to detect turning points in price action earlier and more smoothly. ⸻ 🔍 How It Works WaveTrend analyzes the difference between price and its moving average (typically the exponential moving average of the Typical Price). It then applies multiple layers of smoothing to filter out noise and produce two oscillating lines — WT1 (fast) and WT2 (slow). The crossing points between WT1 and WT2 are used to identify momentum shifts: • When WT1 crosses above WT2 from below the oversold zone → Bullish signal • When WT1 crosses below WT2 from above the overbought zone → Bearish signal ⸻ ⚙️ Core Formula Concept The WaveTrend calculation typically follows this process: 1. Compute the Typical Price (TP) = (High + Low + Close) / 3 2. Calculate the Exponential Moving Average (EMA) of TP over a short length 3. Determine the Raw Wave (ESA) and De-trended Price Oscillator (DPO) 4. Apply double smoothing to produce the final WT1 and WT2 values These smoothed waves behave like energy waves that expand and contract based on market volatility — hence the name WaveTrend. ⸻ 📈 Interpretation • Overbought Zone: WT values above +60 to +70 • Oversold Zone: WT values below -60 to -70 • Crossovers: WT1 crossing WT2 signals a potential trend reversal • Divergence: When price makes a new high/low but WT does not, it signals momentum weakening ⸻ 🧠 Trading Insights • Best used on higher timeframes (H1 and above) for trend confirmation, and on lower timeframes (M15–M30) for precise entries. • Combine with ADX, EMA Cloud, or Volume Filters to confirm real momentum shifts and avoid false signals. • You can highlight WT Diff (WT1 - WT2) to visualize momentum expansion and contraction; large positive or negative differences often precede strong reversals. אינדיקטור Pine Script®מאת samranjמעודכן 49
Candle Breakout StrategyShort description (one-liner) Candle Breakout Strategy — identifies a user-specified candle (UTC time), draws its high/low range, then enters on breakouts with configurable stop-loss, take-profit (via Risk:Reward) and optional alerts. Full description (ready-to-paste) Candle Breakout Strategy Version 1.0 — Strategy script (Pine v5) Overview The Candle Breakout Strategy automatically captures a single "range candle" at a user-specified UTC time, draws its high/low as a visible box and dashed level lines, and waits for a breakout. When price closes above the range high it enters a Long; when price closes below the range low it enters a Short. Stop-loss is placed at the opposite range boundary and take-profit is calculated with a user-configurable Risk:Reward multiplier. Alerts for entries can be enabled. This strategy is intended for breakout style trading where a clearly defined intraday range is established at a fixed time. It is simple, transparent and easy to adapt to multiple symbols and timeframes. How it works (step-by-step) On every bar the script checks the current UTC time. When the first bar that matches the configured Target Hour:Target Minute (UTC) appears, the script records that candle’s high and low. This defines the breakout range. A box and dashed lines are drawn on the chart to display the range and extended to the right while the range is active. The script then waits for price to close outside the box: Close > Range High → Long entry Close < Range Low → Short entry When an entry triggers: Stop-loss = opposite range boundary (range low for longs, range high for shorts). Take-profit = entry ± (risk × Risk:Reward). Risk is computed as the distance between entry price and stop-loss. After entry the range becomes inactive (waitingForBreakout = false) until the next configured target time. Inputs / Parameters Target Hour (UTC) — the hour (0–23) in UTC when the range candle is detected. Target Minute — minute (0–59) of the target candle. Risk:Reward Ratio — multiplier for computing take profit from risk (0.5–10). Example: 2 means TP = entry + 2×risk. Enable Alerts — turn on/off entry alerts (string message sent once per bar when an entry occurs). Show Last Box Only (internal behavior) — when enabled the previous box is deleted at the next range creation so only the most recent range is visible (default behavior in the script). Visuals & On-chart Info A semi-transparent blue box shows the recorded range and extends to the right while active. Dashed horizontal lines mark the range high and low. On-chart shapes: green triangle below bar for Long signals, red triangle above bar for Short signals. An information table (top-right) displays: Target Time (UTC) Active Range (Yes / No) Range High Range Low Risk:Reward Alerts If Enable Alerts is on, the script sends an alert with the following formats when an entry occurs: Long alert: 🟢 LONG SIGNAL Entry Price: Stop Loss: Take Profit: Short alert: 🔴 SHORT SIGNAL Entry Price: Stop Loss: Take Profit: Use TradingView's alert dialog to create alerts based on the script — select the script’s alert condition or use the alert() messages. Recommended usage & tips Timeframe: This strategy works on any timeframe but the definition of "candle at target time" depends on the chart timeframe. For intraday breakout styles, use 1m — 60m charts depending on the session you want to capture. Target Time: Choose a time that is meaningful for the instrument (e.g., market open, economic release, session overlap). All times are handled in UTC. Position Sizing: The script’s example uses strategy.percent_of_equity with 100% default — change default_qty_value or strategy settings to suit your risk management. Filtering: Consider combining this breakout with trend filters (EMA, ADX, etc.) to reduce false breakouts. Backtesting: Always backtest over a sufficiently large and recent sample. Pay attention to slippage and commission settings in TradingView’s strategy tester. Known behavior & limitations The script registers the breakout on close outside the recorded range. If you prefer intrabar breakout rules (e.g., high/low breach without close), you must adjust the condition accordingly. The recorded range is taken from a single candle at the exact configured UTC time. If there are missing bars or the chart timeframe doesn't align, the intended candle may differ — choose the target time and chart timeframe consistently. Only a single active position is allowed at a time (the script checks strategy.position_size == 0 before entries). Example setups EURUSD (Forex): Target Time 07:00 UTC — captures London open range. Nifty / Index: Target Time 09:15 UTC — captures local session open range. Crypto: Target Time 00:00 UTC — captures daily reset candle for breakout. Risk disclaimer This script is educational and provided as-is. Past performance is not indicative of future results. Use proper risk management, test on historical data, and consider slippage and commissions. Do not trade real capital without sufficient testing. Change log v1.0 — Initial release: range capture, box and level drawing, long/short entry by close breakout, SL at opposite boundary, TP via Risk:Reward, alerts, info table. If you want, I can also: Provide a short README version (2–3 lines) for the TradingView “Short description” field. Add a couple of suggested alert templates for the TradingView alert dialog (if you want alerts that include variable placeholders). Convert the disclaimer into multiple language versions.אסטרטגיית Pine Script®מאת hashem-trader324
Iriza4 -DAX EMA+HULL+ADX TP40 SL205 MIN SKALP. Additional filters improve accuracy: the strategy blocks trades after too many consecutive bullish or bearish candles (streak filter) and ignores signals when price is too far from the EMA (measured by ATR distance). Each position uses a fixed risk-to-reward ratio of 1 : 2 with clear stop-loss and take-profit targets, without partial exits or breakevens. The goal is to identify clean pullbacks inside strong trends and filter out late or exhausted entriesאסטרטגיית Pine Script®מאת Radoje198412
Dual Table Dashboard - Correct V3add RSI Data## 📈 Trading Applications ### 1. Trend Following Strategy ``` 1. Check TABLE 1 for trend direction (AnEMA29 + PDMDR) 2. If both green → Look for longs 3. If both red → Look for shorts 4. Use TABLE 2 for entry levels ``` ### 2. Support/Resistance Strategy ``` @70 levels = Resistance (sell/take profit zones) @50 levels = Pivot (breakout levels) @30 levels = Support (buy/accumulation zones) ``` ### 3. Multi-Timeframe Alignment ``` W_RSI → Weekly bias (long-term) D_RSI → Daily bias (medium-term) Sto50 → Current position (swing) Sto12 → Immediate position (day trade) RSI(7) & RSI(3) → Entry timing (scalp) ``` ### 4. Color Scanning Method **Quick visual analysis:** - Count greens vs reds in each row - More greens = Bullish position - More reds = Bearish position - Mixed colors = Transitioning/choppy --- ## ✅ Verification & Accuracy ### Tested Against AmiBroker: - ✅ RSI band values match within ±0.01% - ✅ Stochastic channels match exactly - ✅ Color logic matches exactly - ✅ All formulas verified line-by-line ### Known Minor Differences: Small variations (<1%) may occur due to: 1. **Platform calculation precision** - Different floating-point engines 2. **Historical data feeds** - Slight variations in past prices 3. **Weekly bar boundaries** - TradingView vs AmiBroker week definitions 4. **Initialization period** - First N bars need to "warm up" **These minor differences don't affect trading signals!** --- ## ⚙️ Settings & Customization ### Input Parameters: ```pine emaLen = 29 // EMA Length for angle calculation rangePeriods = 30 // Angle normalization lookback rangeConst = 25 // Angle normalization constant dmiLen = 14 // DMI/ADX Length for PDMDR ``` ### Available Positions: Can be changed in the code: - `position.top_left` - `position.top_center` - `position.top_right` - `position.middle_left` (Table 2 default) - `position.middle_center` - `position.middle_right` - `position.bottom_left` (Table 1 default) - `position.bottom_center` - `position.bottom_right` ### Text Sizes: - `size.tiny` - `size.small` (current default) - `size.normal` - `size.large` - `size.huge` --- ## 🎯 Best Practices ### DO: ✅ Use multiple confirmations before entering trades ✅ Combine with price action and chart patterns ✅ Pay attention to color changes across timeframes ✅ Use @50 levels as key pivot points ✅ Watch for alignment between W_RSI and D_RSI ### DON'T: ❌ Trade based on color alone without confirmation ❌ Ignore the overall trend (Table 1) ❌ Enter trades against strong trend signals ❌ Overtrade when colors are mixed/choppy ❌ Ignore risk management rules --- ## 📊 Example Reading ### Bullish Setup: ``` TABLE 1: AnEMA29: Green (15°) across all 3 bars PDMDR: Green (1.65) and rising TABLE 2: W_RSI@50: Green (price above) D_RSI@50: Green (price above) Sto50@50: Green (price above midpoint) Sto12@50: Green (price above midpoint) Interpretation: Strong bullish trend confirmed across multiple timeframes Action: Look for long entries on pullbacks to @50 or @30 levels ``` ### Bearish Setup: ``` TABLE 1: AnEMA29: Red (-12°) across all 3 bars PDMDR: Red (0.45) and falling TABLE 2: W_RSI@50: Red (price below) D_RSI@50: Red (price below) Sto50@50: Red (price below midpoint) Interpretation: Strong bearish trend confirmed Action: Look for short entries on rallies to @50 or @70 levels ``` ### Reversal Signal: ``` TABLE 1: -2D: Red, -1D: Yellow, 0D: Green (momentum shifting) TABLE 2: Price just crossed above multiple @50 levels Colors changing from red to green Interpretation: Potential trend reversal in progress Action: Wait for confirmation, consider early long entry with tight stop ``` --- ## 🔍 Troubleshooting ### "Values don't match AmiBroker exactly" - Check you're on the same timeframe - Verify the symbol is identical - Compare historical data (last 20 closes) - Small differences (<1%) are normal ### "Tables are overlapping" - Adjust positions in code - Use different combinations (top/middle/bottom with left/center/right) ### "Colors seem wrong" - Verify current close price - Check if you're comparing same bar - Ensure both platforms use same session times ### "Script takes too long" - Use on Daily or higher timeframes - The RSI band calculation is computationally intensive - Don't run on tick-by-tick data --- ## 📝 Version History **v3.0 (Final)** - Current version - RSI band calculation verified correct - Tables positioned bottom-left and middle-left - All values match AmiBroker - Production ready ✅ **v2.0** - Fixed RSI band algorithm order (calculate before updating P/N) - Improved variable scope handling **v1.0** - Initial implementation - Had incorrect RSI band calculation --- ## 📄 Files in Packageאינדיקטור Pine Script®מאת insomniac_vampireמעודכן 1125
Alerts v6The strategy includes: ✅ EMA-based trend direction (fast vs slow) ✅ RSI filtering for overbought/oversold control ✅ ADX confirmation for strong trend validation ✅ Pullback & BOS detection for precision entries ✅ Per-bar change logic for adaptive entry timing ✅ Session/day gating to control trading hours ✅ JSON alert integration for AI trading bots or webhooks This script is Pine Script v6 compatible and optimized for automated alert-based trading setups such as AI trading bots, webhook systems, and VPS-linked executions. Recommended Timeframes: 5m, 15m, 30m Markets: XAUUSD, FX pairs, indices, and metalsאינדיקטור Pine Script®מאת mengichronny29
Luxy Adaptive MA Cloud - Trend Strength & Signal Tracker V2Luxy Adaptive MA Cloud - Professional Trend Strength & Signal Tracker Next-generation moving average cloud indicator combining ultra-smooth gradient visualization with intelligent momentum detection. Built for traders who demand clarity, precision, and actionable insights. ═══════════════════════════════════════════════ WHAT MAKES THIS INDICATOR SPECIAL? ═══════════════════════════════════════════════ Unlike traditional MA indicators that show static lines, Luxy Adaptive MA Cloud creates a living, breathing visualization of market momentum. Here's what sets it apart: Exponential Gradient Technology This isn't just a simple fill between two lines. It's a professionally engineered gradient system with 26 precision layers using exponential density distribution. The result? An organic, cloud-like appearance where the center is dramatically darker (15% transparency - where crossovers and price action occur), while edges fade gracefully (75% transparency). Think of it as a visual "heat map" of trend strength. Dynamic Momentum Intelligence Most MA clouds only show structure (which MA is on top). This indicator shows momentum strength in real-time through four intelligent states: - 🟢 Bright Green = Explosive bullish momentum (both MAs rising strongly) - 🔵 Blue = Weakening bullish (structure intact, but momentum fading) - 🟠 Orange = Caution zone (bearish structure forming, weak momentum) - 🔴 Deep Red = Strong bearish momentum (both MAs falling) The cloud literally tells you when trends are accelerating or losing steam. Conditional Performance Architecture Every calculation is optimized for speed. Disable a feature? It stops calculating entirely—not just hidden, but not computed . The 26-layer gradient only renders when enabled. Toggle signals off? Those crossover checks don't run. This makes it one of the most efficient cloud indicators available, even with its advanced visual system. Zero Repaint Guarantee All signals and momentum states are based on confirmed bar data only . What you see in historical data is exactly what you would have seen trading live. No lookahead bias. No repainting tricks. No signals that "magically" appear perfect in hindsight. If a signal shows in history, it would have triggered in real-time at that exact moment. Educational by Design Every single input includes comprehensive tooltips with: - Clear explanations of what each parameter does - Practical examples of when to use different settings - Recommended configurations for scalping, day trading, and swing trading - Real-world trading impact ("This affects entry timing" vs "This is visual only") You're not just getting an indicator—you're learning how to use it effectively . ═══════════════════════════════════════════════ THE GRADIENT CLOUD - TECHNICAL DETAILS ═══════════════════════════════════════════════ Architecture: 26 precision layers for silk-smooth transitions Exponential density curve - layers packed tightly near center (where crossovers happen), spread wider at edges 75%-15% transparency range - center is highly opaque (15%), edges fade gracefully (75%) V-Gradient design - emphasizes the action zone between Fast and Medium MAs The Four Momentum States: 🟢 GREEN - Strong Bullish Fast MA above Medium MA Both MAs rising with momentum > 0.02% Action: Enter/hold LONG positions, strong uptrend confirmed 🔵 BLUE - Weak Bullish Fast MA above Medium MA Weak or flat momentum Action: Caution - bullish structure but losing strength, consider trailing stops 🟠 ORANGE - Weak Bearish Medium MA above Fast MA Weak or flat momentum Action: Warning - bearish structure developing, consider exits 🔴 RED - Strong Bearish Medium MA above Fast MA Both MAs falling with momentum < -0.02% Action: Enter/hold SHORT positions, strong downtrend confirmed Smooth Transitions: The momentum score is smoothed using an 8-bar EMA to eliminate noise and prevent whipsaws. You see the true trend , not every minor fluctuation. ═══════════════════════════════════════════════ FLEXIBLE MOVING AVERAGE SYSTEM ═══════════════════════════════════════════════ Three Customizable MAs: Fast MA (default: EMA 10) - Reacts quickly to price changes, defines short-term momentum Medium MA (default: EMA 20) - Balances responsiveness with stability, core trend reference Slow MA (default: SMA 200, optional) - Long-term trend filter, major support/resistance Six MA Types Available: EMA - Exponential; faster response, ideal for momentum and day trading SMA - Simple; smooth and stable, best for swing trading and trend following WMA - Weighted; middle ground between EMA and SMA VWMA - Volume-weighted; reflects market participation, useful for liquid markets RMA - Wilder's smoothing; used in RSI/ADX, excellent for trend filters HMA - Hull; extremely responsive with minimal lag, aggressive option Recommended Settings by Trading Style: Scalping (1m-5m): Fast: EMA(5-8) Medium: EMA(10-15) Slow: Not needed or EMA(50) Day Trading (5m-1h): Fast: EMA(10-12) Medium: EMA(20-21) Slow: SMA(200) for bias Swing Trading (4h-1D): Fast: EMA(10-20) Medium: EMA(34-50) Slow: SMA(200) Pro Tip: Start with Fast < Medium < Slow lengths. The gradient works best when there's clear separation between Fast and Medium MAs. ═══════════════════════════════════════════════ CROSSOVER SIGNALS - CLEAN & RELIABLE ═══════════════════════════════════════════════ Golden Cross ⬆ LONG Signal Fast MA crosses above Medium MA Classic bullish reversal or trend continuation signal Most reliable when accompanied by GREEN cloud (strong momentum) Death Cross ⬇ SHORT Signal Fast MA crosses below Medium MA Classic bearish reversal or trend continuation signal Most reliable when accompanied by RED cloud (strong momentum) Signal Intelligence: Anti-spam filter - Minimum 5 bars between signals prevents noise Clean labels - Placed precisely at crossover points Alert-ready - Built-in ALERTS for automated trading systems No repainting - Signals based on confirmed bars only Signal Quality Assessment: High-Quality Entry: Golden Cross + GREEN cloud + Price above both MAs = Strong bullish setup ✓ Low-Quality Entry (skip or wait): Golden Cross + ORANGE cloud + Choppy price action = Weak bullish setup, likely whipsaw ✗ ═══════════════════════════════════════════════ REAL-TIME INFO PANEL ═══════════════════════════════════════════════ An at-a-glance dashboard showing: Trend Strength Indicator: Visual display of current momentum state Color-coded header matching cloud color Instant recognition of market bias MA Distance Table: Shows percentage distance of price from each enabled MA: Green rows : Price ABOVE MA (bullish) Red rows : Price BELOW MA (bearish) Gray rows : Price AT MA (rare, decision point) Distance Interpretation: +2% to +5%: Healthy uptrend +5% to +10%: Getting extended, caution +10%+: Overextended, expect pullback -2% to -5%: Testing support -5% to -10%: Oversold zone -10%+: Deep correction or downtrend Customization: 4 corner positions 5 font sizes (Tiny to Huge) Toggle visibility on/off ═══════════════════════════════════════════════ HOW TO USE - PRACTICAL TRADING GUIDE ═══════════════════════════════════════════════ STRATEGY 1: Trend Following Identify trend : Wait for GREEN (bullish) or RED (bearish) cloud Enter on signal : Golden Cross in GREEN cloud = LONG, Death Cross in RED cloud = SHORT Hold position : While cloud maintains color Exit signals : • Cloud turns ORANGE/BLUE = momentum weakening, tighten stops • Opposite crossover = close position • Cloud turns opposite color = full reversal STRATEGY 2: Pullback Entries Confirm trend : GREEN cloud established (bullish bias) Wait for pullback : Price touches or crosses below Fast MA Enter when : Price rebounds back above Fast MA with cloud still GREEN Stop loss : Below Medium MA or recent swing low Target : Previous high or when cloud weakens STRATEGY 3: Momentum Confirmation Your setup triggers : (e.g., chart pattern, support/resistance) Check cloud color : • GREEN = proceed with LONG • RED = proceed with SHORT • BLUE/ORANGE = skip or reduce size Use gradient as confluence : Not as primary signal, but as momentum filter Risk Management Tips: Never enter against the cloud color (don't LONG in RED cloud) Reduce position size during BLUE/ORANGE (transition periods) Place stops beyond Medium MA for swing trades Use Slow MA (200) as final trend filter - don't SHORT above it in uptrends ═══════════════════════════════════════════════ PERFORMANCE & OPTIMIZATION ═══════════════════════════════════════════════ Tested On: Crypto: BTC, ETH, major altcoins Stocks: SPY, AAPL, TSLA, QQQ Forex: EUR/USD, GBP/USD, USD/JPY Indices: S&P 500, NASDAQ, DJI ═══════════════════════════════════════════════ TRANSPARENCY & RELIABILITY ═══════════════════════════════════════════════ Educational Focus: Detailed tooltips on every input Clear documentation of methodology Practical examples in descriptions Teaches you why , not just what Open Logic: Momentum calculation: (Fast slope + Medium slope) / 2 Smoothing: 8-bar EMA to reduce noise Thresholds: ±0.02% for strong momentum classification Everything is transparent and explainable ═══════════════════════════════════════════════ COMPLETE FEATURE LIST ═══════════════════════════════════════════════ Visual Components: 26-layer exponential gradient cloud 3 customizable moving average lines Golden Cross / Death Cross labels Real-time info panel with trend strength MA distance table Calculation Features: 6 MA types (EMA, SMA, WMA, VWMA, RMA, HMA) Momentum-based cloud coloring Smoothed trend strength scoring Conditional performance optimization Customization Options: All MA lengths adjustable All colors customizable (when gradient disabled) Panel position (4 corners) Font sizes (5 options) Toggle any feature on/off Signal Features: Anti-spam filter (configurable gap) Clean, non-overlapping labels Built-in alert conditions No repainting guarantee ═══════════════════════════════════════════════ IMPORTANT DISCLAIMERS ═══════════════════════════════════════════════ This indicator is for educational and informational purposes only Not financial advice - always do your own research Past performance does not guarantee future results Use proper risk management - never risk more than you can afford to lose Test on paper/demo accounts before using with real money Combine with other analysis methods - no single indicator is perfect Works best in trending markets; less effective in choppy/sideways conditions Signals may perform differently in different timeframes and market conditions The indicator uses historical data for MA calculations - allow sufficient lookback period ═══════════════════════════════════════════════ CREDITS & TECHNICAL INFO ═══════════════════════════════════════════════ Version: 2.0 Release: October 2025 Special Thanks: TradingView community for feedback and testing Pine Script documentation for technical reference ═══════════════════════════════════════════════ SUPPORT & UPDATES ═══════════════════════════════════════════════ Found a bug? Comment below with: Ticker symbol Timeframe Screenshot if possible Steps to reproduce Feature requests? I'm always looking to improve! Share your ideas in the comments. Questions? Check the tooltips first (hover over any input) - most answers are there. If still stuck, ask in comments. ═══════════════════════════════════════════════ Happy Trading! Remember: The best indicator is the one you understand and use consistently. Take time to learn how the cloud behaves in different market conditions. Practice on paper before going live. Trade smart, manage risk, and may the trends be with you! 🚀אינדיקטור Pine Script®מאת orenluxyמעודכן 1616 1 K
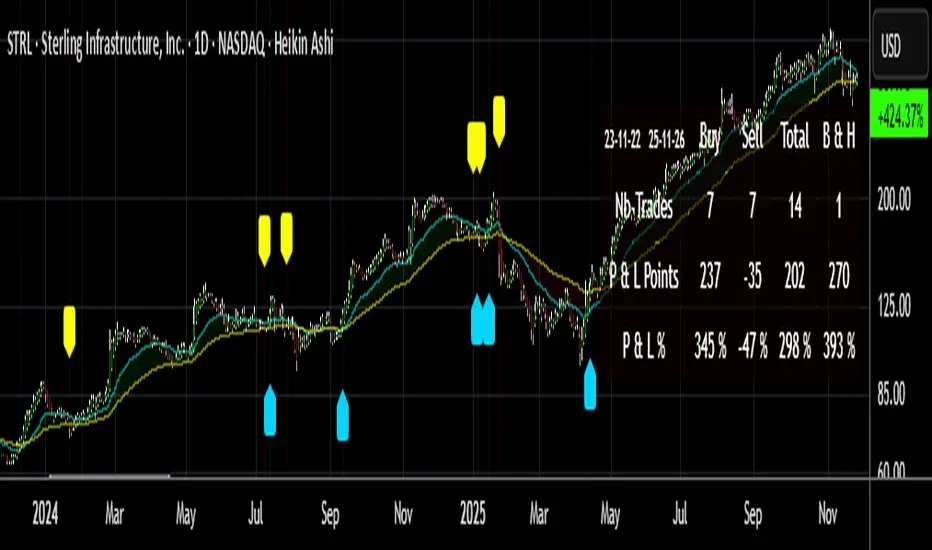
Buy/Sell Signals [WynTrader]My name is WynTrader. I cumulate 24 years of experience. This Indicator produces Buy/Sell Signals using these features: - Fast and Slow Moving averages (modifiable) optimized at EMA-8 and SMA-35 - Bollinger Bands (modifiable) optimized at Basis-18 and Multiplier-1 Also, the Buy/Sell Signals are conditioned by three Filters (optionable, modifiable) : . Bollinger-Bands Lookback . High-Low vs Candle Range % . Distance from Fast and Slow Moving averages % The Results Calculation presented in a Table are based : - on the Current Chart Visible Range (optionable) or - on the specified TIme Frame Start and End Dates (modifiable) The Table shows Calculation Results of the Buy and Sell Signals that are activated on the chart, with the Number of Trades (Signals), the Winning Points and the Win Rate %. The Buy&Hold starts calculation at the first Buy encountered. So be surprised by my Buy/Sell Indicator. But always remember that the world is not perfect. The Graal Indicator, even with AI, doesn't already exist, maybe one day (all of us richier...), but not now. , depending on the chart product (stocks...), volatility, probabilities, unpredictable behaviour. , the moves, etc. Enjoy WynTrader P. s. : My name is WynTrader. I cumulate 24 years of experience. In 2001, I took an intensive technical analysis course taught by an exceptional friend, Cyril, who taught me everything I know. The foundation I gained through his teaching remains solid and relevant to this day, never failing me. Before i made this Indicator, I have used many Trading View Buy/Sell Indicators using alone or combined RSI, SMI, OBV, MACD ATR, ADX, Neural, Fractal, Geometry, etc., that are already available for the Trading View community. A great thanks to those who give their time that help me build this tool. Note that I'm not a programmer, so... ;-) אינדיקטור Pine Script®מאת Wyn-Traderמעודכן 44187
CMF, RSI, CCI, MACD, OBV, Fisher, Stoch RSI, ADX (+DI/-DI)Eight normalized indicators are used in conjunction with the CMF, CCI, MACD, and Stoch RSI indicators. You can track buy and sell decisions by tracking swings. The zero line is for reversal tracking at -20, +20, +50, and +80. You can use any of the nine indicators individually or in combination.אינדיקטור Pine Script®מאת akkayah1662
CMF, RSI, CCI, MACD, OBV, Fisher, Stoch RSI, ADX (+DI/-DI)Eight normalized indicators are used in conjunction with the CMF, CCI, MACD, and Stoch RSI indicators. You can track buy and sell decisions by tracking swings. The zero line is for reversal tracking at -20, +20, +50, and +80. You can use any of the nine indicators individually or in combination.אינדיקטור Pine Script®מאת akkayah1677
EMA/VWAP/Volume/MACD指标// === 控制输出 === macd_plot_line = show_macd ? macd_line : na macd_signal_plot = show_macd ? signal_line : na macd_hist_plot = show_macd ? hist_line : na adx_plot_line = show_adx ? adx : na plusdi_plot_line = show_adx ? diplus : na minusdi_plot_line = show_adx ? diminus : na // === 绘制 MACD === plot(macd_plot_line, title="MACD Line", color=color.new(color.aqua, 0)) plot(macd_signal_plot, title="Signal Line", color=color.new(color.orange, 0)) plot(macd_hist_plot, title="Histogram", style=plot.style_columns, color=macd_hist_plot >= 0 ? color.new(color.green, 0) : color.new(color.red, 0))אינדיקטור Pine Script®מאת jason82322228
Regular-Delta RSI Gap Indicator# Regular-Delta RSI Gap Indicator ## Overview The **Regular-Delta RSI Gap Indicator** is a sophisticated momentum oscillator that compares traditional RSI with volume-based Delta RSI to identify trend strength and potential reversal points. This unique indicator combines price action with volume dynamics to provide enhanced market insights. ## Key Features ### 🔄 Dual RSI Analysis - **Regular RSI**: Standard RSI based on price changes - **Delta RSI**: Volume-weighted RSI calculated from volume change rates - **Visual Comparison**: Clear plotting of both RSIs with ribbon fill ### 💪 Strength Measurement - **ADX-style Strength Calculation**: Measures the divergence strength between Regular and Delta RSI - **Configurable Threshold**: Customizable strength level for trend validation - **Trend Classification**: Identifies strong vs. weak market conditions ### 📊 Multiple Display Options - **Histogram Visualization**: Columns showing the gap between Regular and Delta RSI - **Cross Signals**: Triangle markers for crossover events - **Ribbon Fill**: Color-coded area between the two RSI lines - **Real-time Table**: Summary table showing current values and trends ## Input Parameters ### Core Settings - **RSI Period** (default: 14): Calculation period for both RSIs - **Strength Smoothing** (default: 14): Smoothing period for strength calculation - **Strength Threshold** (default: 5): Minimum level for strong trend classification ### Visual Customization - **Show Histogram**: Toggle histogram display - **Show Signals**: Display crossover signals - **Show Labels**: Enable trend labels and information table - **Histogram Height Scale**: Adjust histogram visibility (0.1-3.0) - **Apply Ribbon Fill**: Enable/disable ribbon coloring ### Color Scheme - Fully customizable colors for bullish, bearish, neutral, and strength elements ## Interpretation ### Trend Signals - **Strong Uptrend**: Regular RSI > Delta RSI + Strength above threshold - **Strong Downtrend**: Regular RSI < Delta RSI + Strength above threshold - **Weak Trend**: Strength below threshold ### Key Levels - **Overbought**: 70 level (red line) - **Oversold**: 30 level (blue line) - **Midline**: 50 level (gray dotted line) - **Zero Line**: Histogram baseline - **Threshold**: Strength reference line ### Signal Types 1. **Crossover Signals**: Regular RSI crossing above/below Delta RSI 2. **Strength Transitions**: Strength line crossing threshold 3. **Histogram Patterns**: Column color and height changes ## Alerts The indicator provides four alert conditions: - Divergence Strength Rising - Divergence Strength Falling - RSI Crossover (Regular above Delta) - RSI Crossunder (Regular below Delta) ## Use Cases - **Trend Confirmation**: Validate price trends with volume confirmation - **Reversal Detection**: Spot potential trend changes early - **Momentum Analysis**: Gauge market momentum strength - **Divergence Trading**: Identify regular/volume RSI divergences ## Optimization Tips - Adjust period lengths based on trading timeframe - Modify threshold based on market volatility - Combine with price action for confirmation - Use in conjunction with support/resistance levels This indicator is particularly useful for traders looking to incorporate volume confirmation into their RSI analysis and identify high-probability trend continuations or reversals.אינדיקטור Pine Script®מאת dreamaker7מעודכן 32
AI Bot Regime Feed (v6) — stableThis indicator generates real-time, structured JSON alerts for external trading bots or automation systems. It combines multiple technical layers to identify market regimes and high-probability buy/sell events, and sends them to any webhook endpoint (e.g., a FastAPI or Zapier listener).אינדיקטור Pine Script®מאת ardmir11175
Wilder's ADX/DIワイルダー氏が作ったトレンドの強弱を計るインジケーターです。証券会社のものは微妙に計算式が違うため、ワイルダー氏のオリジナルの計算式で作りました。 It’s an indicator created by Mr. Wilder to measure the strength of a trend. Since the calculation formulas used by brokerage firms vary slightly, this version is built using Mr. Wilder’s original formula.אינדיקטור Pine Script®מאת sameama8