HFT Divergence Hunter IndicatorDefault Settings are meant to be used in BTC/USDT chart on 5 min time frame on Binance Futures. If you want to use for another asset on another time frame YOU MUST CHANGE THE SETTINGS
This is a divergence finding indicator developed by HFT Research. It is a highly customizable indicator and provides endless opportunities to find profitable trades in the market.
Use Envelope, this is the main decision maker in this strategy. The idea behind is that you choose the length of the moving average and set an offset % to create an upper and lower band. If you click on “display envelope” you will be able to visually see the band you have created. This way, you get to scalp the market as the price is diverging and moving away from the moving average. As the famous saying goes, moving averages act like magnets and prices always visits them back. Using this ideology, we aim to capitilize on the price swings that move away from the chosen moving average by x%.
STARC Bands;
These are two bands that are applied above and below a simple moving average of an asset’s price. The upper band is created by adding the value of the average true range (ATR) or a multiple of i. The lower band is created by subtracting the value of the ATR from the SMA. The channel can provide traders with ideas on when to buy or sell. During an overall uptrend, buying near the lower band and selling near the top band is favorable. However, from our testing results it does fairly poorly in crypto markets while it does pretty well in traditional markets.
Use RSI;
One of the most commonly used indicators in the trading world. The idea is simple, buy when its oversold and sell when its overbought. You can use RSI as a secondary confirmation of the dips. It can be turned on and off.
Use MFI
MFI stands for Money Flow Index and it is an oscillator like RSI. However, it does track the price in a different fashion than RSI providing a reliable option. It uses the price and volume data for identifying overbought and oversold signals in an asset.
Use Fisher Transform
Even though, it has a funny name, Fisher is actually a very decent and reliable indicator. It converts the prices into a Gaussian normal distribution channel. Therefore, the indicator detects when the prices have moved to an extreme, based on recent price action.
Use VWAP
VWAP stands for volume weighted average price. It is an extremely useful indicator when trading intra-day. It does reset every trading session which is at 00:00 UTC. Instead of looking at x number of candles and providing an average price, it will take into consideration the volume that’s traded at a certain price and weigh it accordingly. It will NOT give entry signals but act as a filter. If the price is above VWAP will filter out the shorts and other way around for longs.
Use ADX
Average directional index is a powerful indicator when one is assessing the strength of a trend as well as measuring the volatility in the market. Unfortunately, the worst market condition for this strategy is sideways market. ADX becomes a useful tool since it can detect trend. If the volatility is low and there is no real price movement, ADX will pick that up and will not let you get in trades during a sideways market. It will allow you to enter trades only when the market is trending.
Use Super trend Filter
The indicator works well in a trending market but can give false signals when a market is trading in a range.
It uses the ATR (average true range) as part of its calculation which takes into account the volatility of the market. The ATR is adjusted using the multiplier setting which determines how sensitive the indicator is.
Use MA Filter
Lookback: It is an option to look back x number of candles to validate the price crossing. If the market is choppy and the price keeps crossing up and down the moving average you have chosen, it will generate a lot of “noisy” signals. This option allows you to confirm the cross by selecting how many candles the price needs to stay above or below the moving average. Setting it 0 will turn it off.
MA Filter Type: There is a selection of moving averages that is available on TradingView currently. You can choose from 14 different moving average types to detect the trend as accurate as possible.
Filter Length: You can select the length of your moving average. Most commonly used length being 50,100 and 200.
Filter Type: This is our propriety smoothing method in order to make the moving averages lag less and influence the way they are calculated slightly. Type 1 being the normal calculation and type 2 being the secret sauce.
Reverse MA Filter: This option allows you to use the moving average in reverse. For example, the strategy will go long when the price is above the moving average. However, if you use the reserve MA Filter, you will go short when the price is above the moving average. This method works best in sideways market where price usually retraces back to the moving average. So, in an anticipation of price reverting back to the moving average, it is a useful piece of option to use during sideway markets.
Use MACD Filter
MACD here will act as a filter rather than an entry signal generator. There are a few different ways to use this MACD filter. You can click on the Use MACD filter and it will use filter out the shorts generated in a bullish territory and longs generated in the bearish territory. It will greatly reduce the number of trades the strategy will trade because MACD is a lagging indicator. By the time MACD turns bullish or bearish, most of the other indicators will have already generated the signals. Therefore, resulting in less trades. You can use MACD filter as MA oscillator meaning that it will only look at the MA lines in MACD to filter out trades. Alternatively, you can use it with the histogram (Signal lines) meaning that it will only look at the histogram whether its below or above the zero line in order to filter out the trades.
TP (%)
Place your desired take profit percentage here. Default is 1.5%
Move SL At Entry x% Profit
This is when the strategy will move your SL to the entry point if the position reaches x% profit. It can also generate a signal which can be automated to adjust the SL on the exchange.
SL (%)
Place your desired stop loss percentage here. Default is 1%
If you want to get access to this indicator please DM me or visit our website.
חפש סקריפטים עבור "adx"

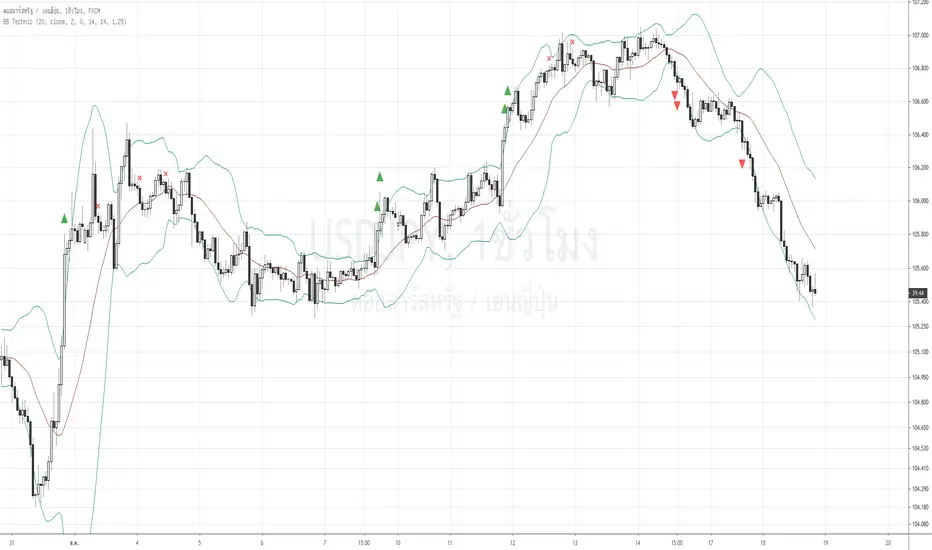
Bollinger Bands Technic + AlertReferred to the book "Bollinger on Bollinger Bands"
The best use of BB is to wait for squezze and breakout to capture the start of the trend.
Here the signal and target profit.
1. Long Signal when the close crosses above the upper BB and the Bandwidth of current bar exceeds 1.25 times of the previous bar (Volatility expands). : Green Triangle Up
2. Short Signal when the close crosses down the lower BB and the the Bandwidth of current bar exceeds 1.25 times of the previous bar (Volatility expands). : Red Triangle Down
3, Long TP when the upper BB turns down. : X cross Red
4. Short TP when the lower BB turns up. : X cross Purple
You can adjust any input of BB as well as how many times bandwidth changes from previous period.
I filter out the to high to buy signal by using ADX, if ADX over 50, the buy signal will be omitted.
As well as the TP signal , If the ADX is to low <35 , meaning it's has more room to go. the TP signal to be omitted.
Anyway , user can adjust all of this sensitivity.
As this is the trend following indicator, you will experience the bad signal during the sideways. That's life.
This is the semi discretionary system. You can use as a guideline along side with your other methods and money management.
Thank you!
Tanakorn Koomrampai CMT, CFTe
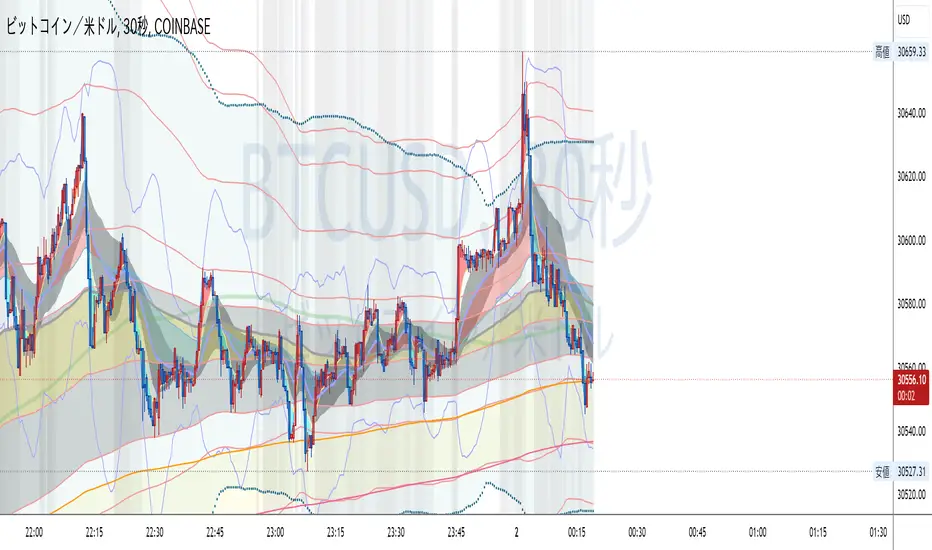
LIZ TIME DIMENSIONEach hourly foot can display the moving average line for the same period of time in the same color.
The average moving line that you want to see is displayed by time leg, as well as the long-term Bollinger band that should be noticed by the time leg.
1. You can get a lot of useful information at a glance by displaying the moving average line of the long-term and period setting that many traders are aware of.
○ The period setting of the moving average line displayed in each time and foot is not fixed as usual, but changed the period by time and foot, and the moving average line of the same color
is the same.
It is a moving average line of time (for example, an hourly average line and a four-hour average line).Therefore, the market price is always the same even if the time to see changes
You can see it on a scale.It doesn't happen when you look at it in five minutes, but when you look at it in four hours, it looks like a downward trend.
○ The sensitivity of the rate to the moving average line displayed is very high.
You can see how rate moves, such as trends, are determined, and you can see reality in abstract chart moves
I can feel it.Purple 24 hours (one day) moving average line with 1 minute to 4 hours of foot, Green 1 week moving average line with 5 minute to day.
The sensitivity to the Blue Monthly Movement Average Line, which is displayed from 5 mins to 5 weeks, and Red One Year Movement Average Line, which is displayed from 1 hour to 5 weeks,
is very high.
Just look at whether the rates are moving up or down the moving average line and you'll be able to decide what to look for.
○ What is the positional relation between the moving average line of seven (eight in addition to the weekly moving average line) in the short, short, medium, medium, long, and long periods?
To make the direction and intensity of the trend easier to recognize, it is colored between moving averages to be visible as short- and medium-term clouds.
The three clouds changed color to warm rising clouds and cold falling clouds, depending on the relation of the moving averages.
·Strong upward trend rates when all clouds are unified in either upward or downward direction and are arranged in the order of short-term, medium-term or long-term clouds
·The thickness of the clouds is strong, and when the thickness is increased, the trend rate is strong.
·Trendless market when clouds overlap or the colors of the clouds are mixed
• Range price when rates are moving back and forth between clouds
You can visually and intuitively understand the market conditions, such as .
○ Short-term, short-term, medium- and short-term positional relationships will indicate the timing of the entry payment and the direction of the long-short.It's also written.
In conjunction with this, the duration for which the background color should be long changes to light warm color and warm color, and the duration for short changes to light cold and cold
color.
2. The long-term Bollinger band is displayed so that you can trade with the higher time base than the time base you see.
○ You can ride on a long-term trend by detecting and entering the trend occurrence of long-term feet with short-term feet.
Buy high prices, sell low prices, relax your trend-follow-style tears, and enable stress-free entries.
○ A light, transparent gray filter is displayed between the long-term foot Bollinger band ±1σ which sets the period suitable for the time and foot.
I understand that while the rate is moving in this zone (called gray zone), it is difficult to trend and the price range is small, so it should not be taken care of.
Yes, you can use this filter to prevent deception when the volatility is not present, and if you are out of the filter, you can use the above sign.
By trading in accordance, you can invest in trend-follow tiles while avoiding losses in range markets.
○ Bollinger bands generally display six of ±1σ, ±2σ and ±3σ, but in this indicator, two are inside ±1σ and two are outside ±3σ.
We have added a total of four bands.The former sets up early entries and the latter sets up new reverse positions, expecting a market shift from overheating.
for tips on how to
○ Expansion period (expansion period) due to characteristics of the Bollinger band is a period when volatility is big for trade, and a squeeze period
(Shrinking period) I understand that the volatility is small and it is not suitable for trade.Also, it's a squeeze period, but it's not
You can seize investment opportunities by making you expect the timing to move from contraction to expansion and by watching.
※Valid time difference by series
1 minute, 5 minutes, 15 minutes, 30 minutes 1 Hour, 4 Hour, Daily, Week (Total 8 Hours)
。This is the top version of the Makenai Chart indicator.
。Bolinger band ±3σ with 200 SMA and 200 SMA as the center band is now displayed in common on each hour leg.
。Changing the setting of the foot short-term moving average line for 5 minutes 15 minutes 30 minutes 1 hour to make the short-term cloud easily twisted and to speed up the trading timing.
。Adding ultra short term and short term clouds, which are much shorter than short term clouds, we responded to the requests of traders who want to deal with the roller coaster market and
cut the profit quickly.
(Select short-term clouds, short-term clouds, and ultra-short-term clouds to be used for entry and settlement according to the trade style and the 'dissociation between price and moving average'
which varies depending on the brand, time, and market value.)
。According to the calculation of another indicator (LIZ ADX+DMI), the background has become gray synchronously for a period of inactivity and non-trading.
(In such a period, it is often difficult to follow the trend because the market price is difficult even for lower-level ones, and often it is difficult to follow the trend.)
·Many indicators are counted in one, so you can also view the free version of your account, which has three indicators to display.
If you are interested in the invitation-only indicator, please contact us on private chat.
各時間足で同じ期間の移動平均線が同じ色で表示できます。
時間足によって見たい複数の移動平均線が表示される他、その時間足で意識すべき期間設定された長期ボリンジャーバンドも表示されます。
1.長期間でかつ多くのトレーダーが意識する期間設定の移動平均線が表示される事で
以下の有益な情報を一目で得る事ができます。
○各時間足に表示される移動平均線の期間設定は、通常のように期間を一定にするの ではなく、期間を時間足毎に変え同色の移動平均線は同じ時間の移動平均線
(例えば1時間平均線、4時間平均線というように。)としてあります。
このため、見る時間足が変わっても、相場を常に同じ尺度で眺める事ができます。
「5分足では上昇トレンドに、4時間足では下落トレンドに見える。」
という事が起こりません。
○表示される移動平均線に対するレートの感応度は非常に高く、移動平均線にレ-ト
が差し掛かると抵抗を受け反発したり移動平均線を抜けると、勢いよくトレンドが
発生するなど、レートの動きがどのようにして決まっているかを実感でき、抽象的
だったチャートの動きにリアリティーを感じる事ができます。
特に1分足から4時間足まで表示される紫24時間(1日)移動平均線、5分足から
日足まで表示される緑1週間移動平均線、5分足から週足まで表示される青1ヶ月
移動平均線、1時間足から週足まで表示される赤1年移動平均線に対する感応度は
非常に高く、それぞれの移動平均線の上下どちらでレートが推移しているかを見る
だけで、買い目線売り目線の決定ができます。
○短々期、短期、中短期、中期、中長期、長期、長々期の7本
(週足だけはそれに加え最長期の8本)の移動平均線がどのような位置関係にあるか
によってトレンドの方向と強さが認識しやすいよう移動平均線間に着色し短期雲、
中期雲として意識できるようになっています。
3つの雲は移動平均線の関係によりそれぞれ暖色の上昇雲、寒色の下落雲に色が変わり、
・全ての雲が上昇下落どちらかに統一されで短期雲、中期雲、長期雲という順に並
んでいる時は強い上昇トレンド相場
・雲の傾きがきつく厚みがしっかりしている、厚みが増している時は強いトレンド相場
・雲が重なったり、各雲の色がまちまちの時はトレンドレス相場
・雲と雲の間をレートが行ったり来たりしている時はレンジ相場
など、視覚的直感的に相場の状況が理解できます。
表示が可能な時間足は1分、5分、15分 30分、60分、4時間、1日、1週間(合計8つ)です。
※Makenai Chart Indicator の上位版です。
・200SMA,200SMAを中心バンドとするボリンジャーバンド±3σが各時間足に共通で表示されるようになりました。
・5分15分30分1時間足短期移動平均線の設定を変更し、短期雲がねじれやすくし、決済タイミングを早めました。
・短期雲よりさらに短い、超短期雲・短々期雲を追加し、ジェットコースター相場への対応、早めに利確・損切りしたいトレーダーの要望に対応しました。
(トレードスタイルに応じ、また銘柄・時間足・相場つきによって変わる『価格と移動平均線との解離』に応じ、エントリー・決済に使う短期雲・短々期雲・超短期雲を選択します。)
・別のインジケーター(LIZ ADX+DMI)の計算による、ボラティティーがなくトレードに向かない期間は、同期して背景がグレーになるようになりました。
(LIZ ADX+DMIの詳細はこちらのリンクからご覧になれます。https://jp.tradingview.com/script/AUWqluGM/)
(そのような期間は下位足でも難しい相場つき、レンジやランダム相場になっている事が多いため、トレンドフォローが難しい可能性が高いです。)
・たくさんのインジケーターが1つにカウントされるため、表示できるインジケーター3つの制限がある、無料版のアカウントをお使いの方も表示できます
招待専用インジに興味ある方はプライベートチャットに連絡をください。
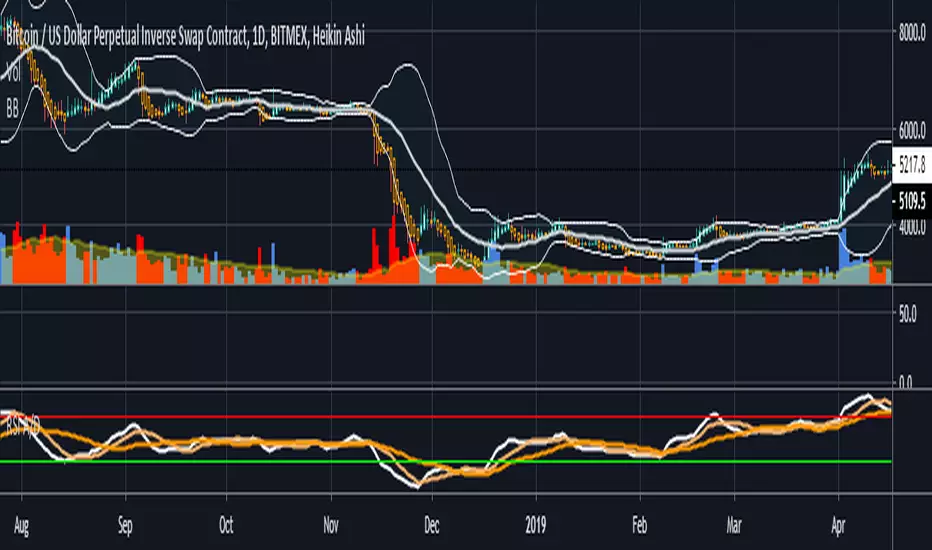
RSI and A/D StrengthThis is an edit of Chris Moody's EMA of RSI script see the original here:
The edited version has an accumulation distribution line as well as well as two SMAs
If you want a detailed look at how I use ADX and DI along with it to enter/exit please see the following video and article
youtu.be
bitcointradingtoday.com
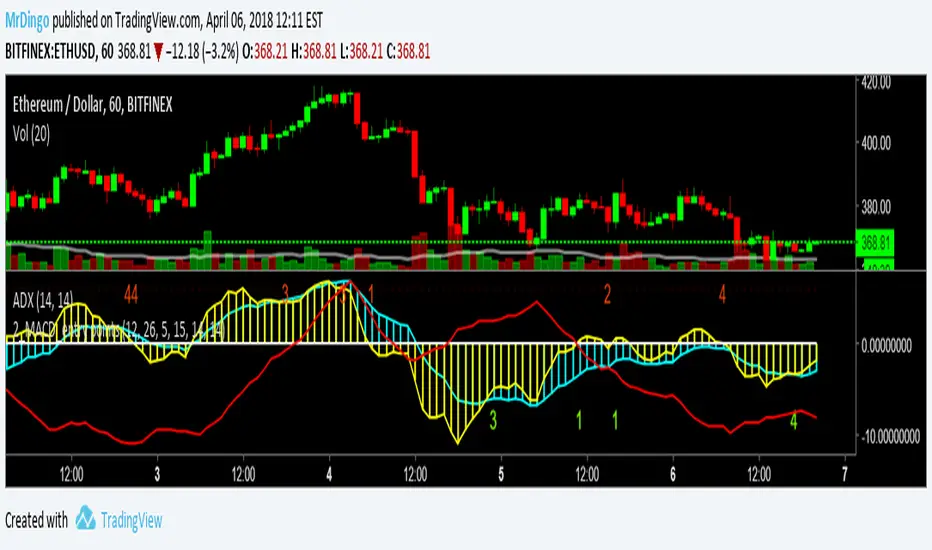
Dingo_2_MACD with entry pointsUsing 2 MACD with different settings and ADX for determining if is trending or ranging.
ADX below 20 >> ranging
ADX above 23 >> trending
Since the systems use 2 MACD crossing, I removed signal line and histogram.
What you see as a histogram it's actually MACD value plotted histo style.
Please comment if you think it can be improved.
Enjoy!
Thank you!
SS Critical Advanced Swing Trading Decision Matrix
📊 How to Use the SS Critical Advanced Swing Trading Decision Matrix Indicator
Installation & Setup
Adding to TradingView
Open TradingView and Click "Add to Chart"
The indicator will load with the dashboard on your selected position
Recommended Timeframes
Daily charts: Primary timeframe for swing trading signals
4-hour charts: For fine-tuning entry/exit points
Weekly charts: For confirming long-term trends
Interpreting the Decision Matrix Scores
Final Score Ranges
Component Breakdown
Trend (25%): MA alignment + SuperTrend direction + ADX strength
Momentum (30%): RSI + MACD + Stochastic + ROC + MFI
Volume (20%): Volume surge + MFI confirmation
Volatility (15%): Bollinger Bands position + ATR
Oscillators (10%): CCI + Williams %R + ADX
Trading Signals
BUY Signal
Triggers when Final Score crosses above 65
Confirms bullish momentum building
Enter within 1-2 bars of signal for best results
SELL Signal
Triggers when Final Score drops below 35
Indicates bearish pressure intensifying
Exit or consider shorting opportunities
Signal Quality Validation
Check Previous Close score for trend confirmation
Higher previous score = stronger continuation
Diverging scores = potential reversal or consolidation
Customisation for Your Strategy
Adjusting Signal Weights
Trending Markets: Increase Trend Weight to 30-35%
Volatile Markets: Increase Volatility Weight to 20-25%
Low Volume Stocks: Decrease Volume Weight to 10-15%
High Volume Stocks: Increase Volume Weight to 25-30%
Parameter Optimization
Fast MA (9): For aggressive entries, reduce to 5-7
Slow MA (50/200): For longer holds, keep standard
RSI Length (14): Increase to 21 for smoother signals
Profit Target: Set based on stock volatility (6-7% default)
Best Practices
Entry Strategy
Wait for score ≥ 65 (STRONG or EXCELLENT)
Confirm trend on higher timeframe (weekly)
Check volume is above average
Enter on price pullback or breakout
Exit Strategy
Target: Achieve 6-7% profit within timeframe
Stop-loss: When score drops below 50 (MODERATE)
Trailing stop: Move to breakeven at 3% profit
Risk Management
Never risk more than 2% of capital per trade
Use position sizing based on signal quality:
EXCELLENT: 100% of planned position
STRONG: 75% of planned position
MODERATE: 25% or skip
Avoiding False Signals
Use multiple timeframe confirmation (daily + weekly)
Avoid trading during low volume periods
Check fundamentals for stocks with EXCELLENT scores
Don't overtrade - wait for quality setups
Dashboard Interpretation
Current Bar Section
Shows real-time analysis of ongoing candle
Component scores color-coded (Green/Yellow/Red)
Weighted column shows actual contribution to final score
Previous Close Section
Displays confirmed signal from last closed bar
Use for backtesting and strategy validation
Compare with current to spot trend changes
Alerts Setup
Create alerts for Buy/Sell signals
Set notifications for EXCELLENT quality signals
Combine with price alerts for automated monitoring
Practical Example
EXCELLENT Signal (Score 85)
All 5 components show green (>60 points)
Strong uptrend with high volume
Action: Enter full position, target 6-7% in 5 -15 days
WEAK Signal (Score 40)
Mixed indicators, declining momentum
Action: Avoid new entries, monitor existing positions
Pro Tip: Backtest this indicator on your favorite stocks using historical data before live trading. Adjust weights and parameters based on which components work best for your specific market/timeframe.
© Dr Shantanu Samanta - This indicator combines proven swing trading indicators into a single decision matrix for clearer trade execution.
For Educational purposes only

FMT_TRENDFOLLOWiNGThis indicator is developed based on the Average Directional Index (ADX) , which is used to measure the strength of a trend, regardless of price direction. It has been custom-modified and optimized specifically for the FCPO market, with the following usage structure:
• 30-Minute Timeframe (HTF)
Used to identify the major market movement.
When the ADX value is above 25, it indicates that the market is entering a strong trending phase.
• 5-Minute Timeframe (LTF)
Acts as a confirmation for trend change or continuation, indicated by color changes (Green/Red) and the appearance of a Reconnect Dot when momentum becomes active again.
• 1-Minute Timeframe
Used for Buy or Sell entries at the nearest trading zones, aligned with the trend direction and strength from higher timeframes.
This indicator is suitable for Day Trading and Momentum Trading strategies, especially for FCPO traders who focus on market structure and momentum confirmation.
⚠️ DISCLAIMER: This indicator is provided for educational and technical analysis purposes only and does not constitute financial advice or a trading recommendation. All signals are derived from technical calculations and may produce false signals depending on market conditions. Users are fully responsible for their trading decisions, including risk management and position sizing. Past performance does not guarantee future results, and users are encouraged to conduct paper trading or backtesting before using it in live trading.

Normalized Volume Dynamics [NVD]Concept & Overview
**Normalized Volume Dynamics (NVD)** is a volume analysis indicator designed to reduce time-of-day noise and highlight unusual volume behavior relative to historical conditions.
Most standard volume indicators compare current volume to a rolling average, which can lead to misleading readings during naturally active periods.
**NVD** addresses this by using a time-normalized volume baseline, comparing the current bar’s volume to volume observed at the same intraday bar position across prior sessions, rather than to a generic moving average.
This approach helps distinguish expected activity from statistically abnormal volume.
**Market Suitability**
The time-normalized logic depends on consistent intraday data structure.
**Crypto (24/7 Markets):**
Continuous trading provides consistent intraday alignment, making normalization most reliable.
**Futures:**
Continuous futures contracts with minimal session gaps generally work well.
**Stocks & Forex:**
Session gaps, holidays, and irregular trading hours may introduce minor baseline drift. While the indicator remains functional, continuous markets are preferred for best accuracy.
**How the Indicator Works**
NVD combines three core components:
**1. Time-Normalized Volume Baseline**
Current volume is compared against the average volume of the same intraday bar position over prior sessions.
* Filters out predictable time-based volume patterns
* Highlights volume that exceeds what is historically typical for that point in the session
* Automatically falls back to a smoothed volume average on non-intraday charts or limited history
**2. Efficiency Oscillator (Lower Panel)**
The histogram evaluates the relationship between price movement and volume effort, showing how efficiently price is moving.
Color interpretation:
* **Green Columns:** Buying pressure with high efficiency (Trend is healthy).
* **Red Columns:** Selling pressure with high efficiency.
* **Yellow Columns:** Volume Spike. Abnormal volume detected (2x average) indicating a potential breakout or exhaustion.
* **Grey Columns:** Absorption/Churn. Volume is present but price is not moving significantly. This often happens before a violent move
**3. Informational Flow Signals (Main Chart)**
The indicator can mark candles where unusual volume coincides with price rejection. These markers are informational and require multiple conditions:
* Volume exceeds the selected baseline by a user-defined multiplier
* Price makes a new local high or low but closes back within the candle range, indicating rejection
* Optional Money Flow Index (MFI) filter confirms an overbought or oversold condition
**Dashboard Overview**
An optional dashboard provides a compact summary of the indicator’s internal states for quick reference.
The dashboard displays:
**Trend State (ADX)**
* Uses ADX to classify conditions as **TRENDING** or **RANGING**
* Helps contextualize whether volume behavior is occurring in a directional environment
**Flow Bias**
* Derived from the Efficiency Oscillator and VWAP relationship
* Displays:
**BUYING**
**SELLING**
**ABSORPTION** (low efficiency / churn)
* An arrow indicates whether price is positioned above or below VWAP
**Volume Status**
* Indicates whether current volume qualifies as a high-volume condition relative to the selected baseline
* Matches the logic used for histogram coloring and informational markers
**Multi-Timeframe Support**
* The dashboard can optionally run on a separate timeframe
* Users may choose to sync the histogram with the dashboard timeframe or keep it on the chart timeframe
*Note: The dashboard summarizes internal calculations and does not generate independent trade signals. All values update on confirmed bars.*
**How to Trade: "INFO" Signals**
The chart arrows are labeled **INFO BUY** and **INFO SELL** to emphasize that these are informational warnings of stopping volume, not blind entry signals.
**INFO BUY (Green Arrow):**
* **The Logic:** Sellers pushed price to a low, but massive volume entered to absorb the sell pressure, forcing a close in the upper range. This is a "Bear Trap" or Liquidity Sweep.
* **Usage:** If you are Short, this is a warning to tighten stops. If looking for Longs, wait for price to break the high of the signal candle for confirmation.
**INFO SELL (Red Arrow):**
* **The Logic:** Buyers pushed price to a high, but massive volume entered to block the move, forcing a close in the lower range. This is a "Bull Trap."
* **Usage:** If you are Long, this indicates overhead resistance/supply. If looking for Shorts, wait for price to break the low of the signal candle.
**Features & Settings**
* Time-Normalized or Recent-Average volume calculation modes
* Efficiency histogram with absorption and volume spike detection
* Optional MFI filter for informational signals
* VWAP-based contextual filter
* Dashboard showing trend state, flow bias, and volume status
* Non-repainting alerts triggered on bar close
**Recommended Usage**
* Higher timeframes (5m and above) generally provide clearer structure
* On lower timeframes, increasing the analysis period can help reduce noise
* Designed to be used as a supporting analysis tool, not a standalone system
**Disclaimer**
*This indicator is provided strictly for educational and informational purposes. It does not constitute financial, investment, trading, or other professional advice.*
*All calculations, visualizations, and signals produced by this indicator are derived solely from historical price and volume data. No representation is made that the indicator can predict future market behavior or outcomes. Any interpretations drawn from its output are the sole responsibility of the user.*
*Trading and investing involve substantial risk, including the possible loss of all or more than the initial capital. Market conditions can change rapidly, and past market behavior, patterns, or indicator performance do not guarantee similar results in the future.*
*The informational markers, alerts, dashboard readings, and histogram values generated by this indicator are not trade recommendations and should not be used as the sole basis for making trading decisions. Users are encouraged to combine this tool with their own analysis, risk management, and confirmation methods.*
*The author assumes no responsibility or liability for any trading decisions, losses, or damages resulting directly or indirectly from the use of this indicator. By using this script, you acknowledge that you are solely responsible for your trading decisions and outcomes.*
*Use at your own risk.*

FANBLASTERFANBLASTER
Methodology & Rules (Live Trading Version)
Purpose
Catch the exact moment the market flips from chop into a high-conviction trending move using a clean, stacked Fib EMA ribbon + volatility + volume confirmation.
Core Idea
When the 5-8-13-21-34-55 EMA stack suddenly “fans out” in perfect order with significant separation, a real trend is being born. Most retail traders chase late – FANBLASTER alerts you on the very first bar the fan opens.
What Triggers a “FAN BLAST” Alert
Perfect EMA Alignment
Bullish: 5 > 8 > 13 > 21 > 34 > 55
Bearish: 5 < 8 < 13 < 21 < 34 < 55
(Has to flip from NOT aligned on the previous bar → aligned on this bar)
Significant Separation
Distance between EMA 5 and EMA 55 ≥ 1.3 × ATR(14)
(1.3 is the ES sweet spot – filters fake little wiggles)
Trend Strength Confirmation
ADX(14) ≥ 22
(Ensures the move isn’t just noise; ES trends explode while ADX is still climbing)
Volume Conviction
Current volume > 1.4 × 20-period EMA of volume
(Real moves have real participation)
When ALL FOUR conditions are true on the same bar → you get the green or red circle + phone alert.
How to Trade It (Live Rules)
Alert fires → look at the chart immediately
If price is pulling back to the 8 or 13 EMA in the direction of the fan → enter on touch or close above/below
Initial stop: opposite side of the fan (below the 55 for longs, above the 55 for shorts)
Target: 2–4 R minimum, trail with the 21 or 34 once in profit
No alert = stay flat. This is a “trend birth” sniper, not a scalping tool.
Best Instruments & Timeframes (2025)
ES & NQ futures
2 min, 5 min, 15 min (all work with the exact same settings)
Works on MES/MNQ too (same params)
Bottom Line
FANBLASTER sits silent 90 % of the day and only screams when the market is actually about to run 20–100+ points.
One alert = one high-probability trend. That’s it.
Lock it, load it, and let the phone do the hunting.
Good luck, stay disciplined, and stack those points.
— Your edge is now live.

Gyspy Bot Trade Engine - V1.2B - Alerts - 12-7-25 - SignalLynxGypsy Bot Trade Engine (MK6 V1.2B) - Alerts & Visualization
Brought to you by Signal Lynx | Automation for the Night-Shift Nation 🌙
1. Executive Summary & Architecture
Gypsy Bot (MK6 V1.2B) is not merely a strategy; it is a massive, modular Trade Engine built specifically for the TradingView Pine Script V6 environment. While most tools rely on a single dominant indicator to generate signals, Gypsy Bot functions as a sophisticated Consensus Algorithm.
Note: This is the Indicator / Alerts version of the engine. It is designed for visual analysis and generating live alert signals for automation. If you wish to see Backtest data (Equity Curves, Drawdown, Profit Factors), please use the Strategy version of this script.
The engine calculates data from up to 12 distinct Technical Analysis Modules simultaneously on every bar closing. It aggregates these signals into a "Vote Count" and only fires a signal plot when a user-defined threshold of concurring signals is met. This "Voting System" acts as a noise filter, requiring multiple independent mathematical models—ranging from volume flow and momentum to cyclical harmonics and trend strength—to agree on market direction.
Beyond entries, Gypsy Bot features a proprietary Risk Management suite called the Dump Protection Team (DPT). This logic layer operates independently of the entry modules, specifically scanning for "Moon" (Parabolic) or "Nuke" (Crash) volatility events to signal forced exits, preserving capital during Black Swan events.
2. ⚠️ The Philosophy of "Curve Fitting" (Must Read)
One must be careful when applying Gypsy Bot to new pairs or charts.
To be fully transparent: Gypsy Bot is, by definition, a very advanced curve-fitting engine. Because it grants the user granular control over 12 modules, dozens of thresholds, and specific voting requirements, it is extremely easy to "over-fit" the data. You can easily toggle switches until the charts look perfect in hindsight, only to have the signals fail in live markets because they were tuned to historical noise rather than market structure.
To use this engine successfully:
Visual Verification: Do not just look for "green arrows." Look for signals that occur at logical market structure points.
Stability: Ensure signals are not flickering. This script uses closed-candle logic for key decisions to ensure that once a signal plots, it remains painted.
Regular Maintenance is Mandatory: Markets shift regimes (e.g., from Bull Trend to Crab Range). Gypsy Bot settings should be reviewed and adjusted at regular intervals to ensure the voting logic remains aligned with current market volatility.
Timeframe Recommendations:
Gypsy Bot is optimized for High Time Frame (HTF) trend following. It generally produces the most reliable results on charts ranging from 1-Hour to 12-Hours, with the 4-Hour timeframe historically serving as the "sweet spot" for most major cryptocurrency assets.
3. The Voting Mechanism: How Entries Are Generated
The heart of the Gypsy Bot engine is the ActivateOrders input (found in the "Order Signal Modifier" settings).
The engine constantly monitors the output of all enabled Modules.
Long Votes: GoLongCount
Short Votes: GoShortCount
If you have 10 Modules enabled, and you set ActivateOrders to 7:
The engine will ONLY plot a Buy Signal if 7 or more modules return a valid "Buy" signal on the same closed candle.
If only 6 modules agree, the signal is rejected.
4. Technical Deep Dive: The 12 Modules
Gypsy Bot allows you to toggle the following modules On/Off individually to suit the asset you are trading.
Module 1: Modified Slope Angle (MSA)
Logic: Calculates the geometric angle of a moving average relative to the timeline.
Function: Filters out "lazy" trends. A trend is only considered valid if the slope exceeds a specific steepness threshold.
Module 2: Correlation Trend Indicator (CTI)
Logic: Measures how closely the current price action correlates to a straight line (a perfect trend).
Function: Ensures that we are moving up with high statistical correlation, reducing fake-outs.
Module 3: Ehlers Roofing Filter
Logic: A spectral filter combining High-Pass (trend removal) and Super Smoother (noise removal).
Function: Isolates the "Roof" of price action to catch cyclical turning points before standard moving averages.
Module 4: Forecast Oscillator
Logic: Uses Linear Regression forecasting to predict where price "should" be relative to where it is.
Function: Signals when the regression trend flips. Offers "Aggressive" and "Conservative" calculation modes.
Module 5: Chandelier ATR Stop
Logic: A volatility-based trend follower that hangs a "leash" (ATR multiple) from extremes.
Function: Used as an entry filter. If price is above the Chandelier line, the trend is Bullish.
Module 6: Crypto Market Breadth (CMB)
Logic: Pulls data from multiple major tickers (BTC, ETH, and Perpetual Contracts).
Function: Calculates "Market Health." If Bitcoin is rising but the rest of the market is dumping, this module can veto a trade.
Module 7: Directional Index Convergence (DIC)
Logic: Analyzes the convergence/divergence between Fast and Slow Directional Movement indices.
Function: Identifies when trend strength is expanding.
Module 8: Market Thrust Indicator (MTI)
Logic: A volume-weighted breadth indicator using Advance/Decline and Volume data.
Function: One of the most powerful modules. Confirms that price movement is supported by actual volume flow. Recommended setting: "SSMA" (Super Smoother).
Module 9: Simple Ichimoku Cloud
Logic: Traditional Japanese trend analysis.
Function: Checks for a "Kumo Breakout." Price must be fully above/below the Cloud to confirm entry.
Module 10: Simple Harmonic Oscillator
Logic: Analyzes harmonic wave properties to detect cyclical tops and bottoms.
Function: Serves as a counter-trend or early-reversal detector.
Module 11: HSRS Compression / Super AO
Logic: Detects volatility compression (HSRS) or Momentum/Trend confluence (Super AO).
Function: Great for catching explosive moves resulting from consolidation.
Module 12: Fisher Transform (MTF)
Logic: Converts price data into a Gaussian normal distribution.
Function: Identifies extreme price deviations. Uses Multi-Timeframe (MTF) logic to ensure you aren't trading against the major trend.
5. Global Inhibitors (The Veto Power)
Even if 12 out of 12 modules vote "Buy," Gypsy Bot performs a final safety check using Global Inhibitors.
Bitcoin Halving Logic: Prevents trading during chaotic weeks surrounding Halving events (dates projected through 2040).
Miner Capitulation: Uses Hash Rate Ribbons to identify bearish regimes when miners are shutting down.
ADX Filter: Prevents trading in "Flat/Choppy" markets (Low ADX).
CryptoCap Trend: Checks the total Crypto Market Cap chart for broad market alignment.
6. Risk Management & The Dump Protection Team (DPT)
Even in this Indicator version, the RM logic runs to generate Exit Signals.
Dump Protection Team (DPT): Detects "Nuke" (Crash) or "Moon" (Pump) volatility signatures. If triggered, it plots an immediate Exit Signal (Yellow Plot).
Advanced Adaptive Trailing Stop (AATS): Dynamically tightens stops in low volatility ("Dungeon") and loosens them in high volatility ("Penthouse").
Staged Take Profits: Plots TP1, TP2, and TP3 events on the chart for visual confirmation or partial exit alerts.
7. Recommended Setup Guide
When applying Gypsy Bot to a new chart, follow this sequence:
Set Timeframe: 4 Hours (4H).
Tune DPT: Adjust "Dump/Moon Protection" inputs first. These filter out bad signals during high volatility.
Tune Module 8 (MTI): Experiment with the MA Type (SSMA is recommended).
Select Modules: Enable/Disable modules based on the asset's personality (Trending vs. Ranging).
Voting Threshold: Adjust ActivateOrders to filter out noise.
Alert Setup: Once visually satisfied, use the "Any Alert Function Call" option when creating an alert in TradingView to capture all Buy/Sell/Close events generated by the engine.
8. Technical Specs
Engine Version: Pine Script V6
Repainting: This indicator uses Closed Candle data for all Risk Management and Entry decisions. This ensures that signals do not vanish after the candle closes.
Visuals:
Blue Plot: Buy/Sell Signal.
Yellow Plot: Risk Management (RM) / DPT Close Signal.
Green/Lime/Olive Plots: Take Profit hits.
Disclaimer:
This script is a complex algorithmic tool for market analysis. Past performance is not indicative of future results. Cryptocurrency trading involves substantial risk of loss. Use this tool to assist your own decision-making, not to replace it.
9. About Signal Lynx
Automation for the Night-Shift Nation 🌙
Signal Lynx focuses on helping traders and developers bridge the gap between indicator logic and real-world automation. The same RM engine you see here powers multiple internal systems and templates, including other public scripts like the Super-AO Strategy with Advanced Risk Management.
We provide this code open source under the Mozilla Public License 2.0 (MPL-2.0) to:
Demonstrate how Adaptive Logic and structured Risk Management can outperform static, one-layer indicators
Give Pine Script users a battle-tested RM backbone they can reuse, remix, and extend
If you are looking to automate your TradingView strategies, route signals to exchanges, or simply want safer, smarter strategy structures, please keep Signal Lynx in your search.
License: Mozilla Public License 2.0 (Open Source).
If you make beneficial modifications, please consider releasing them back to the community so everyone can benefit.

Tamil | MTF DashboardThe Tamil | MTF Dashboard is a powerful multi-timeframe (MTF) market strength and trend-bias analyzer designed to give traders a fast, at-a-glance understanding of market conditions across 7 timeframes.
This dashboard consolidates essential indicators into a clean table plus a dynamic bias label that updates live with the chart timeframe.
⸻
✅ What This Dashboard Shows
1. RSI (Multi-Timeframe)
• Uses custom color logic:
• Green: RSI > 55
• Red: RSI < 45
• Gray: Neutral zone (45–55)
• Quickly identifies momentum shifts across multiple timeframes.
2. Stochastic (Multi-Timeframe)
• Values clamped to 0–100
• Color-coded:
• Oversold (<20): Green
• Overbought (>80): Red
• Neutral: Gray
3. Supertrend Direction
• Returns Buy / Sell / Neutral per timeframe
• Color-coded trend bias for quick directional confirmation.
4. Moving Average Trend (SMA or EMA)
• Choose between SMA or EMA
• Shows whether price is above/below MA
• Above MA → Bullish (Buy)
• Below MA → Bearish (Sell)
5. Combined Score (-4 to +4)
A powerful numeric sentiment summarizing 4 trend components:
• RSI score
• Stochastic score
• Supertrend score
• MA trend score
Each indicator contributes -1, 0, or +1, giving a total score:
• +2 to +4 = Bullish
• -2 to -4 = Bearish
• Between -1 and +1 = Neutral
Includes Trend Strength:
• Very Weak
• Weak
• Moderate
• Strong
All shown inside the Score cell per timeframe.
⸻
📌 Bias Label (Chart Timeframe Only)
Displays real-time information for the active chart timeframe:
• Bias (Bullish / Bearish / Neutral)
• Combined Score
• ATR value
• ADX value (0–100, DI-based calculation)
Perfect for gauging trend strength without cluttering the chart.
⸻
🧩 Supported Timeframes
The dashboard updates the following timeframes simultaneously:
• 1m, 3m, 5m, 15m, 1H, 4H, 1D
⸻
🎯 Designed For
• Intraday traders
• Swing traders
• Scalpers
• Multi-timeframe analysts
• Traders who want instant visual confirmation of market strength
⸻
⭐ Why This Dashboard Is Unique
• True multi-timeframe aggregation
• Custom, realistic scoring engine
• Accurate ADX (0–100) matching textbook DI calculation
• Clean color logic for fast interpretation
• Zero repainting (uses standard indicators + request.security)
• Works on any market: Stocks, Crypto, Forex, Futures

RiskCraft - Advanced Risk Management SystemRiskCraft – Risk Intelligence Dashboard
Trade like you actually respect risk
"I know the setup looks good… but how much am I actually risking right now?"
RiskCraft is an open-source Pine Script v6 indicator that keeps risk transparent directly on the chart. It is not a signal generator; it is a risk desk that calculates size, frames volatility, and reminds you when your behaviour drifts away from the plan.
Core utilities
Calculates professional-style position sizing in real time.
Reads volatility and market regime before position size is confirmed.
Adjusts risk based on the trader’s emotional state and confidence inputs.
Maps session risk across Asian, London, and New York hours.
Draws exactly one stop line and one target line in the preferred direction.
Provides rotating education tips plus contextual warnings when risk escalates.
It is intentionally conservative and keeps you in the game long enough for any separate entry logic to matter.
---
Chart layout checklist
Use a clean chart on a liquid symbol (e.g., AMEX:SPY or major FX pairs).
Main RiskCraft dashboard placed on the right edge.
Session Risk box on the left with UTC time visible.
Floating risk badge above price.
Stop/target guide lines enabled.
Education panel visible in the bottom-right corner.
---
1. On-chart components
Right-side dashboard : account risk %, position size/value, stop, target, risk/reward, regime, trend strength, emotional state, behavioural score, correlation, and preferred trade direction.
Session Risk box : highlights active session (Asian, London, NY), current UTC time, and risk label (High/Med/Low) per session.
Floating risk badge : keeps actual account risk percent visible with colour-coded wording from Ultra Cautious to Very Aggressive.
Stop/target lines : exactly one dashed stop and one dashed target aligned with the preferred bias.
Education panel : rotates core principles and AI-style warnings tied to volatility, risk %, and behaviour flags.
---
2. Volatility engine – ATR with context 📈
atr = ta.atr(atrLength)
atrPercent = (atr / close) * 100
atrSMA = ta.sma(atr, atrLength)
volatilityRatio = atr / atrSMA
isHighVol = volatilityRatio > volThreshold
ATR vs ATR SMA shows how wild price is relative to recent history.
Volatility ratio above the threshold flips isHighVol , which immediately trims risk.
An ATR percentile rank over the last 100 bars indicates calm versus chaotic regimes.
Daily ATR sampling via request.security() gives higher time-frame context for intraday sessions.
When volatility spikes the script dials position size down automatically instead of cheering for maximum exposure.
---
3. Market regime radar – Danger or Drift 🌊
ema20 = ta.ema(close, 20)
ema50 = ta.ema(close, 50)
ema200 = ta.ema(close, 200)
trendScore = (close > ema20 ? 1 : -1) +
(ema20 > ema50 ? 1 : -1) +
(ema50 > ema200 ? 1 : -1)
= ta.dmi(14, 14)
Regimes covered:
Danger : high volatility with weak trend.
Volatile : volatility elevated but structure still directional.
Choppy : low ADX and noisy action.
Trending : directional flows without extreme volatility.
Mixed : anything between.
Each regime maps to a 1–10 risk score and a multiplier that feeds the final position size. Danger and Choppy clamp size; Trending restores normal risk.
---
4. Behaviour engine – trader inputs matter 🧠
You provide:
Emotional state : Confident, Neutral, FOMO, Revenge, Fearful.
Confidence : slider from 1 to 10.
Toggle for behavioural adjustment on/off.
Behind the scenes:
Each state triggers an emotional multiplier .
Confidence produces a confidence multiplier .
Combined they form behavioralFactor and a 0–100 Behavioural Score .
High-risk emotions or low conviction clamp the final risk. Calm inputs allow normal size. The dashboard prints both fields to keep accountability on-screen.
---
5. Correlation guardrail – avoid stacking identical risk 📊
Optional correlation mode compares the active symbol to a reference (default AMEX:SPY ):
corrClose = request.security(correlationSymbol, timeframe.period, close)
priceReturn = ta.change(close) / close
corrReturn = ta.change(corrClose) / corrClose
correlation = calcCorrelation()
Absolute correlation above the threshold applies a correlation multiplier (< 1) to reduce size.
Dashboard row shows the live correlation and reference ticker.
When disabled, the row simply echoes the current symbol, keeping the table readable.
---
6. Position sizing engine – heart of the script 💰
baseRiskAmount = accountSize * (baseRiskPercent / 100)
adjustedRisk = baseRiskAmount * behavioralFactor *
regimeAdjustment * volAdjustment *
correlationAdjustment
finalRiskAmount = math.min(adjustedRisk,
accountSize * (maxRiskCap / 100))
stopDistance = atr * atrStopMultiplier
takeProfit = atr * atrTargetMultiplier
positionSize = stopDistance > 0 ? finalRiskAmount / stopDistance : 0
positionValue = positionSize * close
Outputs shown on the dashboard:
Position size in units and value in currency.
Actual risk % back on account after adjustments.
Risk/Reward derived from ATR-based stop and target.
---
7. Intelligent trade direction – bias without signals 🎯
Direction score ingredients:
EMA stack alignment.
Price versus EMA20.
RSI momentum relative to 50.
MACD line vs signal.
Directional Movement (DI+/DI–).
The resulting Trade Direction row prints LONG, SHORT, or NEUTRAL. No orders are generated—this is guidance so you only risk capital when the structure supports it.
---
8. Stop/target guide lines – two lines only ✂️
if showStopLines
if preferLong
// long stop below, target above
else if preferShort
// short stop above, target below
Lines refresh each bar to keep clutter low.
When the direction score is neutral, no lines appear.
Use them as visual anchors, not auto-orders.
---
9. Session Risk map – global volatility clock 🌍
Tracks Asian, London, and New York windows via UTC.
Computes average ATR per session versus global ATR SMA.
Labels each session High/Med/Low and colours the cells accordingly.
Top row shows the active session plus current UTC time so you always know the regime you are trading.
One glance tells you whether you are trading quiet drift or the part of the day that hunts stops.
---
10. Floating risk badge – honesty above price 🪪
Text ranges from Ultra Cautious through Very Aggressive.
Colour matches the risk palette inputs (High/Med/Low).
Updates on the last bar only, keeping historical clutter off the chart.
Account risk becomes impossible to ignore while you stare at price.
---
11. Education engine & warnings 📚
Rotates evergreen principles (risk 1–2%, journal trades, respect plan).
Triggers contextual warnings when volatility and risk % conflict.
Flags when emotional state = FOMO or Revenge.
Highlights sub-standard risk/reward setups.
When multiple danger flags stack, an AI-style warning overrides the tip text so you can course-correct before capital is exposed.
---
12. Alerts – hard guard rails 🚨
Excessive Risk Alert : actual risk % crosses custom threshold.
High Volatility Alert : ATR behaviour signals danger regime.
Emotional State Warning : FOMO or Revenge selected.
Poor Risk/Reward Alert : risk/reward drops below your standard.
All alerts reinforce discipline; none suggest entries or exits.
---
13. Multi-market behaviour 🕒
Intraday (1m–1h): session box and badge react quickly; ideal for scalpers needing constant risk context.
Higher time frames (1D–1W): dashboard shifts slowly, supporting swing planning.
Asset classes confirmed in validation: crypto majors, large-cap equities, indices, major FX pairs, and liquid commodities.
Risk logic is price-based, so it adapts across markets without bespoke tuning.
15. Key inputs & recommended defaults
Account Size : 10,000 (modify to match actual account; min 100).
Base Risk % : 1.0 with a Maximum Risk Cap of 2.5%.
ATR Period : 14, Stop Multiplier 2.0, Target Multiplier 3.0.
High Vol Threshold : 1.5 for ATR ratio.
Behavioural Adjustment : enabled by default; disable for fixed risk.
Correlation Check : optional; default symbol AMEX:SPY , threshold 0.7.
Display toggles : main dashboard, risk badge, session map, education panel, and stop lines can be individually disabled to reduce clutter.
16. Usage notes & limits
Indicator mode only; no automated entries or exits.
Trade history panel intentionally disabled (requires strategy context).
Correlation analysis depends on additional data requests and may lag slightly on illiquid symbols.
Session timing uses UTC; adjust expectations if you trade localized instruments.
HTF ATR sampling uses daily data, so bar replay on lower charts may show brief data gaps while HTF loads.
What does everyone think RISK really means?

indicator from Amory VIP WIN RATE 99% Only Free 7 DaysAMORY PRO 2025 – WINRATE 99%+ (Original version)
COMPLETELY FREE OPEN VERSION FOR THE FIRST 7 DAYS!
More than 15,000+ Vietnamese & international traders have used it.
AWESOME VIP FEATURES:
• Extremely strong BUY/SELL signals (RSI divergence + breakout trend + volume spike)
• Super beautiful realtime dashboard: Trend – RSI – ADX – ATR – Volume Change – SIGNAL
• Automatically filter noise, block reverse trends, order indicators when the probability of winning is extremely high
• Support Bollinger Bands + ADX filter + EMA trend
• No repaint – No lag – Run smoothly on all time frames 1p → 1D
THIS VERSION IS CURRENTLY 100% FREE FOR THE FIRST 7 DAYS!
After 7 days → the script will automatically lock (only invited people can continue to use it).
If you want to continue using it for a long time (not locked):
Inbox now at: t.me
There will be gifts + special offers for those who inbox during these 7 free days!
AMORY PRO 2025 – THE BEST MONEY MAKING INDICATOR!
© 2025 Amory – All Rights Reserved

Alpha Signal AI ProAlpha Signal AI Pro
Short description:
A smart, ensemble-style indicator that blends trend, momentum, volume, volatility, and candle patterns into a score & star system that produces Buy/Sell signals confirmed by MACD crosses. After a signal, it projects smart targets (TP1/TP2/TP3) and a stop-loss derived from ATR, with forward drawings and a control panel for trade management.
Inputs
Minimum Score (min_score): default 6.0 — higher = fewer but stronger signals.
Minimum Stars (min_stars): default 2 — extra filter for strength.
Future Bars (future_bars): default 15 — how far targets/SL are drawn ahead.
Use AI Targets (use_ai_targets): toggle the AI multiplier for TP/SL.
How it works
Computes buy_score/sell_score from: EMA8/21/50/200, RSI & its MA, MACD & Histogram, Stochastic, ADX/DMI, VWAP, Volume, 15m MTF tilt, ROC/Momentum, Heikin Ashi, and candle patterns (engulfing/hammer/shooting star).
Converts scores into Stars (⭐⭐ to ⭐⭐⭐⭐⭐) via tiered thresholds.
Signals fire only when: Score ≥ minimum + Stars ≥ minimum + MACD cross (up = Buy, down = Sell).
On a signal, one active trade is managed until TP3 or SL is reached.
Targets & Stop (AI-driven)
Targets and SL are ATR-based, then adjusted by an AI multiplier derived from: ATR%, momentum (ROC), relative volume, trend strength (ADX), and star rating.
Approximate formulas:
TP1 ≈ 1.5×ATR × AI
TP2 ≈ 2.5×ATR × AI
TP3 ≈ 4.0×ATR × AI
SL ≈ 1.0×ATR ÷ AI
What you’ll see on chart
“Buy/Sell” markers with small Star labels, an Entry line (blue), SL (red dotted), TP1/TP2 (green), TP3 (gold) with shaded target boxes and a guide line towards the final target.
A central AI badge showing the multiplier % and star rating.
A top-right Panel showing status, strength, AI%, price, scores, and during trades: entry, TP1/TP2/TP3, and live P/L.
Alerts
Two ready-made conditions: Buy and Sell when the respective signal triggers.
Add alert: Right click → Add alert → choose the indicator → select condition.
Best practices
Match timeframe to instrument:
Scalping 5–15m: min_score 8, min_stars 3–4.
Swing H1–H4: min_score 7, min_stars 3.
Daily/Equities: min_score 6–7, min_stars 2–3.
Prefer trades with EMA200 and 15m MTF trend alignment.
De-risk around major news.
Use fixed risk per trade (e.g., 1%).
Important notes
Prefer bar close confirmation to avoid mid-bar MACD flips.
Single trade at a time via the in_trade state.
15m MTF uses request.security with lookahead_off; evaluate at close for consistency.
FAQ
Use it standalone? You can, but it’s stronger when combined with S/R zones/trendlines and solid risk management.
Why do targets vary? The AI multiplier adapts TP/SL to current market conditions.
Disclaimer
This is an analytical/educational tool, not financial advice. Always backtest and use appropriate risk management.
Developer note
Built in Pine Script v6, uses var for trade state, clears drawings on the last bar to keep the chart tidy, and raises drawing limits to avoid runtime errors.
AI Chakra for Global Markets by Pooja🌐 AI Chakra for Global Markets by Pooja
⚡ Advanced Multi-Signal Trading Framework for Forex & Crypto
AI Chakra is a complete institutional-grade market analysis system, combining
Trend + Structure + Momentum + Volatility + Breakouts + Multi-TF Context + Smart Levels
into a single clean and powerful charting tool.
Designed especially for Forex and Crypto, where speed, precision and clarity matter most.
✨ Key Features
1️⃣ 🎯 Smart Auto Buy/Sell Signal System
Signals appear only when multiple conditions align:
✔️ Buy Sell Signals include:
🟢 Supertrend in bullish zone
💪 RSI momentum in upper strength zone
🔄 CHoCH or BOS supporting upward shift
🚀 Breakout above key levels (Prev-Day High)
⚙️ Optional filters: ADX-Volatility + RSI-MA Protection
✔️ Sell Signals include:
🔴 Supertrend bearish
📉 RSI in weakness zone
🔄 CHoCH/BOS supporting downward structure
🕳️ Breakout below previous-day low
⚙️ Optional filters for momentum validation
📌 Signals are printed as clean labels — visually distinct and easy to interpret.
2️⃣ 🧠 Smart Money Concepts (SMC Suite)
Built-in structural analysis for professional traders:
🔶 CHoCH (Change of Character)
🔷 BOS (Break of Structure)
Every CHoCH/BOS is plotted with:
Horizontal structural level
Precision labels
ATR-adjusted spacing to avoid overlap
Perfect for identifying:
✔️ Trend reversals
✔️ Continuation breaks
✔️ Manipulation zones
✔️ Smart entry areas
3️⃣ 📊 Multi-Timeframe Trend Dashboard (Top-Down View)
A clean institutional-level dashboard across:
1m ▸ 5m ▸ 15m ▸ 30m ▸ 1H ▸ 4H ▸ 1D ▸ 1W ▸ 1M
Each timeframe evaluates:
EMA alignment
VWAP alignment
Supertrend direction
Shows 🔵 Bullish, 🔴 Bearish, ⚪ Neutral
in a visually intuitive format.
4️⃣ 📐 Auto Trendline System + Breakout Detection (Optional Module)
When enabled:
Detects swing highs/lows automatically
Draws dynamic support/resistance trendlines
Uses ATR / Stdev / Linear Regression slopes
Extends lines into future
Marks Breakout events with labels
Ideal for:
✔️ Crypto volatility
✔️ Forex swings
✔️ Breakout traders
✔️ Channel/wedge detection
5️⃣ 🏛️ Institutional Levels – Traditional Pivot Points
Includes complete dynamic Support/Resistance map:
Daily / Weekly / Monthly
Quarterly / Yearly
Multi-Year levels
Adjustable:
Line width
Line color
Price labels (Left/Right)
Works perfectly for:
XAUUSD
GBPJPY
EURUSD
BTCUSDT
NAS100
US30
📌 6. Volatility & Momentum Safety Filters (Optional)
ADX Filter
Allows signals only when volatility/trend strength is acceptable
Avoids signals in low-volatility sideways markets
RSI-MA Filter
Detects fake breakouts
Evaluates RSI displacement & momentum slope
Keeps only reliable directional conditions
These filters help refine signals for Forex (high-flow sessions) and Crypto (high-volatility assets).
📌 7. Previous-Day High/Low Break Detection
A pure price-action breakout feature tuned for global markets:
Detects clean breaks of yesterday’s high (bullish strength)
Detects breaks of yesterday’s low (bearish weakness)
Auto-avoids duplicate prints
Works extremely well in:
XAUUSD
GBPJPY
BTCUSDT
ETHUSDT
Indices like NAS100 or US30
6️⃣ 📡 JSON-Ready Alerts (Webhook Compatible)
Send signals directly to:
Telegram bots
Discord servers
Custom trading bots
Automation platforms
Every Buy/Sell alert includes JSON payload support.
🌍 Optimized for Global Markets
Forex
EURUSD • GBPJPY • XAUUSD • USDJPY • GBPUSD • AUDUSD
Majors, minors, exotics supported.
Crypto
BTC • ETH • SOL • BNB • XRP • Futures & Spot.
Timeframes Supported
Scalping: 1m–15m
Intraday: 30m–4H
Swing: 1D–1W–1M
⚠️ Policy-Safe Disclaimer
This script is a technical analysis tool, not financial advice.
It does not guarantee profits or automate trading decisions.
Always verify signals with your own strategy and risk management.
🌟 Final Summary
AI Chakra unifies:
📈 Trend
🧠 Structure
🎯 Signals
💹 Momentum
🔥 Breakouts
🏛️ Institutional Levels
🧩 Multi-TF Logic
🔐 ACCESS
This version is an Invite-Only Script.
Access is granted manually.
🛡 Support
This is an invite-only indicator.
Approved users may contact the author via the “Author’s Instructions” section on TradingView for help or usage guidance.

DMM Buyers vs Sellers Gauge (Fully Optimized)A volume-weighted momentum gauge that measures real-time buyer vs seller pressure (0-100%) and generates tiered long/short signals using trend alignment, ADX strength, volume posture analysis, and exhaustion detection.
Core Function:
Calculates buyer/seller pressure from volume-weighted candle bodies
Displays as visual gauge: RED (sellers) ← → GREEN (buyers)
Scores signals 0-15 points across WEAK/MEDIUM/STRONG tiers
Key Features:
Multi-timeframe trend confirmation (LTF + HTF EMAs)
Volume posture system (trend, momentum, divergence, strength)
Market regime detection (trending vs ranging with volatility)
Exhaustion detection (price distance from MA in ATR terms)
RSI divergence detection (bullish/bearish)
Adaptive thresholds (adjust based on market regime)
Signal Logic:
LONG: Buyers ≥60% + uptrend + volume confirmation + scoring
SHORT: Sellers ≥60% + downtrend + volume confirmation + scoring
Gates: ADX ≥20, ATR percentile range, session filter, optional volume gate
Visual Output:
Bottom gauge showing buyer/seller split
Top-right table with exhaustion, regime, volume posture
Optional arrows for signal tiers
Background coloring for regime
