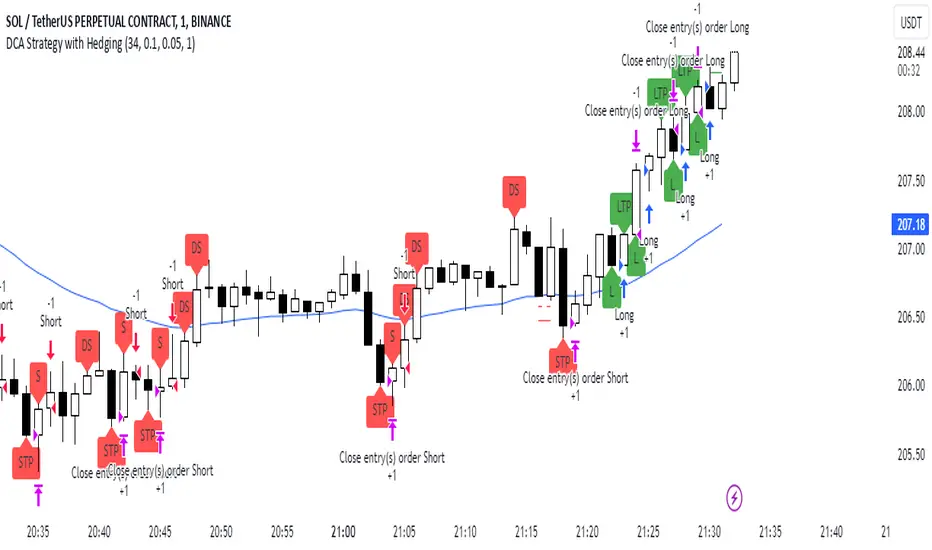
DCA Strategy with HedgingThis strategy implements a dynamic hedging system with Dollar-Cost Averaging (DCA) based on the 34 EMA. It can hold simultaneous long and short positions, making it suitable for ranging and trending markets.
Key Features:
Uses 34 EMA as baseline indicator
Implements hedging with simultaneous long/short positions
Dynamic DCA for position management
Automatic take-profit adjustments
Entry confirmation using 3-candle rule
How it Works
Long Entries:
Opens when price closes above 34 EMA for 3 candles
Adds positions every 0.1% price drop
Takes profit at 0.05% above average entry
Short Entries:
Opens when price closes below 34 EMA for 3 candles
Adds positions every 0.1% price rise
Takes profit at 0.05% below average entry
Settings
EMA Length: Controls the EMA period (default: 34)
DCA Interval: Price movement needed for additional entries (default: 0.1%)
Take Profit: Profit target from average entry (default: 0.05%)
Initial Position: Starting position size (default: 1.0)
Indicators
L: Long Entry
DL: Long DCA
S: Short Entry
DS: Short DCA
LTP: Long Take Profit
STP: Short Take Profit
Alerts
Compatible with all standard TradingView alerts:
Position Opens (Long/Short)
DCA Entries
Take Profit Hits
Note: This strategy works best on lower timeframes with high liquidity pairs. Adjust parameters based on asset volatility.
חפש סקריפטים עבור "alert"
Supertrend and MACD strategyThe Supertrend and MACD Strategy is a comprehensive trading approach designed to capitalize on market trends by using a combination of the Supertrend indicator, the Exponential Moving Average (EMA), and the Moving Average Convergence Divergence (MACD). This strategy aims to identify optimal entry and exit points for both long and short trades, while incorporating strict risk management rules.
Indicators Used:
Supertrend: This indicator is used to identify the overall trend direction. It provides clear signals for trend reversals, helping traders to enter trades in the direction of the prevailing trend.
200-period EMA: This long-term moving average is used to determine the primary trend direction. The strategy only takes long trades when the price is above the 200 EMA and short trades when the price is below it.
MACD: The MACD is used to gauge the momentum and confirm the signals provided by the Supertrend and EMA. It consists of the MACD line, the signal line, and the histogram.
Entry Conditions:
Long Entry:
The Supertrend indicator shows an uptrend (direction > 0).
The MACD line is above the signal line (macd > signal).
The price is above the 200-period EMA (close > ema200).
Short Entry:
The Supertrend indicator shows a downtrend (direction < 0).
The MACD line is below the signal line (macd < signal).
The price is below the 200-period EMA (close < ema200).
Exit Conditions:
Long Exit:
Exit the long position when the MACD line crosses below the signal line (ta.crossunder(macd, signal)).
Set a stop loss (SL) below the lowest low of the last 10 periods (lowestLow - 1).
Short Exit:
Exit the short position when the MACD line crosses above the signal line (ta.crossover(macd, signal)).
Set a stop loss (SL) above the highest high of the last 10 periods (highestHigh + 1).
Risk Management:
The strategy ensures that no new positions are opened if there is already an open trade, preventing overexposure in the market.
Alerts:
Alerts are set to notify traders when the MACD crosses the signal line, providing timely updates for potential exit points.

XAUUSD Trend Strategy### Description of the XAUUSD Trading Strategy with Pine Script
This strategy is designed to trade gold (**XAUUSD**) using proven technical analysis principles. It combines key indicators such as **Exponential Moving Averages (EMA)**, the **Relative Strength Index (RSI)**, and **Bollinger Bands** to identify trading opportunities in trending market conditions.
---
#### Objective:
To maximize profits by identifying trend-aligned entry points while minimizing risks through well-defined Stop Loss and Take Profit levels.
---
### How It Works
1. **Indicators Used:**
- **Exponential Moving Averages (EMA):** Tracks short-term and long-term trends to confirm market direction.
- **Relative Strength Index (RSI):** Detects overbought or oversold conditions for potential reversals or trend continuation.
- **Bollinger Bands:** Measures volatility to identify breakout or reversion points.
2. **Entry Rules:**
- **Long (Buy):** Triggered when:
- The short-term EMA crosses above the long-term EMA (bullish trend confirmation).
- RSI exits oversold territory (<30), signaling buying momentum.
- The price breaks above the upper Bollinger Band, indicating a strong trend.
- **Short (Sell):** Triggered when:
- The short-term EMA crosses below the long-term EMA (bearish trend confirmation).
- RSI exits overbought territory (>70), signaling selling momentum.
- The price breaks below the lower Bollinger Band, indicating a strong downtrend.
3. **Risk Management:**
- **Stop Loss:** Automatically calculated based on a percentage of equity risk (customizable via inputs).
- **Take Profit:** Defined using a risk-to-reward ratio, ensuring consistent profitability when trades succeed.
4. **Visualization:**
- The chart displays the EMAs, Bollinger Bands, and entry/exit points for clear analysis.
---
### Key Features:
- **Customizable Parameters:** You can adjust EMAs, RSI thresholds, Bollinger Band settings, and risk levels to suit your trading style.
- **Alerts:** Automatic alerts for potential trade setups.
- **Backtesting-Ready:** Easily test historical performance on TradingView.
---
This strategy is ideal for gold traders looking for a systematic, rule-based approach to trading trends with minimal emotional interference.

Dow Theory based Strategy (Markttechnik)What makes this script unique?
calculates two trends at the same time: a big one for the overall strong trend - and a small one to trigger a trade after a small correction within the big trend
only if both trends (the small and the big trend) are in an uptrend, a buy signal is created: this prevents a buy signal from being generated in a falling market just because an upward movement begins in a small trend
the exit strategy can be configured very flexibly and individually: use the last low as stop loss and automatically switch to a trialing stop loss as soon as the take profit is reached (instead of finishing the trade)
the take profit strategy can also be configured - e.g. use the last high, a fixed percentage or a combination of it
plots each trade in detail on the chart - e.g. inner candles or the exact progression of the stop loss over the entire duration of the trade to allow you to analyze each trade precisely
What does the script do and how?
In this strategy an intact upward trend is characterized by higher highs and lower lows only if the big trend and the small trend are in an upward trend at the same time.
The following describes how the script calculates a buy signal. Every step is drawn to the chart immediately - see example chart above:
1. the stock rises in the big trend - i.e. in a longer time frame
2. a correction takes place (the share price falls) - but does not create a new low
3. the stock rises again in the big trend and creates a new high
From now on, the big trend is in an intact upward trend (until it falls below its last low).
This is drawn to the chart as 3 bold green zigzag lines.
But we do not buy right now! Instead, we want to wait for a correction in the big trend and for the start of a small upward trend.
4. a correction takes place (not below the low from 2.)
Now, the script also starts to calculate the small trend:
5. the stock rises in the small trend - i.e. in a shorter time frame
6. a small correction takes place (not below the low from 4.)
7. the stock rises above the high from 5.: a new high in the shorter time frame
Now, both trends are in an intact upward trend.
A buy signal is created and both the minor and major trend are colored green on the chart.
Now, the trade is active and:
the stop loss is calculated and drawn for each candle
the take profit is calculated and drawn to the chart
as soon as the price reaches the take profit or the stop loss, the trade is closed
Features and functionalities
Uptrend : An intact upward trend is characterized by higher highs and lower lows. Uptrends are shown in green on the chart.
The beginning of an uptrend is numbered 1, each subsequent high is numbered 2, and each low is numbered 3.
Downtrend: An intact downtrend is characterized by lower highs and lower lows. Downtrends are displayed in red on the chart.
Note that our indicator does not show the numbering of the points of the downtrend.
Trendless phases: If there is no intact trend, we are in a trendless phase. Trendless phases are shown in blue on the chart.
This occurs after an uptrend, when a lower low or a lower high is formed. Or after a downtrend, when a higher low or a higher high is formed.
Buy signals
A buy signal is generated as soon as a new upward trend has been formed or a new high has been established in an intact upward trend.
But even before a buy signal is generated, this strategy anticipates a possible emerging trend and draws the next possible trading opportunity to the chart.
In addition to the (not yet reached) buy price, the risk-reward ratio, the StopLoss and the TakeProfit price is shown.
With this information, you can already enter a StopBuy order, which is thus triggered directly with the then created buy signal.
You can configure, if a buy signal shall be created while the big trend is an uptrend, a downtrend and/or trendless.
Exit strategy
With this strategy, you have multiple possibilities to close your position. All of them can be configured within the settings. In general, you can combine a take profit strategy with a stop loss strategy.
The take profit price will be calculated once for each trade. It will be drawn to the chart for active trade.
Depending on your configuration, this can be the last high (which is often a resistance level), a fixed percentage added to the buy price or the maximum of both.
You can also configure that a trailing stop loss is used as soon as the take profit price is reached once.
The stop loss gets recalculated with each candle and is displayed and plotted for each active and finished trade. With this, you can easily check how the stop loss changed during your trades.
The stop loss can be configured flexibly:
Use the classic "trailing stop loss" that follows the price from below.
Set the stop loss to the last low and tighten it every time the small trend marks a new local low.
Confiure that the stop loss is tightened as soon as the break even is reached. Nothing is more annoying than a trade turning from a win to a loss.
Ignore inside candles (see description below) and relax the stop loss to use the outside candle for its calculation.
Inner candles
Inner candles are created when the candle body is within the maximum values of a previous candle (the outer candle). There can be any number of consecutive inner candles. As soon as you have activated the "Check inner candles" setting, all consecutive inner candles will be highlighted in yellow on the chart.
Prices during an inner candle scenario might be irrelevant for trading and can be interpreted as fluctuations within the outside candle. For this reason, the trailing stop loss should not be aligned with inner candles. Therefore, as soon as an inner candle occurs, the stop loss is reset and the low at the time of the outside candle is used as the calculation for the trailing stop loss. This will all be plotted for you on the chart.
Display of the trades:
All active and closed trades of the last 5 years are displayed in the chart with buy signal, sell, stop loss history, inside candles and statistics.
Backtesting:
The strategy can be simulated for each stock over the period of the last 5 years. Each individual trade is recorded and can be traced and analyzed in the chart including stop loss history. Detailed evaluations and statistics are available to evaluate the performance of the strategy.
Additional Statistics
This strategy immediately displays a statistic table to the chart area giving you an overview of its performance over the last years for the given chart.
This includes:
The total win/loss in $ and %
The win/loss per year in %
The active investment time in days and % (e.g. invested 10 of 100 trading days -> 10%)
The total win/loss in %, extrapolated to 100% equity usage: Only with this value can strategies really be compared. Because you are not invested between the trades and could invest in other stocks during this time. This value indicates how much profit you would have made if you had been invested 100% of the time - or to put it another way - if you had been invested 100% of the time in stocks with exactly the same performance. Let's say you had only one trade in the last 5 years that lasted, say, only one month and made 5% profit. This would be significantly better than a strategy with which you were invested for, say, 5 years and made 10% profit.
The total profit/loss per year in %, extrapolated to 100% equity usage
Notifications (alerts):
Get alerted before a new buy signal emerges to create an order if necessary and not miss a trade. You can also be notified when the stop loss needs to be adjusted. The notification can be done in different ways, e.g. by Mail, PopUp or App-Notification. This saves them the annoying, time-consuming and error-prone "click through" all the charts.
Settings: Display Settings
With these settings, you have the possibility to:
Show the small or the big trend as a background color
Configure if the numbers (1-2-3-2-3) shall be shown at all or only for the small, the big trend or both
Settings: Trend calculation - fine tuning
Drawing trend lines on a chart is not an exact science. Some highs and lows are not very clear or significant. And so it will always happen that 2 different people would draw different trendlines for the same chart. Unfortunately, there is no exact "right" or "wrong" here.
With the options under "Trend Calculation - Fine Tuning" you have the possibility to influence the drawing in of trends and to adapt it to your personal taste.
Small Trend, Big Trend : With these settings you can influence how significant a high or low has to be to recognize them as an independent high or low. The larger the values, the more significant a high or low must be to be recognized as such.
High and low recognition : With this setting you can influence when two adjacent, almost identical highs or lows should be recognized as independent highs or lows. The higher the value, the more different "similar" highs or lows must be in order to be recognized as such.
Which default settings were selected and why
Show Trades: true - its often useful to see all recent trades in the chart
Time Frame: 1 day - most common time frame (except for day traders)
Take Profit: combined 10% - the last high is taken as take profit because the trend often changes there, but only if there is at least 10% profit to ensure we do not risk money for a tiny profit
Stop Loss: combined - the last low is used as stop loss because the trend would break there and switch to a trailing stop loss as soon as our take profit is reached to let our profits run without risking them anymore
Stop Loss distance: 3% - we are giving the price 3% air (below the last low) to avoid being stopped out due to a short price drop
Trailing Stop Loss: 2% - we have to give the stop loss some room to avoid being stopped out prematurely; this is a value that is well balanced between a certain downside distance and the profit-taking ratio
Set Stop Loss to break even: true, 2% - once we reached the break even, it is a common practice to not risk our money anymore, the value is set to the same value as the trailing stop loss
Trade Filter: Uptrend - we only start trades if the big trend is an uptrend in the expectation that it will continue after a small correction
Display settings: those will not influence the trades, feel free to change them to your needs
Trend calculation - Fine Tuning: 1/1,5/0,05; influences the internal calculation for highs and lows and how significant they need to be to be considered a new high or low; the default values will provide you nicely calculated trends in the daily time frame; if there are too many or too few lows and highs according to your taste, feel free to play around and immediately see the result drawn to the chart; read the manual for a detailed description of this values
Note that you can (and should) configure the general trading properties like your initial capital, order size, slippage and commission.

Dual Chain StrategyDual Chain Strategy - Technical Overview
How It Works:
The Dual Chain Strategy is a unique approach to trading that utilizes Exponential Moving Averages (EMAs) across different timeframes, creating two distinct "chains" of trading signals. These chains can work independently or together, capturing both long-term trends and short-term price movements.
Chain 1 (Longer-Term Focus):
Entry Signal: The entry signal for Chain 1 is generated when the closing price crosses above the EMA calculated on a weekly timeframe. This suggests the start of a bullish trend and prompts a long position.
bullishChain1 = enableChain1 and ta.crossover(src1, entryEMA1)
Exit Signal: The exit signal is triggered when the closing price crosses below the EMA on a daily timeframe, indicating a potential bearish reversal.
exitLongChain1 = enableChain1 and ta.crossunder(src1, exitEMA1)
Parameters: Chain 1's EMA length is set to 10 periods by default, with the flexibility for user adjustment to match various trading scenarios.
Chain 2 (Shorter-Term Focus):
Entry Signal: Chain 2 generates an entry signal when the closing price crosses above the EMA on a 12-hour timeframe. This setup is designed to capture quicker, shorter-term movements.
bullishChain2 = enableChain2 and ta.crossover(src2, entryEMA2)
Exit Signal: The exit signal occurs when the closing price falls below the EMA on a 9-hour timeframe, indicating the end of the shorter-term trend.
exitLongChain2 = enableChain2 and ta.crossunder(src2, exitEMA2)
Parameters: Chain 2's EMA length is set to 9 periods by default, and can be customized to better align with specific market conditions or trading strategies.
Key Features:
Dual EMA Chains: The strategy's originality shines through its dual-chain configuration, allowing traders to monitor and react to both long-term and short-term market trends. This approach is particularly powerful as it combines the strengths of trend-following with the agility of momentum trading.
Timeframe Flexibility: Users can modify the timeframes for both chains, ensuring the strategy can be tailored to different market conditions and individual trading styles. This flexibility makes it versatile for various assets and trading environments.
Independent Trade Logic: Each chain operates independently, with its own set of entry and exit rules. This allows for simultaneous or separate execution of trades based on the signals from either or both chains, providing a robust trading system that can handle different market phases.
Backtesting Period: The strategy includes a configurable backtesting period, enabling thorough performance assessment over a historical range. This feature is crucial for understanding how the strategy would have performed under different market conditions.
time_cond = time >= startDate and time <= finishDate
What It Does:
The Dual Chain Strategy offers traders a distinctive trading tool that merges two separate EMA-based systems into one cohesive framework. By integrating both long-term and short-term perspectives, the strategy enhances the ability to adapt to changing market conditions. The originality of this script lies in its innovative dual-chain design, providing traders with a unique edge by allowing them to capitalize on both significant trends and smaller, faster price movements.
Whether you aim to capture extended market trends or take advantage of more immediate price action, the Dual Chain Strategy provides a comprehensive solution with a high degree of customization and strategic depth. Its flexibility and originality make it a valuable tool for traders seeking to refine their approach to market analysis and execution.
How to Use the Dual Chain Strategy
Step 1: Access the Strategy
Add the Script: Start by adding the Dual Chain Strategy to your TradingView chart. You can do this by searching for the script by name or using the link provided.
Select the Asset: Apply the strategy to your preferred trading pair or asset, such as #BTCUSD, to see how it performs.
Step 2: Configure the Settings
Enable/Disable Chains:
The strategy is designed with two independent chains. You can choose to enable or disable each chain depending on your trading style and the market conditions.
enableChain1 = input.bool(true, title='Enable Chain 1')
enableChain2 = input.bool(true, title='Enable Chain 2')
By default, both chains are enabled. If you prefer to focus only on longer-term trends, you might disable Chain 2, or vice versa if you prefer shorter-term trades.
Set EMA Lengths:
Adjust the EMA lengths for each chain to match your trading preferences.
Chain 1: The default EMA length is 10 periods. This chain uses a weekly timeframe for entry signals and a daily timeframe for exits.
len1 = input.int(10, minval=1, title='Length Chain 1 EMA', group="Chain 1")
Chain 2: The default EMA length is 9 periods. This chain uses a 12-hour timeframe for entries and a 9-hour timeframe for exits.
len2 = input.int(9, minval=1, title='Length Chain 2 EMA', group="Chain 2")
Customize Timeframes:
You can customize the timeframes used for entry and exit signals for both chains.
Chain 1:
Entry Timeframe: Weekly
Exit Timeframe: Daily
tf1_entry = input.timeframe("W", title='Chain 1 Entry Timeframe', group="Chain 1")
tf1_exit = input.timeframe("D", title='Chain 1 Exit Timeframe', group="Chain 1")
Chain 2:
Entry Timeframe: 12 Hours
Exit Timeframe: 9 Hours
tf2_entry = input.timeframe("720", title='Chain 2 Entry Timeframe (12H)', group="Chain 2")
tf2_exit = input.timeframe("540", title='Chain 2 Exit Timeframe (9H)', group="Chain 2")
Set the Backtesting Period:
Define the period over which you want to backtest the strategy. This allows you to see how the strategy would have performed historically.
startDate = input.time(timestamp('2015-07-27'), title="StartDate")
finishDate = input.time(timestamp('2026-01-01'), title="FinishDate")
Step 3: Analyze the Signals
Understand the Entry and Exit Signals:
Buy Signals: When the price crosses above the entry EMA, the strategy generates a buy signal.
bullishChain1 = enableChain1 and ta.crossover(src1, entryEMA1)
Sell Signals: When the price crosses below the exit EMA, the strategy generates a sell signal.
bearishChain2 = enableChain2 and ta.crossunder(src2, entryEMA2)
Review the Visual Indicators:
The strategy plots buy and sell signals on the chart with labels for easy identification:
BUY C1/C2 for buy signals from Chain 1 and Chain 2.
SELL C1/C2 for sell signals from Chain 1 and Chain 2.
This visual aid helps you quickly understand when and why trades are being executed.
Step 4: Optimize the Strategy
Backtest Results:
Review the strategy’s performance over the backtesting period. Look at key metrics like net profit, drawdown, and trade statistics to evaluate its effectiveness.
Adjust the EMA lengths, timeframes, and other settings to see how changes affect the strategy’s performance.
Customize for Live Trading:
Once satisfied with the backtest results, you can apply the strategy settings to live trading. Remember to continuously monitor and adjust as needed based on market conditions.
Step 5: Implement Risk Management
Use Realistic Position Sizing:
Keep your risk exposure per trade within a comfortable range, typically between 1-2% of your trading capital.
Set Alerts:
Set up alerts for buy and sell signals, so you don’t miss trading opportunities.
Paper Trade First:
Consider running the strategy in a paper trading account to understand its behavior in real market conditions before committing real capital.
This dual-layered approach offers a distinct advantage: it enables the strategy to adapt to varying market conditions by capturing both broad trends and immediate price action without one chain's activity impacting the other's decision-making process. The independence of these chains in executing transactions adds a level of sophistication and flexibility that is rarely seen in more conventional trading systems, making the Dual Chain Strategy not just unique, but a powerful tool for traders seeking to navigate complex market environments.

IsAlgo - Support & Resistance Strategy► Overview:
The Support & Resistance Strategy is designed to identify critical support and resistance levels and execute trades when the price crosses these levels. Utilizing a combination of a moving average, ATR indicator, and the highest and lowest prices, this strategy aims to accurately pinpoint entry and exit points for trades based on market movements.
► Description:
The Support & Resistance Strategy leverages the ATR (Average True Range) and a moving average to identify key support and resistance levels. The strategy calculates these levels by measuring the distance between the current market price and the moving average. This distance is continuously compared with each new candle to provide an estimate of the support and resistance levels.
The ATR is utilized to determine the width of these levels, ensuring they adjust to market volatility. To validate these levels, the strategy counts how often a candle’s low or high touches the estimated support or resistance and then bounces back. A higher frequency of such touches indicates a stronger, more reliable level.
Once the levels are confirmed, the strategy waits for a candle to close above the resistance level or below the support level. A candle closing above the resistance triggers a long entry, while a candle closing below the support triggers a short entry.
The strategy incorporates multiple stop-loss options to manage risk effectively. These options include setting stop-loss levels based on fixed pips, ATR calculations, or the highest/lowest prices of previous candles. Up to three take-profit levels can be set using fixed pips, ATR, or risk-to-reward ratios. A trailing stop feature adjusts the stop loss as the trade moves into profit, and a break-even feature moves the stop loss to the entry price once a certain profit level is reached.
Additionally, the strategy can close trades if the price crosses the opposite support or resistance level or if a candle moves significantly against the trade direction.
↑ Long Entry Example:
↓ Short Entry Example:
► Features & Settings:
⚙︎ Levels: Configure the length, width, and ATR period for support and resistance levels.
⚙︎ Moving Average: Use an Exponential Moving Average (EMA) to confirm trend direction. This can be enabled or disabled.
⚙︎ Entry Candle: Define the minimum and maximum body size and the body-to-candle size ratio for entry candles.
⚙︎ Trading Session: Specify the trading hours during which the strategy operates.
⚙︎ Trading Days: Select which days of the week the strategy is active.
⚙︎ Backtesting: Set a backtesting period with start and end dates. This feature can be deactivated.
⚙︎ Trades: Customize trade direction (long, short, or both), position sizing (fixed or percentage-based), maximum open trades, and daily trade limits.
⚙︎ Trades Exit: Choose from various exit methods, including profit/loss limits, trade duration, or crossing the opposite support/resistance level.
⚙︎ Stop Loss: Set stop-loss levels using fixed pips, ATR-based calculations, or the highest/lowest price within a specified number of previous candles.
⚙︎ Break Even: Adjust the stop loss to break-even once certain profit conditions are met.
⚙︎ Trailing Stop: Automatically adjust the stop loss as the trade moves into profit.
⚙︎ Take Profit: Define up to three take-profit levels using fixed pips, ATR, or risk-to-reward ratios based on the stop loss.
⚙︎ Alerts: Receive alerts for significant actions such as trade openings and closings, with support for dynamic values.
⚙︎ Dashboard: A visual display on the chart providing detailed information about ongoing and past trades.
► Backtesting Details:
Timeframe: 1-hour US30 chart
Initial Balance: $10,000
Order Size: 5 Units
Commission: $0.5 per contract
Slippage: 5 ticks
Stop Loss: Based on the opposite support/resistance level or break-even adjustments

[strategy][1H] SPY slow stochastics
SPY slow stochastics
Overview
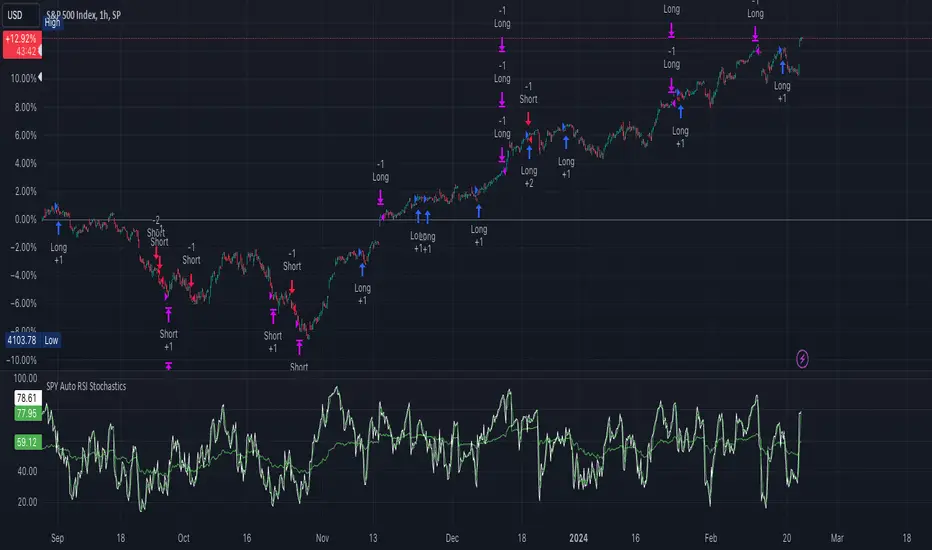
The "SPY Auto RSI Stochastics" strategy is designed to leverage a combination of Relative Strength Index (RSI) and Stochastic indicators to identify potential entry and exit points in trading the SPY $SP:SPX.
The technicals:
A simple yet effective strategy for identifying (reversal) trends on SPY (or any asset).
The logic is as follows:
1. Slow stochastics are effective at predicting momentum. They can also be used to effectively identify reversals.
2. A combination of slow and fast RSI (along with an SMA for the fast RSI) can be used to see potential changes in the directional trend of the underlying asset.
3. In order to reduce noise, a band in the middle of RSI values is ignored; think of this as the price converging and potential explosions (sometimes fake) on either side.
4. Outside this noise band, a crossover of fast RSI on slow RSI indicates an upward trend incoming.
5. A crossunder of fast RSI on slow RSI indicates a downward trend incoming.
Strategy Specific Notes -
1. Load this strategy on SPREADEX:SPX on an hourly chart for the best results.
2. This is a generic strategy, use it on anything - index, stocks, etc. You will need to adjust the parameters for the best results.
3. The RSI Upper defines the cutoff for two things -- threshold for entering a long AND exit signal for short. Likewise for RSI Lower.
4. To have alerts on the strategy, add this to your chart, be content with the backtesting results, select "strategy tester", the alert icon, replace the message body with "{{strategy.order.alert_message}}" without the ".
5. In my experience, the strategy won't be immediately profitable upon a signal but it does get there in the backtested results. Intuitively, this makes sense. Reversals take some time to kick in completely.
Inputs
- **slowRSILength**: Length parameter for the slow RSI calculation.
- **fastRSILength**: Length parameter for the fast RSI calculation.
- **smaRSILength**: Length parameter for the Simple Moving Average (SMA) of the fast RSI.
- **RSIUpperThreshold**: Upper threshold for the RSI, used in exit conditions.
- **RSILowerThreshold**: Lower threshold for the RSI, used in exit conditions.
- **RSIUpperDeadzone**: Upper deadzone threshold for the RSI.
- **RSILowerDeadzone**: Lower deadzone threshold for the RSI.
Strategy Logic
- **RSI Calculation**: The script calculates both slow and fast RSI values based on the provided lengths.
- **Entry Condition**: Entry conditions for long and short positions are based on the crossing of fast RSI over slow RSI and SMA RSI, respectively, along with avoidance of RSI deadzones and validation of trade time.
- **Exit Condition**: Exit conditions for both long and short positions are based on crossing RSI thresholds or opposite entry conditions.
Trade Management
- **Position Entry**: Long and short positions are entered based on predefined entry conditions.
- **Position Exit**: Positions are exited based on predefined exit conditions.
- **Alerts**: The script provides alert messages for entry and exit points.
Plotting
- **Slow RSI**: Plots the slow RSI on the chart.
- **SMA RSI**: Plots the Simple Moving Average of fast RSI on the chart.
Example Usage
The defaults work well for SPY on a 1H timeframe.
If you apply this to anything else DAX, EUSTX50, FTSE, CAC (these are what i have); tweak the input parameters.
Plotting
plot(slowRSI, "Slow RSI", color=color.green) //or fastRSI
plot(smaRSI, "SMA RSI", color=color.white)
Conclusion
The "SPY Auto RSI Stochastics" strategy combines RSI and Stochastic indicators to provide potential trade signals for the SPY ETF. Traders can use this strategy with proper risk management and analysis to enhance their trading decisions.
Heikin Ashi Smoothed Buy Sell with Filters Backtest What is the Heikin Ashi Smoothed Buy Sell with Filters Backtest ?
It is the backtesting version of the Heikin Ashi Smoothed Buy Sell with Filters indicator.
This Pine Script code defines a complex indicator used to determine buy-sell signals on financial charts. The indicator operates based on the smoothed version of Heikin Ashi and is fortified with various filters.
1. Parameters and Settings:
At the start of the code, there are a series of input parameters for the user to customize the indicator. These parameters include:
Trend Filter: Checks whether it is above or below the long-term moving average.
Momentum Filter: Uses the RSI (Relative Strength Index) indicator to check if the market is overbought or oversold.
Volatility Filter: Evaluates the market's volatility level using the ATR (Average True Range) indicator.
Volume Filters: Uses various volume-related parameters to measure the strength of the trade signal.
Trade Settings: Specifies percentage values for target and stop-loss levels to be used in trading.
Moving Average Settings: Allows you to select which moving average to use and its duration.
2. Heikin Ashi Smoothed Calculations:
Heikin Ashi is a charting method used to more clearly represent price movements. The smoothed Heikin Ashi ensures smoother price movements.
3. Moving Average Calculations:
The indicator contains a function to calculate different types of moving averages. These moving averages are used to determine the market trend.
4. Filters:
This indicator includes a series of filters to enhance the quality of the signal. Filters help reduce false signals and produce more robust trading signals.
5. Buy-Sell Signals:
All these filters and calculations are brought together to determine potential buy and sell signals. Signals are triggered when all the specified conditions are met.
6. Chart Visualizations:
This indicator uses various plotting functions to visualize signals and trend information on the chart. This allows the user to easily see signals and the trend on the chart.
7. Trade Settings:
When buy and sell signals are triggered, this section checks if it has reached the specified targets and stop-loss levels.
8. Alerts:
This indicator also sends alerts to the user when specific conditions are met. This ensures that the user doesn't miss potential trading opportunities.
In conclusion, this Pine Script indicator produces buy-sell signals by analyzing market movements and applying various filters. Based on the smoothed version of Heikin Ashi, this indicator is useful for trend followers and is fortified with various filters, thus enhancing the quality of trading signals.
Heikin Ashi Smoothed Buy Sell with Filters Backtest Nedir?
Heikin Ashi Smoothed Buy Sell with Filters indikatörünün backtest yapan versiyonudur
Bu Pine Script kodu, finansal grafiklerde al-sat sinyallerini belirlemek için kullanılan karmaşık bir göstergeyi tanımlar. Gösterge, Heikin Ashi'nin yumuşatılmış sürümünü temel alarak çalışır ve çeşitli filtrelerle güçlendirilmiştir.
1. Parametreler ve Ayarlar:
Kodun başlangıcında, kullanıcının göstergeyi kişiselleştirmesi için bir dizi giriş parametresi bulunmaktadır. Bu parametreler şunları içerir:
Trend Filtresi: Uzun vadeli hareketli ortalamanın üstünde veya altında olup olmadığını kontrol eder.
Momentum Filtresi: RSI (Göreceli Güç Endeksi) göstergesini kullanarak piyasanın aşırı alım veya aşırı satım durumunu kontrol eder.
Oynaklık Filtresi: ATR (Ortalama Gerçek Aralık) göstergesi ile piyasanın oynaklık seviyesini değerlendirir.
Hacim Filtreleri: Ticaret sinyalinin gücünü ölçmek için hacimle ilgili çeşitli parametreleri kullanır.
Ticaret Ayarları: Ticarette kullanılacak hedef ve stop-loss seviyeleri için yüzdelik değerleri belirtir.
Hareketli Ortalama Ayarları: Hangi hareketli ortalamayı kullanacağınızı ve bu ortalamanın süresini seçmenizi sağlar.
2. Heikin Ashi Yumuşatılmış Hesaplamaları:
Heikin Ashi, fiyat hareketlerini daha net bir şekilde göstermek için kullanılan bir grafikleme yöntemidir. Yumuşatılmış Heikin Ashi, fiyat hareketlerinin daha pürüzsüz olmasını sağlar.
3. Hareketli Ortalama Hesaplamaları:
Gösterge, farklı türde hareketli ortalamaları hesaplamak için bir fonksiyon içerir. Bu hareketli ortalamalar, piyasa trendini belirlemek için kullanılır.
4. Filtreler:
Bu gösterge, sinyal kalitesini artırmak için bir dizi filtre içerir. Filtreler, yanlış sinyalleri azaltmaya yardımcı olur ve daha sağlam ticaret sinyalleri üretir.
5. Al-Sat Sinyalleri:
Tüm bu filtreler ve hesaplamalar, potansiyel al ve sat sinyallerini belirlemek için bir araya getirilir. Sinyaller, belirlenen koşulların tümü karşılandığında tetiklenir.
6. Grafik Görselleştirmeleri:
Bu gösterge, sinyalleri ve trend bilgisini grafik üzerinde görselleştirmek için çeşitli çizim fonksiyonları kullanır. Bu, kullanıcının grafik üzerinde kolayca sinyalleri ve trendi görmesini sağlar.
7. Ticaret Ayarları:
Alış ve satış sinyalleri tetiklendiğinde, bu bölüm belirlenen hedeflere ve stop-loss seviyelerine ulaşıp ulaşmadığını kontrol eder.
8. Uyarılar:
Bu gösterge ayrıca, belirli koşullar karşılandığında kullanıcıya uyarı gönderir. Bu, kullanıcının potansiyel ticaret fırsatlarını kaçırmamasını sağlar.
Sonuç olarak, bu Pine Script göstergesi, piyasa hareketlerini analiz ederek ve çeşitli filtreleri uygulayarak al-sat sinyalleri üretir. Heikin Ashi'nin yumuşatılmış sürümüne dayanan bu gösterge, trend takipçileri için kullanışlıdır ve çeşitli filtrelerle güçlendirilmiştir, böylece ticaret sinyallerinin kalitesi artar.

Premium Smart Exit HMA [ByteBoost]The Premium Smart Exit HMA strategy is designed for fast-paced trend detection and is well-suited for small trades in highly volatile markets. It utilizes the Hull Moving Average (HMA) as a signal to execute trades and offers customizable inputs for price calculation, period settings, and stop loss/take profit levels. The strategy aims to reduce lag associated with traditional moving averages, allowing it to catch trends quickly.
Development Notes
This Strategy was developed with the PineScript language, version 5. The aim of the strategy is to provide a trading system that catches fast trend reversals and uses a modified version of the Hull Moving Average. The HMA adeptly adapts to swift variations in price movements while offering better smoothing and utilizes a user selected moving averages, mitigating the smoothing effect and is controlled with a custom weight design.
Features
Customizable trading periods.
Customizable stop loss and take profit levels.
Adjustable date range for backtesting.
Allows setting of initial capital, commission type and value.
Provides visual aids for better understanding of the market trends.
Customize the visuals of the strategy.
Strategy Description
The Smart Exit HMA strategy offers the flexibility to use various types of moving averages, allowing customization of inputs for price calculation, period settings, and stop loss/take profit levels. The strategy relies on the Hull Moving Average (HMA) as a signal to execute trades. However, you have control over the signal frequency by selecting your preferred period value, which determines the number of candles used in the average calculation. This allows you to adapt the strategy to market tendencies and increase its effectiveness during clear trends.
The Smart Exit HMA strategy is designed to minimize lag associated with traditional moving averages, enabling it to respond more quickly to recent price movements based on your chosen period. It's worth noting that the strategy plots two lines on the graph: the average line and the square root line. Buy and sell signals are generated when both lines intersect, indicating favorable trading opportunities.
Inputs/Settings
Capital - If using any leverage multiply the amount of money to invest by the leverage, else input the amount to be invested in every trade.
Start date - The date from which the strategy should begin its analysis. Leave unchanged to start from the earliest available date based on your account's plan.
End date - The date until which the strategy should conduct its analysis. Leave unchanged to continue until the current date.
Period - The lookback period for the moving average calculation, a longer period will translate into fewer trades that last longer.
Stop loss - Allows the use of a stop loss for all trades.
Take profit - Activates the use of a take profit for all trades.
Stop loss value - The distance from the entry price at which the strategy should exit to prevent further losses.
Take profit value - The distance from the entry price at which the strategy should exit to secure profits.
Take profit % - The percentage of the capital to take as profit.
Stop loss % - The percentage of the capital to set as the maximum loss.
Candles exit - The minimum number of candles before the strategy is allowed to close a trade.
Candles change - The minimum number of candles before the strategy is allowed to change the current trend.
Moving average type - Determines the preprocessing method applied prior to utilizing the HMA.
Custom weight - Enables the utilization of a personalized weighting system for the HMA. If chosen, ensure that the sum of all weights equals 1.
Open weight - Determines the weight assigned to the candle's open value.
Close weight - Specifies the weight assigned to the candle's close value.
High weight - Sets the weight attributed to the candle's high value.
Low weight - Determines the weight assigned to the candle's low value.
Highlighter - Light coloring between the trend and average price of each bar.
Signal labels - View the labels indicating a new long or short position.
Exit labels - Displays the labels indicating exit points.
Color long - Sets the color scheme for a new long position.
Color short - Sets the color scheme for a new short position.
Color exit - Decides the color scheme for the exit tag and cross shown.
Indicator Visuals
The strategy plots the two trendlines on the chart and changes its color based on its direction. It also plots shapes on the chart to denote potential buy (Long) and sell (Short) points where the signals of short and long will appear, as well as crosses for the exit points.
Strategy Alerts
The strategy does not include built-in alerts. However, alerts can be added using the TradingView interface based on the strategy's buy, sell and exit conditions. This way you will be able to receive notifications on your computer or phone when a new signal goes out.
Details
Repainting: It is important to mention that the strategy can mark an uptrend signal during a candle and disappear at the end of it, so please just put long or short when the buy/sell conditions are followed and marked by the strategy at the end of each candle.
Conclusion
The Premium Smart Exit HMA is a versatile strategy that combines the benefits of the Hull Moving Average with adjustable parameters to suit individual trading styles. It offers a combination of speed and smoothness, which can be beneficial in volatile markets.
Disclaimer
This strategy is provided as-is, with no guarantee of profits or responsibility for losses. Trading involves risk, and you should only trade with money you can afford to lose. Always conduct your own research and consider your financial situation before engaging in trading.

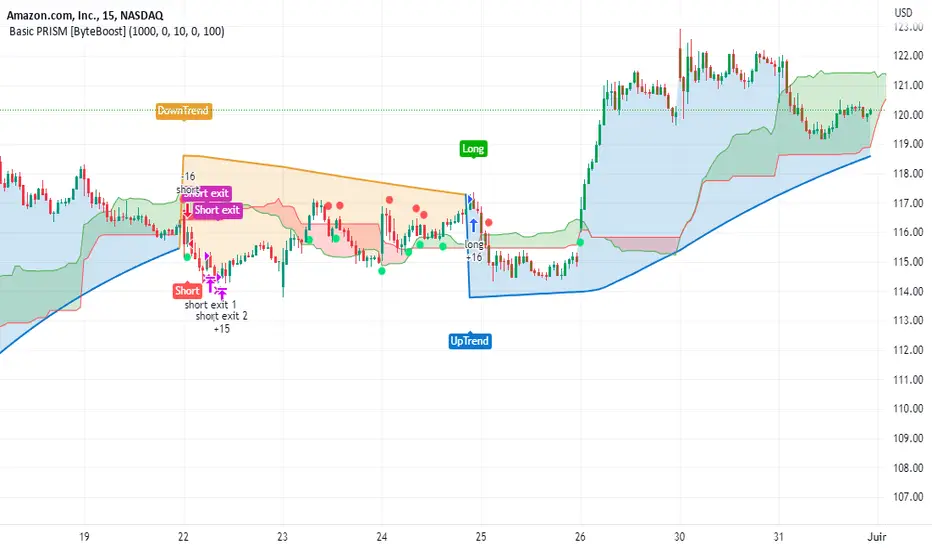
Basic PRISM Algorithm [ByteBoost]The Basic ByteBoost PRISM strategy is designed to operate in various market conditions by leveraging the concept of brownian motion theory, which refers to the unpredictable movement of particles suspended in a fluid. This characteristic of random motion can be effectively utilized for analyzing time series data, such as market candles. Based on this notion, we are making the following assumptions regarding the market.
The stock price exhibits characteristics of Brownian motion.
The stock price is distributed in a log-normal pattern.
Volatility remains constant over time.
Options can only be exercised upon expiration.
Risk-free interest does not fluctuate over time.
There are no random or arbitrary opportunities present in the market.
Development Notes
This Strategy was developed with the PineScript language, version 5. This indicator, and most of the descriptions below, were derived largely from the TradingView reference manual. Feedback and suggestions for improvement are more than welcome, as well as recommended input settings and best practices to assist and guide new users effectively.
Features
The ByteBoost PRISM indicator is capable of analyzing multiple aspects of market behavior simultaneously such as:
Detection of potential trend reversals.
Assessment of trend strength and market sentiment.
Identification of stop loss levels.
Discovery of potential entry and exit points.
Ensuring compatibility and effectiveness with other indicators.
Visualization of strategy using historical data.
Strategy Description
PRISM is an all in one strategy that allows the visualization of entry and exit points as well as the historical performance for every set of parameters. PRISM is a slow paced indicator recommended for the 1h timeframe, because it operates on the belief that markets move in a Brownian motion, for which it leaves enough space and time for the market to decide a trend and catch it at the right time as well as finding appropriate exits given the trend.
PRISM can exist in either an uptrend or downtrend state, but it does not necessarily imply that it reflects the true trend being observed. Instead, it emphasizes capturing significant movements and capitalizing on them by utilizing oscillator levels and exit points calculated based on oversold or overbought values, along with the volatility associated with these movements.
Usage
To use this strategy it is first needed to select a correct set of inputs that correspond to the market you are using, the extra, win difference and oscillator length are dependent on the current market and the average price it manages, so these inputs need to be modified for every pair of assets used.
The long and short tags signify the opportune moment to initiate a new position in the market, whether it's a long or short position, respectively. The exit tags indicate when these positions should be closed. If no exits occur before a new long or short position emerges, it is essential to conclude the existing position and commence a new one in the opposite direction.
Regarding exits, up to two exits can be executed for each movement. The user has the flexibility to determine how these exits are utilized. In the input section, a specific percentage of equity can be selected to be sold during the first exit. If set to 100%, only a single exit will be presented. Otherwise, the remaining equity will be sold during the second exit or at the next trend reversal depending on which action occurs first.
In case the user requires additional exits beyond the initial two, the alternative exits option can be activated in the inputs. This will provide access to supplementary exits, although they may be less advisable compared to the primary exits.
Inputs / Settings
Capital - If using any leverage multiply the amount of money to invest by the leverage, else input the amount to be invested in every trade.
Start date - The date from which the strategy should begin its analysis. Leave unchanged to start from the earliest available date based on your account's plan.
End date - The date until which the strategy should conduct its analysis. Leave unchanged to continue until the current date.
Extra - The minimum gain required in the market to trigger an exit opportunity. It can be a negative number to allow exits at a loss, potentially minimizing losses.
First exit % - If an exit is decided to be partial, it is very likely that there will be a second exit, this parameter determines the percentage of equity to be sold at the first exit. Note that a second exit may not always be applicable.
Win difference - The minimum difference between the entry point and the first exit to determine whether it should be a full exit or a partial exit, as the exit price approaches the entry price, the probability of a trend reversal increases, a full exit is beneficial.
Oscillator - Enables or disables the main oscillator, which helps determine entry points. Not all assets may benefit from this parameter.
Oscillator length - Specifies the number of candles considered for the entry points oscillator.
Highlighter - Applies a light color between the trend and average price of each bar.
Labels - Displays all the labels on the chart indicating trends, positions and exits.
Candle color - Color codes the inside of the candles with the current signal.
Oscillator points - Adds visual dots to indicate when the oscillator has changed its trend.
Color uptrend - Determines the color scheme for identifying uptrend movements.
Color downtrend - Determines the color scheme for identifying downtrend movements.
Color long - Sets the color scheme for a new long position.
Color short - Sets the color scheme for a new short position.
Color exit - Decides the color scheme for the exit tag and cross shown.
Indicator Visuals
The strategy plots the direction of the trend on the chart and changes its color based on this. It also plots shapes on the chart to denote potential buy (Long) and sell (Short) points, where the signals of short and long will appear as well as exit points which can be found as three different,
Exit 1 - A partial exit which sells the previously selected percentage of equity.
Exit 2 - A second exit that can only happen after an Exit 1 has happened, and sell the remaining amount of equity.
Exit Full - A full exit is executed when the price at the exit point is lower than the entry price plus the win difference value. This condition indicates that it is more advantageous to take a single exit rather than waiting for a second exit.
Strategy Alerts
The strategy does not include built-in alerts. However, alerts can be added using the TradingView interface based on the strategy's buy and sell conditions. This way you will be able to receive notifications on your computer or phone when a new signal goes out.
Details
Repainting: It is important to mention that the strategy can mark false long or short signals, as the oscillator is allowed to repaint on the same candle. So users must make sure the candle has closed on buy/sell conditions.
Excessive capital issue: If you configure the strategy with a big amount of capital (+$1,000,000 for example) it is possible that it will completely stop calculating exit signals, as they will be too big for TradingView’s engine to process.
Conclusion
The ByteBoost PRISM strategy empowers traders by providing comprehensive market analysis, clear entry and exit signals, and the ability to visualize strategy performance using historical data. It is a superior algorithm that maximizes profit potential and minimizes risks, making it the preferred choice for traders seeking a competitive edge in the financial markets.
Disclaimer
This strategy is provided as-is, with no guarantee of profits or responsibility for losses. Trading involves risk, and you should only trade with money you can afford to lose. Always conduct your own research and consider your financial situation before engaging in trading.
Premium PRISM Algorithm [ByteBoost]The ByteBoost PRISM strategy is designed to operate in various market conditions by leveraging the concept of brownian motion theory, which refers to the unpredictable movement of particles suspended in a fluid. This characteristic of random motion can be effectively utilized for analyzing time series data, such as market candles. Based on this notion, we are making the following assumptions regarding the market.
The stock price exhibits characteristics of Brownian motion.
The stock price is distributed in a log-normal pattern.
Volatility remains constant over time.
Options can only be exercised upon expiration.
Risk-free interest does not fluctuate over time.
There are no random or arbitrary opportunities present in the market.
Development Notes
This Strategy was developed with the PineScript language, version 5. This indicator, and most of the descriptions below, were derived largely from the TradingView reference manual. Feedback and suggestions for improvement are more than welcome, as well as recommended input settings and best practices to assist and guide new users effectively.
Features
The ByteBoost PRISM indicator is capable of analyzing multiple aspects of market behavior simultaneously such as:
Detection of potential trend reversals.
Assessment of trend strength and market sentiment.
Identification of stop loss levels.
Discovery of potential entry and exit points.
Ensuring compatibility and effectiveness with other indicators.
Visualization of strategy using historical data.
Customization options available.
Strategy Description
PRISM is an all in one strategy that allows the visualization of entry and exit points as well as the historical performance for every set of parameters. PRISM is a slow paced indicator recommended for the 1h timeframe, because it operates on the belief that markets move in a Brownian motion, for which it leaves enough space and time for the market to decide a trend and catch it at the right time as well as finding appropriate exits given the trend.
PRISM can exist in either an uptrend or downtrend state, but it does not necessarily imply that it reflects the true trend being observed. Instead, it emphasizes capturing significant movements and capitalizing on them by utilizing oscillator levels and exit points calculated based on oversold or overbought values, along with the volatility associated with these movements.
Usage
To use this strategy it is first needed to select a correct set of inputs that correspond to the market you are using, the extra, win difference and oscillator length are dependent on the current market and the average price it manages, so these inputs need to be modified for every pair of assets used.
The long and short tags signify the opportune moment to initiate a new position in the market, whether it's a long or short position, respectively. The exit tags indicate when these positions should be closed. If no exits occur before a new long or short position emerges, it is essential to conclude the existing position and commence a new one in the opposite direction.
Regarding exits, up to two exits can be executed for each movement. The user has the flexibility to determine how these exits are utilized. In the input section, a specific percentage of equity can be selected to be sold during the first exit. If set to 100%, only a single exit will be presented. Otherwise, the remaining equity will be sold during the second exit or at the next trend reversal depending on which action occurs first.
In case the user requires additional exits beyond the initial two, the alternative exits option can be activated in the inputs. This will provide access to supplementary exits, although they may be less advisable compared to the primary exits.
Inputs / Settings
Capital - If using any leverage multiply the amount of money to invest by the leverage, else input the amount to be invested in every trade.
Start date - The date from which the strategy should begin its analysis. Leave unchanged to start from the earliest available date based on your account's plan.
End date - The date until which the strategy should conduct its analysis. Leave unchanged to continue until the current date.
Extra - The minimum gain required in the market to trigger an exit opportunity. It can be a negative number to allow exits at a loss, potentially minimizing losses.
First exit % - If an exit is decided to be partial, it is very likely that there will be a second exit, this parameter determines the percentage of equity to be sold at the first exit. Note that a second exit may not always be applicable.
Win difference - The minimum difference between the entry point and the first exit to determine whether it should be a full exit or a partial exit, as the exit price approaches the entry price, the probability of a trend reversal increases, a full exit is beneficial.
Limit length - Specifies the number of candles to consider for the overbought and oversold market calculation.
Low limit - Sets the minimum value of the limit to decide a short exit.
High limit - Sets the maximum value of the limit to decide a long exit.
Band length - Determines the number of candles to consider for the volatility analysis.
Band height - Sets the multiplication factor of the band to set the maximum and minimum height.
Increment - Determines the rate at which trend reversals occur. A higher value brings the line closer to the current price faster.
Candles exit - Specifies the minimum number of candles required to pass for an exit to become available after initiating a new position.
Oscillator - Enables or disables the main oscillator, which helps determine entry points. Not all assets may benefit from this parameter.
Oscillator length - Specifies the number of candles considered for the entry points oscillator.
Highlighter - Applies a light color between the trend and average price of each bar.
Trend Labels - Displays labels indicating an uptrend or downtrend.
Signal Labels - View the labels indicating a new long or short position.
Exit Labels - Displays the labels indicating exit points.
Candle color - Color codes the inside of the candles with the current signal.
Cloud - Visualize the average price cloud to determine trend direction.
Oscillator points - Adds visual dots to indicate when the oscillator has changed its trend.
Oscillator line - Displays the values of the oscillator to indicate upcoming trend changes.
Alternative exits - Shows additional exits to the ones we recommend, useful if the user missed an exit or needs to have more than two.
Color uptrend - Determines the color scheme for identifying uptrend movements.
Color downtrend - Determines the color scheme for identifying downtrend movements.
Color long - Sets the color scheme for a new long position.
Color short - Sets the color scheme for a new short position.
Color exit - Decides the color scheme for the exit tag and cross shown.
Color alternative exit - Changes the color scheme for the alternative exit cross.
Color oscillator line - Determines the color scheme used for the oscillator line.
Indicator Visuals
The strategy plots the direction of the trend on the chart and changes its color based on this. It also plots shapes on the chart to denote potential buy (Long) and sell (Short) points, where the signals of short and long will appear as well as exit points which can be found as three different,
Exit 1 - A partial exit which sells the previously selected percentage of equity.
Exit 2 - A second exit that can only happen after an Exit 1 has happened, and sell the remaining amount of equity.
Exit Full - A full exit is executed when the price at the exit point is lower than the entry price plus the win difference value. This condition indicates that it is more advantageous to take a single exit rather than waiting for a second exit.
Strategy Alerts
The strategy does not include built-in alerts. However, alerts can be added using the TradingView interface based on the strategy's buy and sell conditions. This way you will be able to receive notifications on your computer or phone when a new signal goes out.
Details
Repainting: It is important to mention that the strategy can mark false long or short signals, as the oscillator is allowed to repaint on the same candle. So users must make sure the candle has closed on buy/sell conditions.
Excessive capital issue: If you configure the strategy with a big amount of capital (+$1,000,000 for example) it is possible that it will completely stop calculating exit signals, as they will be too big for TradingView’s engine to process.
Conclusion
The ByteBoost PRISM strategy empowers traders by providing comprehensive market analysis, clear entry and exit signals, and the ability to visualize strategy performance using historical data. It is a superior algorithm that maximizes profit potential and minimizes risks, making it the preferred choice for traders seeking a competitive edge in the financial markets.
Disclaimer
This strategy is provided as-is, with no guarantee of profits or responsibility for losses. Trading involves risk, and you should only trade with money you can afford to lose. Always conduct your own research and consider your financial situation before engaging in trading.

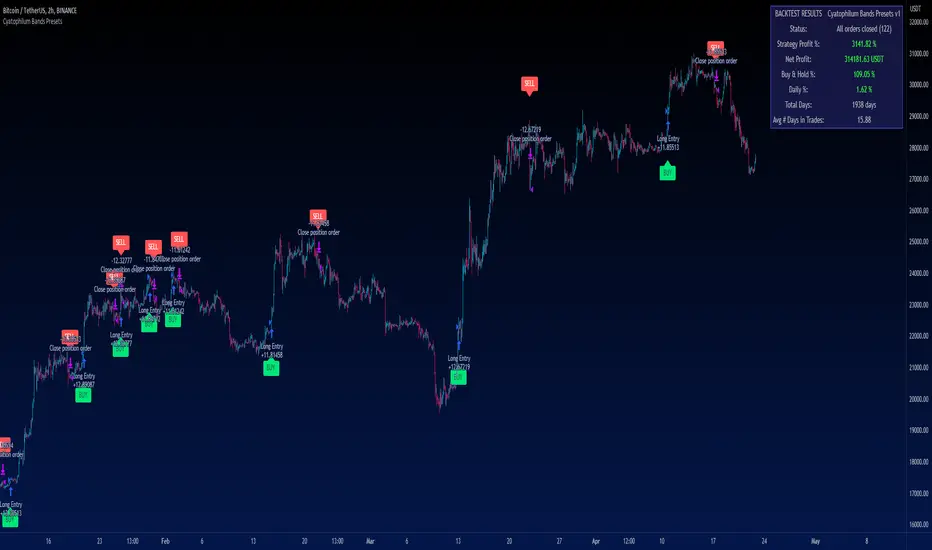
Cyatophilum Bands PresetsThis is a pre-configured strategy for swing trading Bitcoin on the 2 hours chart, Ethereum on the 4 hours, and BNB on the 2 hours. (More presets can be added later on)
Built upon my generic indicator "Cyatophilum Bands D.E.", this indicator removes the struggle of having to copy all the settings, instead, a single dropdown input lets you choose the preset.
More info about the complete strategy here:
The strategy has been backtested over 5 years of historical data and forward tested for +4 months (since january 2023) with the goal to beat buy and hold returns .
The indicator shows real time strategy results and has custom alerts for BUY and SELL signals which can be used to automate the strategy.
When creating your alert, first set your alert messages in the indicator settings. Then, select the indicator and create the alert using "alert() function calls only".
A warning will appear on the chart if the preset and chart configuration is incorrect.
Plots like bands and trailing lines are disabled by default to improve performance but can be turned on in the style tab.
BNBUSDT 2H
A combination of deviation and ATR bands based on Donchian channels.
ETHUSDT 4H
A combination of deviation and ATR bands based on SMA and an ATR trailing stop.
BTCUSDT 2H
Based on Donchian channels breakout type with a tight 2% stop loss, and a 3% take profit that gets disabled when price is trending up to let the trailing stop do its job.
Disclaimer: Backtest results are not representative of future results.
Crypto Tipster v2---------------------
Crypto Tipster v2
Hello again! We're back with a drastically improved Crypto Tipster v2 Indicator using over a dozen all new algorithms based around Technical Analysis, Price Action, Momentum Swings and Reversal Detection.
We've taken our time with version 2 of Crypto Tipster, putting all our best practices to work and ensuring it performs superbly across numerous crypto markets and timeframes - we have focused our efforts towards the larger timeframes, 12H, 1D, 2D for example as we believe these to be the most consistent and predictable, and therefore the most profitable.
Trading on longer timeframes also reduces the overal cost of trading fee's as you'll be placing fewer trades over any given time period, whilst catching bigger swings and therefore earning a higher percentage per winning trade. Due to these bigger price swings you can de-leverage your trades too, making them inherintly safer and more controlled.
The final benefit to placing trades on longer timeframes is that you will not be tied down to your PC or laptop for hours on end waiting for a perfect entry or exit point, which increases the odds of placing bad/panic trades or even placing trades due to boredom! If you trade with Crypto Tipster v2 on a 1D timeframe, you will only ever have work to do once per day, at bar close; this is when trades are placed or exited, or stop losses/take profits are updated to new levels - easy!
Crypto Tipster v2 can help consistently catch tops and bottoms of trending markets whilst avoiding placing trades through choppy or ranging areas, this helps to not only maximise profits (what we're all after!) but also to minimise losses (equally important). We've tirelessly tested Crypto Tipster using literally thousands of variables across dozens of built-in algorithms over hundreds of trading pairs - lots of data to process!
The outcome is rather stunning and well worth checking out - we're rather proud of what we've achieved here, and we're pretty sure you're going to love it too!
---------------------
What's Included
- Chart Settings
The first section you'll come across, Chart Settings.
Here you'll find a few options regarding how your chosen market chart will look within TradingView and how Crypto Tipster will interact with this chart.
One of the most important Tick boxes is first on the list - "Show Backtest Results". This will change Crypto Tipster from displaying simple but easy-to-follow "Buy/Sell" labels into Strategy mode in which you can set up more complicated Stop Loss / Take profit settings as well as setting up Alerts for auto trading and other more complex functions (see How It Works for more info!
We've also included a "Trend Strength Bar Color" tick box which changes the color of the chart bars based on how strong Crypto Tipster is perceiving the current trend and in which direction.
- Trend Settings
"Trading Frequency" represents how often Crypto Tipster will be looking for a new trend / change in trend direction, and therefore how often it will be placing trades. By default this is set to "Normal" but can be changed to "Rapid" using the drop down menu.
"Entry Trend Strength" also determines how frequently trades are placed by selecting the strength of trend required before a trade is placed. The scale ranges from "1-5", with 1 being a low trend strength required, 5 being a very strong trend strength required.
Within the Trend Settings section you'll also find an "Avg Trend Strength over Bars" option. This allows you to average (mean) the current trend strength over a pre-determined amount (1-5) of previous chart bars - thus providing a potentially more consistent signal.
- Trade Settings
Trade Settings help Crypto Tipster determine what type of trades you're looking to place.
The overall "Trade Direction" will decide to either target only Long trades, only Short trades, or Both (default).
"Consecutive Trades in Same Direction" allows for pyramiding - whereby you can specify to allow for multiple trades of the same direction. Set to "1" as default allows for no extra pyramiding, max setting of "10".
- Trade Protection
Currently consisting of two functions, our Trade Protection section can help to achieve both the removal of false signals (whipsaws), and the extension of good trades without confusion during minor retracements.
"Chop Removal" can help to remove some whipsaw trades during ranging market conditions, therefore improving overal profitability by only targeting stronger trends. You have an option to choose from either "Weak" or "Strong" Chop Removal.
"Protection Filter" uses current trading criteria as defined by you, and uses it to check against a higher time frame than you're currently viewing. This can help to eliminate some bad trades at the expense of a potential lag on good trades.
- Stop Loss / Take Profit
Stop Losses should be a crucial aspect of everyone's trading system. They help prevent any trade from going too far in the wrong direction and limit losses.
Our "Stop Loss (%)" is quick and easy to set up, simply set the percentage offset from the entry price of trades and a fixed Stop Loss will be in place on all trades.
"Take Profit (%)" works in the same way as the Stop Loss mentioned above - simply set the percentage you'd like to exit a profitable trade at.
The "Trailing Stop (%)" is a little more complicated in that it will follow the trend of the trade a certain percentage away from the current market price - this is great for keeping yourself in a trade for as long as the trade is moving in the right direction.
- Extra Tools & Indicators
This is the section of Crypto Tipster that enables you to add some chart visuals to assist you with your preferred trading style.
"Potential Pivot Points" are not the same as actual pivot points - Potential pivot points will paint on the chart at bar close, giving you an immediate alert to potential tops/bottoms of market trends. You can choose to display only the strongest potential points, or include some of the weaker signals too.
"Actual Pivot Points" are inherintly more accurate than Potential pivot points, but do not paint on the chart until after a pre-determined amount of time has passed. These are great for placing stop losses/take profits or watching the market for breakouts or reversals.
"Support/Resistance Levels" plots up to 6 support and resistance horizontal lines based on recent price tops/bottoms. Use these to determine areas where price could rebound or break-through.
"Bollinger Band Breakout" - Bollinger bands are a tried and tested technical analysis tool, similar to pivot points and support/resistance lines, thee are another great tool to determine where price may retrace, consolidate or breakout.
- Ichimoku Cloud
Somewhat confusing and intimidating when you first come across this technical analysis indicator, the "Ichimoku Cloud" is one of our favorites. Assisting with the detection of Dynamic Support and Resistance levels, Momentum and Trend Direction all in one super indicator.
Although certain aspects of the Ichimoku Cloud are already present within Crypto Tipster v2 algorithms in order to offer you the best possible signals, we've also included a user-definable section of it's own so you can manually set up and use the cloud for your own trading needs, all cloud signals (and there are many) are available to set up as Alerts for your own needs or an Auto-Trading Bot.
- Custom Alerts for Any Signal
We've endeavoured to ensure that all signals, not just the Buy/Sell signals, are ready and available to create Alerts with; giving you the most opportunity to create a fully custom trading engine that suits your exact trading requirements.
This means you can set Alerts for any and all signals you can see on the chart when using Crypto Tipster v2, this includes Buy/Sell Signals, Trend Strength Signals, Choppy Market Signals, Stop Loss/Take Profit Signals, Pivot Points, S/R levels crossed above & below, Bollinger Band Breakout and several Ichimoku Cloud Signals.. the list goes on!
---------------------
We've tried to make Crypto Tipster as comprehensive and easy to understand as possible, we are however always in search of progression; we do really love to hear your feedback :)
For more information and a free 8-day trial please visit the link in our signature
Happy Trading Guys

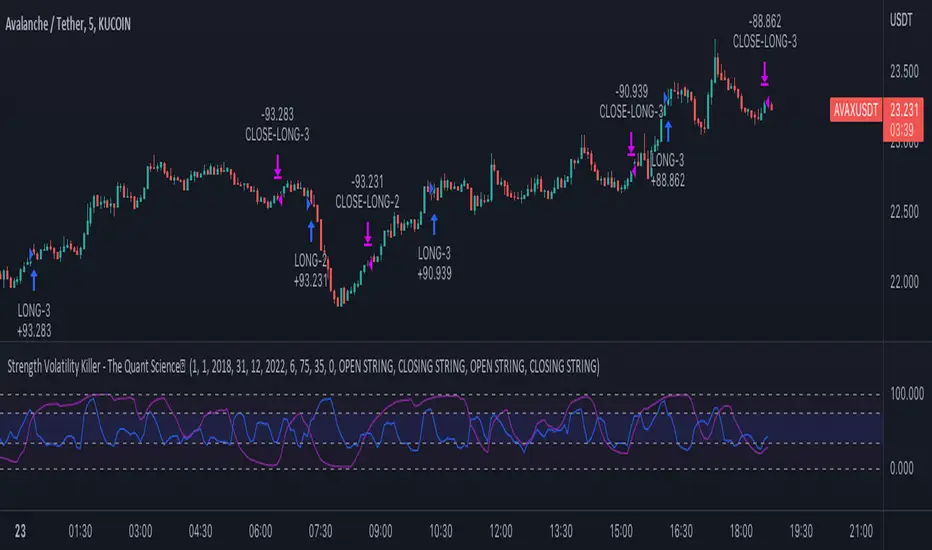
Strength Volatility Killer - The Quant ScienceStrength Volatility Killer - The Quant Science™ is based on a special version of RSI (Relative Strength Index), created with the simple average and standard deviation.
DESCRIPTION
The algorithm analyses the market and opens positions following three different volatility entry conditions. Each entry has a specific and personal exit condition. The user can setting trailing stop loss from user interface.
USER INTERFACE SETTING
Configures the algorithm from the user interface.
AUTO TRADING COMPLIANT
With the user interface, the trader can easily set up this algorithm for automatic trading.
BACKTESTING INCLUDED
The trader can adjust the backtesting period of the strategy before putting it live. Analyze large periods such as years or months or focus on short-term periods.
NO LIMIT TIMEFRAME
This algorithm can be used on all timeframes.
GENERAL FEATURES
Multi-strategy: the algorithm can apply long strategy or short strategy.
Built-in alerts: the algorithm contains alerts that can be customized from the user interface.
Integrated indicator: indicator is included.
Backtesting included: quickly automatic backtesting of the strategy.
Auto-trading compliant: functions for auto trading are included.
ABOUT BACKTESTING
Backtesting refers to the period 13 June 2022 - today, ticker: AVAX/USDT, timeframe 5 minutes.
Initial capital: $1000.00
Commission per trade: 0.03%
[Pt] TICK Supertrend Strategy, 5 minBackground:
It is well known that the indices such as SPY and QQQ follow/represent market sentiment. The TICK index literally represents the market sentiment as it compares the number of stocks that are rising and falling on the NYSE. By default, the TICK index is a short term indicator. Therefore it isn't reliable for swing trading or long term strategies. However, it is perfect for scalping.
Although TICK is well known, many does not know how to use it effectively. As part of the background mechanism of this script, I’ve divided TICK into 5 major zones based on the close of each candle: Overbought (neutral with bearish bias), Bullish, Neutral, Bearish, and Oversold (neutral with bullish bias). Along with the use of Heikin Ashi technique, RSI, moving averages and candle analysis, this strategy aims to provide accurate representation of market sentiment and profitable entry and exit points. *** At the time of publication, this strategy has proved to be consistently profitable. HOWEVER, this DOES NOT guarantee future profitability. So use at your own risk! ***
What is it showing?
This strategy is an intraday scalping strategy that uses TICK data to predict market directions for optimal entry and exit points. It is displayed similarly to the famous Supertrend indicator, which is one of the most common ATR based trailing stop indicators, so visually it is easy to read. This strategy is suitable for trading indices such as SPX , SPY , SPX500USD , QQQ , DJI and any other tickers that have high positive correlation with TICK.
Script is proprietary, but as mentioned it incorporates the following elements with additional candlestick analysis, pattern recognition, stop-loss and profit taking strategy:
- NYSE TICK data
- Heikin Ashi candle technique
- ATR
- RSI
- Moving Averages
Bullish trend is determined by a confluence of said indicators and analyses, and is displayed as a green line under the price action. The distance is defined by an adjustable value that is based on a percentage of the previous daily ATR value. When a long order is in play, that line also acts as the stop-loss level. Bearish trend is the opposite and is displayed in red, by default.
What's unique?
Detecting a ranging market structure and avoiding overtrading in a choppy market has always proven to be difficult, even for the most professional traders. This strategy has built-in “choppiness” and volatility filtering scripts that attempts to help reduce the number of false entries. These elements are what makes this strategy unique and different from other indictors mashup strategies.
In addition, this strategy takes previous trades into account and “learn” from past trades when determining the optimal stop-loss level to maximize profitability. This allows this strategy to better adapts to changing and evolving market conditions.
Strategy statistics
All parameters are designed for 5min time frame.
At the time of publication, this strategy has proved to be consistently profitable through limited back testing data.
Initial capital = $10000
Pyramiding = 1
Slippage = 3 ticks to account for spread
Default leverage shown = 9x
Quantity per trade = 100% of account
Back testing period at time of publication = Apr 11, 2022 - July 22, 2022
Trading Session = 1000 - 1530 Mon-Fri
Timeframe = 5 min
Gain = 1338.48%
Total trades = 253
% Profitable = 45.85%
Profit Factor = 2.506
Max Drawdown = 19.36%
Extras
This release includes default AutoView alerts for trading SPX500USD on Oanda. It includes both long and short order entry alerts, and trailing stop-loss alerts.
Please DM for free trial.
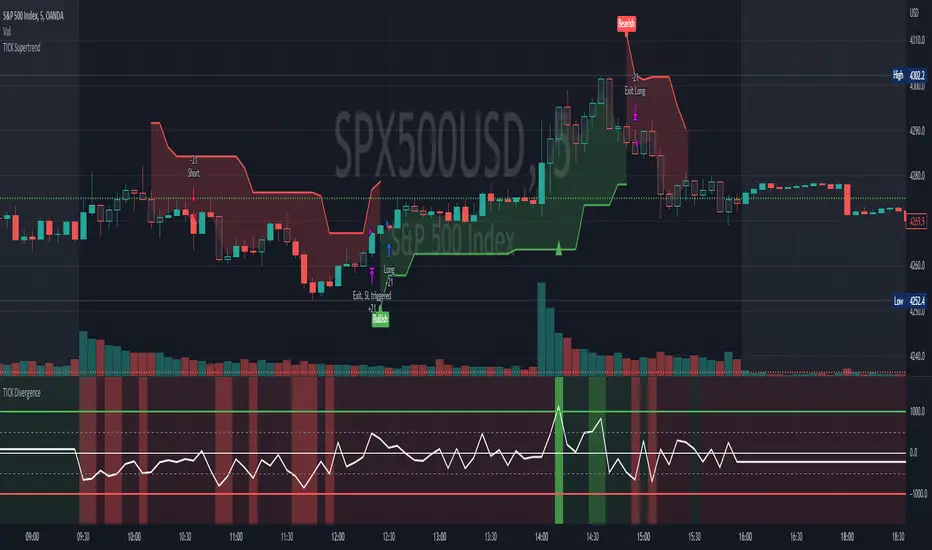
EMA Stoch Strategy For ProfitViewThis strategy will enter positions when the set stochastic conditions are met, and uses the moving average to filter the direction of the trades (long/short). The background is used to illustrate the strength of the stochastic values.
The following is a step by step guide in order to automate the trading of the strategy with ProfitView:
In the indicator settings, set the desired stochastic and ema values, and the stochastic condition you want to use to enter a trade.
In the indicator, set which exchange, symbol, and account to execute trades on.
In the indicator, set the PV Alert names you intend to use. If you want to use the same names as provided in the pastebin below, you may set the three names to Market Long, Market Short, TP SL Hit.
In PV, create two new PV Alerts in the PV Alert tab in accordance to these specifics pastebin.com .
On the Tradingview chart you want the indicator run on, create a new TV alert with this script as its condition, and specify the alert to "alert() function calls only".
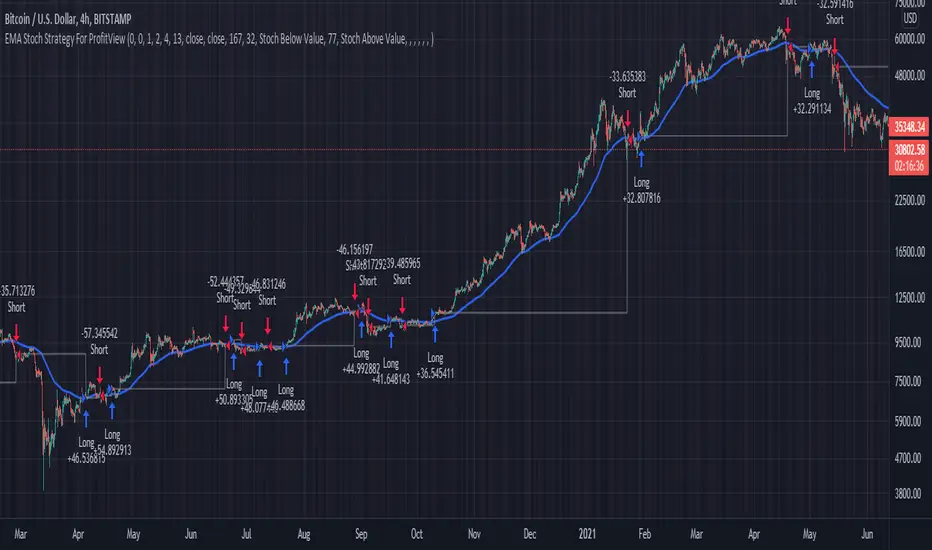
Volume fight strategyThe Volume fight strategy looks for the predominance of bullish or bearish trading volume on the chart by dividing the trading volume in the bar into 2 parts - "bullish volume" and "bearish volume", and comparing the weighted average values by volume with each other at a given distance.
This strategy is suitable for any instrument (cryptocurrency, Forex, stocks) and is able to work on any TF.
The Volume fight strategy should be used as an auxiliary indicator that tells you who is currently prevailing in the market - " bulls "or"bears".
To configure the strategy , it is necessary to set the range of evaluation of the predominance of bullish or bearish volume (the number of bars, by default-24 bars for TF=1H). The smaller the TF, the higher the range value should be used to filter out false signals.
When there is a predominance of "bulls" on the chart, a green triangle appears (relevant at the close of the bar) and the histogram is highlighted in green, when "bears" appear on the chart, a red triangle appears (relevant at the close of the bar) and the histogram is highlighted in red.
In the strategy settings, there is smoothing to reduce false signals and highlight the flat zone by specifying a percentage, at least which should be the difference between the forces of the "bullish" and "bearish" volume . If the difference between the volume forces is less than the specified one (by default-15%), the zone is considered flat and is displayed in gray on the histogram.
If you set the percentage to zero, the flat zones will not be highlighted, but there will be much more false signals, since the strategy becomes very sensitive when the smoothing percentage decreases.
There is a function-to show the color background of the current trading zone. For" bullish "- green, for" bearish " - red.
In the settings, you can enable the display and use of each signal in the trading zone, not only the initial one, but also each after the flat zone. By default, only the signal of the beginning of the ascending/descending zone is used.
The strategy has alerts for "bullish" and "bearish" movements.
👉Use alerts - "alert() function calls only"
If you have any questions, you can write to me in private messages or by using the contacts in my signature.
----------------------------------------------------
Стратегия Volume fight ищет на графике преобладание бычьего или медвежьего объёма торгов путём разделения торгового объёма в баре на 2 части - "бычий объём" и "медвежий объём", и сравнения средне-взвешенных значений по объёму между собой на заданной дистанции.
Данная стратегия подходит для любого инструмента (криптовалюта, Forex, акции) и способен работать на любом ТФ.
Стратегию Volume fight следует использовать как вспомогательный индикатор, который подсказывает Вам кто сейчас преобладает на рынке - "быки" или "медведи".
Для настройки стратегии необходимо выставить диапазон оценки преобладания бычьего или медвежьего объема (количество баров, по умолчанию - 24 бара для ТФ=1Ч). Чем меньше ТФ, тем выше следует использовать значение диапазона, чтобы отфильтровать ложные сигналы.
При возникновении преобладания на графике "быков" появляется зелёный треугольник (актуален по закрытию бара) и гистограмма подсвечивается зелёным цветом, при возникновении на графике "медведей" появляется красный треугольник (актуален по закрытию бара) и гистограмма подсвечивается красным цветом.
В настройках стратегии есть сглаживание для уменьшения ложных сигналов и выделения зоны флета с помощью указания процента, не менее которого, должна быть разница между силами "бычьего" и "медвежьего" объёма. Если разница между силами объёмов меньше заданного (по умолчанию - 15%), то зона считается флетовой и отображается на гистограмме серым цветом.
Если выставить процент равным нулю, то зоны флета выделяться не будут, но будет гораздо больше ложных сигналов, так как стратегия становится очень чувствительной при снижении процента сглаживания.
Есть функция - показывать цветовой фон текущей торговой зоны. Для "бычьего" - зелёный, для "медвежьего" - красный.
В настройках можно включить отображение и использование каждого сигнал в торговой зоне, не только начального, но и каждого после зоны флета. По умолчанию - только сигнал начала восходящей/нисходящей зоны.
Стратегия имеет оповещения для "бычьего" и "медвежьего" движения.
👉 Используйте оповещения - "Только при вызове функции alert()".
По любым вопросам Вы можете написать мне в личные сообщения или по контактам в моей подписи.

Cyatophilum Accumulation StrategyAn indicator to backtest and automate accumulation/pyramiding custom strategies.
The goal of the strategy is to buy several times when the price is low and sell all when the position is in profit.
Configure your strategy using the entry options and entry filters, then set your Take Profit and StopLoss.
═════════════════════════════════════════════════════════════════════════
█ HOW IT WORKS
The strategy has pyramiding enabled, which means it can open several deals in a row.
It will keep buying until the Take Profit target is reached.
The indicator plots the Take Profit and Break Even line which are recalculated at each new deal.
The target corresponds to the average entry price plus a configurable percentage.
We can see the average entry price line drop lower at each Long Entry.
█ HOW TO USE
Choose a pair that you want to hold/invest in.
Pick a chart time frame that you like, according to how often you want the strategy to place orders. A benefit of this strategy is that it can work on low time frames as well as high time frames. Just keep in mind that the smaller the time frame, the bigger the impact of fees and slippage will be on the strategy results.
Configure your entry condition . You can combine several technical indicators to trigger an entry, such as Top & Bottom, Higher Lows and RSI divergences.
Example with double bottoms:
Filter your entry signal . Add filters to strengthen your entry signal.
Configure your profit target
Use the Take Profit feature to set a target in percentage of price. You can also make it trail.
There is a Trailing Stop Loss feature but the goal of the strategy is to never sell in loss, so it is turned off by default.
Check your backtest parameters
Make sure that the initial capital and order size make sense. Since it is a pyramiding strategy, the sum of all deals should not be bigger than the initial capital.
In this example: Initial capital is 10 k, max active deals is 10, so the max order size is 1 k.
If you use % equity as order size, please note that it will create compounding.
Check the fees, by default they are set to 0.1%.
I also recommend to set a slippage that corresponds to your exchange's spread.
Note: the pyramiding parameter has to be equal to the "Max Active deals" input.
█ FEATURES
• Entry settings
Configure wether to go long or short, or both.
Choose the Max Active deals : the maximum number of deals that you want to open at once.
The Minimum bar delay between deals parameter will help putting space between deals.
• Trend Filter
The trend filter will fitler off long deals when the trend is bearish, and short deals when it is bullish.
Choose a trend line from a list, or any external trend line you can find.
The Trend condition allows to choose wether the trend should switch from slope change or price cross.
• MTF Trend Filter
A secondary trend line, Multi Time Frame.
• Volume Filter
The volume filter will check the bar volume and prevent the entry if it is too low.
• Stop Loss and Take Profit
Configure your stop loss and take profit for long and short trades.
You can also make a trailing stoploss and a trailing take profit.
• Backtest Settings
Choose a backtest period, longs or shorts, wether to use limit orders or not.
An option to close open orders at the current bar if you have multiple open orders and are wondering what it would result to close them now.
Graphics
A Configuration panel with all the indicator settings, useful for sharing/saving a strategy.
A Backtest Results panel with additional information from the strategy tester.
█ ALERTS
The indicator is using the alert() calls: it only uses 1 alert slot to send order messages for each event. This means free TV plans can create 1 complete strategy.
To set your alert messages, open the indicator settings and scroll to the bottom of the "inputs" tab.
Create your alert after you set the messages in the indicator settings, and make sure "Any alert() function call" is set in the alert option.
█ LIMITATIONS
Things to keep in mind when using this strategy.
• No Stop loss
When trading without stop loss, your equity can drop without limit, and it can take a while until price recovers.
This is why when backtesting I recommend to keep an eye on the "Max # Days in trades" statistic which tells the maximum days a trade took to close in profit.
• Spot markets only
Obviously, trading without stop loss means no leverage.
█ BACKTEST RESULTS
The backtest settings used in this snapshot are the following:
Initial Capital: 10 000€
Order size: 1 000 €
Commission: 0.1€ per order
Slippage : 10 ticks
Please read the author instructions below for access and automation.
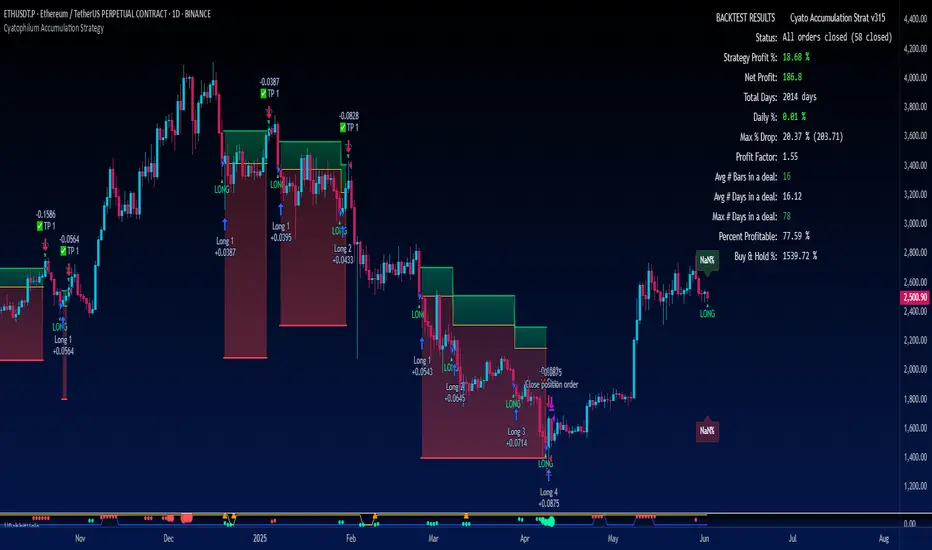
Cyatophilum VWAP StrategyAn indicator to backtest and automate VWAP custom strategies.
Use the Trend Mode to create Swing Trading strategies or Rotation Mode for Intraday Trading.
Configure your strategy using the Entry Condition Builder and Risk Management features, such as Trailing Stop & Take Profits, Safety Orders, and VWAP Exit conditions.
═════════════════════════════════════════════════════════════════════════
█ HOW IT WORKS
VWAP stands for Volume Weighted Average Price.
It is like a simple moving average that takes volume into account.
It is used by a lot of traders since it has everything one needs to know: price and volume.
The cummulated volume calculation resets every session, which interval can be configured.
From that we can calculate the MVWAP and the Standard Deviation Bands and create strategies around that.
█ HOW TO USE
Trend Mode
Trend Mode is the name for strategies built upon VWAP and price/MVWAP cross, most often for Swing Trading on high timeframes trending markets.
The side traded is often long and trying to beat Buy & Hold.
The trade exit can be triggered by a reversal signal (top chart), or a trailing stop (bottom chart) and take profit.
Rotation Mode
This is the mode for Intraday on low timeframes. It will work best on ranging markets.
We use the Standard Deviation Bands to buy/sell the price at overbougth/oversold levels.
The indicator allows to create complex entry conditions such as "Break out of 3rd bands AND break back in 2nd bands" within a certain amount of time.
We will use either the exit options to close the trade when prices reach an opposite band, or the risk management features explained below.
█ FEATURES
• VWAP settings
Configure the VWAP.
• Entry settings
Choose to go long, short, and if the strategy should reverse or not.
• Trend Mode
Choose to create entries from VWAP cross with price or MVWAP.
• Rotation Mode
Configure the 3 bands and build a condition for entry. The multiple inputs allow to add up different events required to trigger an entry, using 3 logical gates that can be linked together using a AND or OR condition. The events being: "break out", "Break back in" or "Just touches" any of the 3 bands. The condition must be met within a certain period of time to be valid.
• Exit settings
Options to exit trades at the end of every session or when the price reaches an opposite band.
• Stop Loss & Take Profit
Configure your stop loss and take profit for long and short trades.
You can also make a trailing stoploss and a trailing take profit.
• Safety Orders (DCA)
Create a strategy with up to 100 safety orders.
Configure their placement and order size using the price deviation, step scale, take profit type (from base order or total volume), and volume scale settings.
Graphics
A Configuration panel with all the indicator settings, useful for sharing a strategy.
A Backtest Results panel with buy & Hold Comparator.
█ ALERTS
Configure your alert messages for all events in the indicator settings.
Then click "Add Alert". In the popup window, select the option "alert() function calls only", give the alert a name and you are good to go!
█ BACKTEST RESULTS
The backtest settings used in this snapshot are the following:
Initial Capital: 10 000€
Order size: 10% equity
Commission: 0.1€ per order
Slippage : 10 ticks
Please read the author instructions below for access.
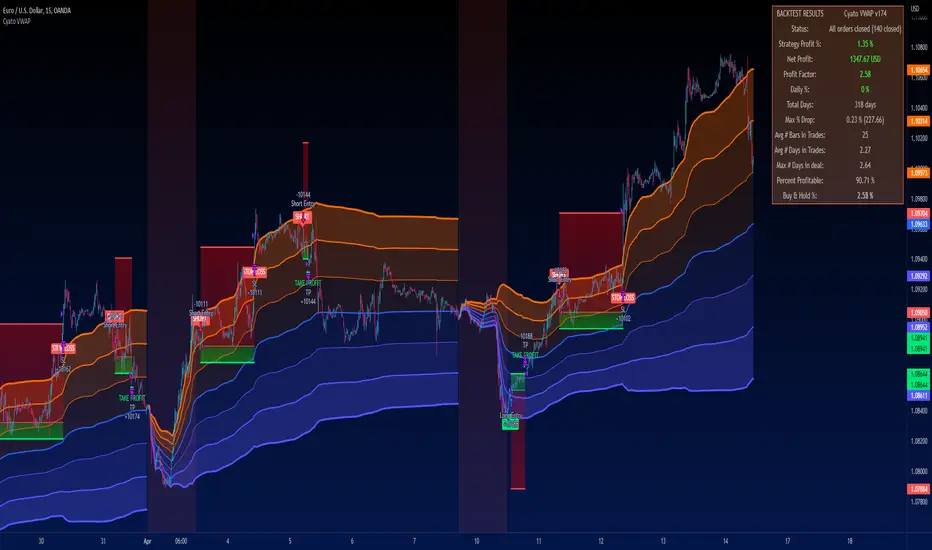
GEMA-Estrategia por neil-------------------
DESCRIPTION
GEMA-STRATEGY is a strategy generator based on SMA, EMA, WMA, RMA that considers elements such as ADX, DMI, RSI, stochastic, Stoploss, Takeprofit, angles and values at present point.
HOW DOES IT WORK
The component works as an assistant to which you configure the previous elements and you see the performance that it offers you, in such a way that you pass that configuration to GEMA-INDICATOR so that you can receive alerts and do visual trading with notifications or automated trading by sending messages to platforms like 3Commas.
WHY USE IT
The resource operates with one of the most important strategies in the market, which is the price tracking line, which means that if prices go up, we follow it, if prices go down, we follow it; in this way you do not need to make large investments as is often the case with pure BOTs, which require large reserves for security orders.
HOW TO USE IT
Press the "Indicators" option, go to the "Public Library" segment, write the name "GEMA-Estategia por Neil", double click on the record in question and you will have it added in your work panel, now, it only remains to use it and configure its parameters.
-------------------
DESCRIPCIÓN
GEMA-ESTRATEGIA en un generador de estrategias basado en SMA, EMA, WMA, RMA que considera elementos como ADX, DMI, RSI, Estocastico, Stoploss, Takeprofit, ángulos y valores a punto presente.
COMO FUNCIONA
El componente funciona como un asistente al que vas configurando lo elementos anteriores y vas viendo el rendimiento que te ofrece, de manera tal, que pases esa configuración a GEMA-INDICADOR para que puedas recibir alertas y hagas trading visual con notificaciones o trading automatizado enviando mensajes a plataformas como 3Commas.
POR QUÉ USARLO
El recurso opera con una de las estrategias mas importantes del mercado, que es la linea de seguimiento de precio, lo que significa que si los precios suben, lo seguimos, si los precios bajan, lo seguimos; de esta manera no necesita realizar grandes inversiones como suele ocurrir con los BOT puros, que exigen grandes reservas para las ordenes de seguridad.
COMO USARLO
Presione la opción "Indicadores", ubíquese en el segmento "Libreria Publica", escriba el nombre "GEMA-Estrategia por Neil", haga doble clic sobre el registro en cuestión y lo tendrá agregado en su panel de trabajo, ahora, solo resta usarlo y configurar sus paramertos.

Ultimate MACD Strategy [PrismBot] [Lite]Included in this Ultimate MACD Lite Strategy:
✔️ Tweak a multitude of specific settings (MA lengths, R:R, SL distance etc)
✔️ Enable advanced setup filters
✔️ Use money management and risk calculations
✔️ Draw trade info directly to chart (eg. SL size in percent, win rate etc)
✔️ Use various filters (eg. time filter, date filter, MA slope angle etc)
✔️ Manage risk per position when auto-trading forex through AutoView
✔️ Choose from various alert conditions!
✔️ Sync to any bot or algorithmic trading system
Some details about this strategy:
LONG SIGNAL
When the MACD is below the zero line of the histogram, close is above the 200EMA, and the MACD line crosses above the signal line, longs are taken
SHORT SIGNAL
When the MACD is above the zero line of the histogram, close is below the 200EMA, and the MACD line crosses below the signal line, shorts are taken
A couple of options are given for how to calculator stop losses.
The Take profit is calculated by the risk of the stop loss. So a 1.5 take profit target is 1.5 times the stop loss added to the entry price.
There is also an option to filter out trades by the histogram deviation. This prevents crossovers that are too close to the histogram from being taken.
Please note I used the code for the PPO instead of the traditional MACD to make calculating these percentage deviations more consistent across multiple asset types.
You can easily enable and disable strategies using the checkbox.
This strategy incorporates a risk to reward system where the user can select between ATR and Percent based stop losses and take profit targets. This means that the user has much better control over money management when utilizing this strategy and it doesn't require you to babysit the strategy to ensure it's entering and existing strategies in an ideal place.
You can also enter custom messages for alerts for use with bots (set alerts to "alert() function calls only")

Volatility Stop Strategy [frostybot]This is a modified version of the Standard Volatility Script on TradingView, tweaked for the BTCUSD chart on the 1H timeframe.
I've designed this strategy to be used with Frostybot with ease.
However, this can be disabled in the settings. Then you will receive alerts without Frostybot commands.
First, open the settings section of the indicator. Then fill in the following fields:
You can play around with the TP values and see what works best for your personal risk assessment
Account Stub: enter the name of your stub on Frostybot (only needed if you enable the "Use Frostybot Alert Triggers" checkbox)
Position Size and Size Type: Here you can choose the amount on which you want to enter the trade, for example: 100$, 2x,... (only needed if you enable the "Use Frostybot Alert Triggers" checkbox)
Symbol: Enter the BTC symbol that is valid for the Frostybot Stub's Exchange. For FTX: BTC-PERP, for Binance Futures: BTC /USDT,... (only needed if you enable the "Use Frostybot Alert Triggers" checkbox)
Press OK
Then, setup an alert on the strategy:
Configure the correct Frostybot Webhook URL (don't forget to add /frostybot after the IP address) (only needed if you enable the "Use Frostybot Alert Triggers" checkbox)
Give the alert a name of choice
Put this as the message: {{strategy.order.alert_message}}
Press OK
Enjoy and happy trading!
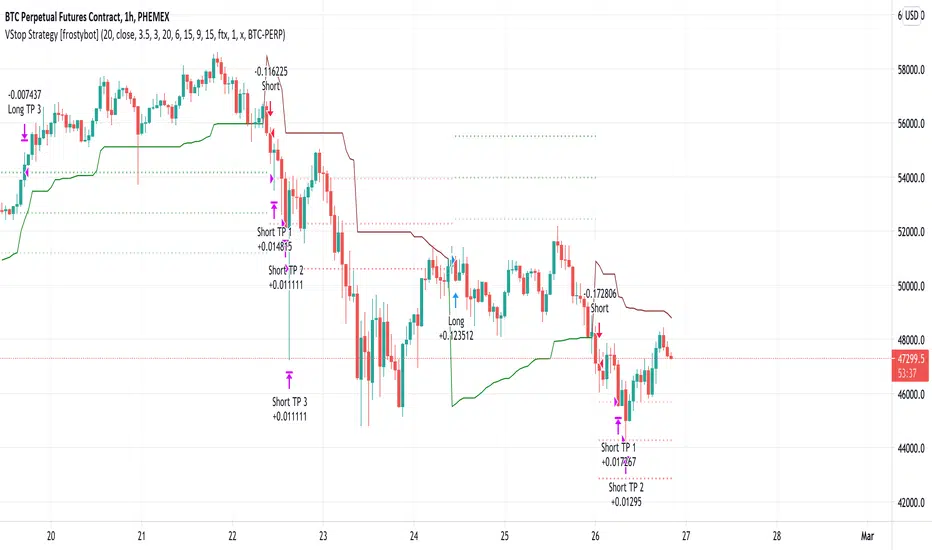
T3-CCI Strategy [SystemAlpha]This is a strategy based on FX Sniper's T3-CCI indicator. Instead of using just the normal buy and sell signal, we added an option to use trend filters, trailing stop loss and take profit targets.
In this strategy you have a choice of:
Trend Filters:
- Average Directional Index ( ADX ) – buy when price is trend is up and sell when trend is down.
- Moving Average (MA) – buy when price close above the defined moving average and sell when price close below moving average
- Parabolic SAR – buy when SAR is above price is above price and sell when SAR is below price.
- All - Use ADX , MA and SAR as filters
For MA Filter , you can use the “TF MA Type” and "TF MA Period" parameter to select Simple or Exponential Moving Average and length.
Stop Loss:
- Average True Range (ATR) – ATR % stop as trailing stop loss.
- Parabolic SAR ( SAR ) – Parabolic SAR adapted as trailing stop loss.
For ATR , you can use the “ATR Trailing Stop Multiplier” parameter to set an initial offset for trailing stop loss.
Take Profit Target:
- Average True Range (ATR) – ATR % stop as trailing stop loss.
- Standard % – Percent as target profit
For ATR , you can use the “ATR Take Profit Multiplier” parameter to set an initial offset for trailing stop loss.
Additional feature include:
- Show Bar Colors
STRATEGY ONLY:
- Set back test date range
- Set trade direction - Long, Short or Both
- Use timed exit - Select method and bars
- Method 1: Exit after specified number of bars.
- Method 2: Exit after specified number of bars, ONLY if position is currently profitable.
- Method 3: Exit after specified number of bars, ONLY if position is currently losing.
TradingView Links:
Alerts:
T3-CCI Indicator:
Advance ADX:
How to use:
1. Apply the script by browsing through Indicators --> Invite-Only scripts and select the indicator
2. Once loaded, click the gear (settings) button to select/adjust the parameters based on your preference.
3. Wait for the next BUY or SELL signal to enter the trade!
Disclaimer:
The indicator and signals generated do not constitute investment advice; are provided solely for informational purposes and therefore is not an offer to buy or sell a security; are not warranted to be correct, complete or accurate; and are subject to change without notice.
