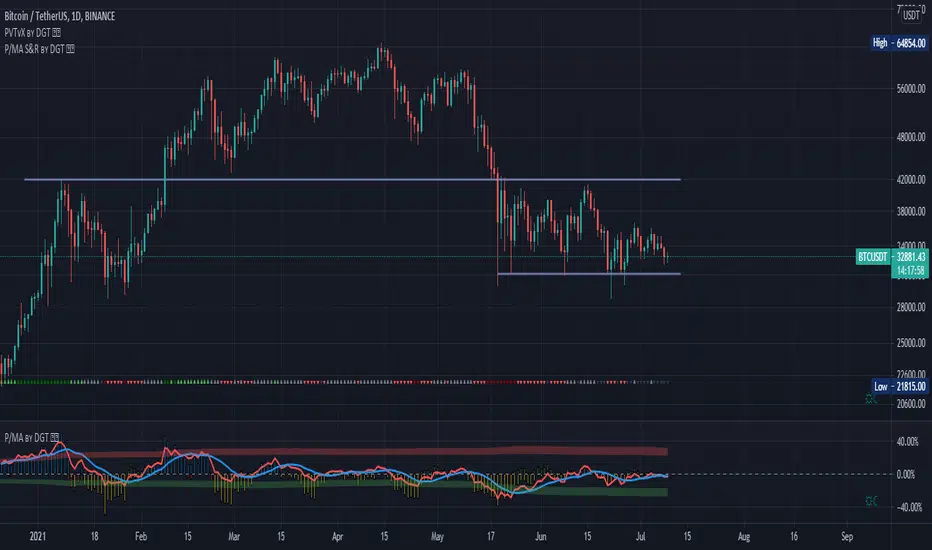
Distance Oscillator - Support and Resistance by DGT
Prices high above the Moving Average (MA) or low below it are likely to be remedied in the future by a reverse price movement as stated in the article by Denis Alajbeg, Zoran Bubas and Dina Vasic published in International Journal of Economics, Commerce and Management
This study is the third variant that aims to present this idea, and the output of the study is presented as lines that serve as possible support and resistance levels in the future.
1st variant of the idea is presented as an centered oscillator, link to Price Distance to its MA Study , within its description you may find more about the idea and some statistical observations. Also some derivatives with MACD-X, More Than MACD and P-MACD
2nd variant of the idea are presented as colored triangle line (Volatility Colored Price/MA Line), using the same calculation methods and presented in the bottom of price chart.
Link to studies where it is included : Colored Directional Movement and Bollinger Band's Cloud , SuperTrendRange and Pivot Points vX
3rd variant (this study) as stated earlier aims to present the same idea as support and resistance levels.
Options
The users can adjust source and length of the moving average that is used as base for the distance oscillator
Signal triggering options includes length for the deviation bands, multiplier as well as smoothing of the oscillator
Line customization settings
Additionally an alert can be configured to be warned earlier to watch out for probable pullbacks or reversals
Technical details for whom interested
Calculating the price distance to the MA results in a centered oscillator lets call it Distance Oscillator (quite similar to the RSI), as shown in the blow chart
Unlike RSI, oscillations with the distance oscillator are not limited within a specific range, hence identifying overbought and oversold is not as straight forward as it is with RSI. To determine overbought and oversold levels, standard deviation of distance oscillator is calculated and bands generated with the same approach applied with Bollinger Bands.
Once we have the threshold bands then crossing those bands we may assume as important levels and draw a line, if oscillator values keeps above the threshold bands (deviation bands) the logic behind the code will update the line drawing accordingly.
To reduce noise a smoothing can be applied
Alerts :
Please note that the implementation applied here can be applied to any oscillator such as RSI, Stochastic, MFI etc even Volume (if bear candle volumes are multiplied by -1)
Disclaimer :
Trading success is all about following your trading strategy and the indicators should fit within your trading strategy, and not to be traded upon solely
The script is for informational and educational purposes only. Use of the script does not constitute professional and/or financial advice. You alone have the sole responsibility of evaluating the script output and risks associated with the use of the script. In exchange for using the script, you agree not to hold dgtrd TradingView user liable for any possible claim for damages arising from any decision you make based on use of the script
חפש סקריפטים עבור "alert"
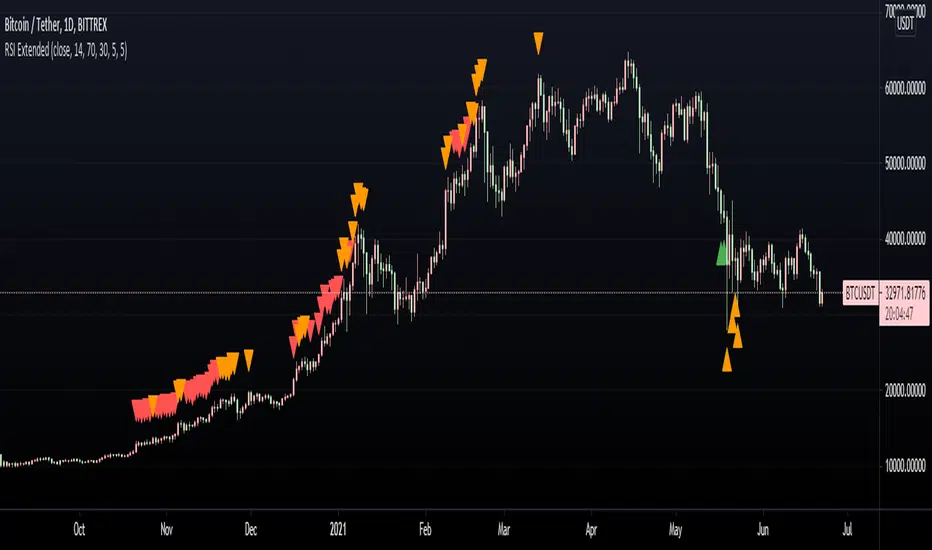
RSI ExtendedThis script is intended to print signals on the main price chart and send alerts when the RSI is overbought or oversold.
You can customize the source of the signal (open, close, etc), as well as oversold/overbought levels, and RSI length.
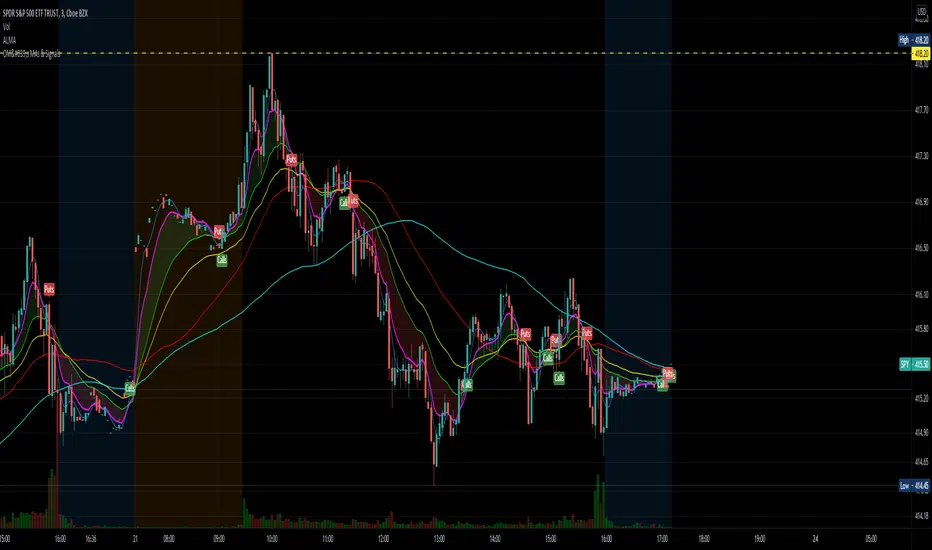
OptionsMillionaire SPY Moving Averages and Signalsby ColeJustice
OptionsMillionaire's SPY Options trading system is based mainly on these indicators:
- 8 EMA*
- 21 EMA*
- 100 SMA*
- 200 SMA*
- MACD
- RSI
- Squeeze Momentum
(*provided by this indicator)
and follows these rules:
|
| 1) I never fight the trend. If its green, i buy calls. If its red, i buy puts. I will only buy puts on a green day if there is a overall change in market trend. Inversely, calls on a red day
| 2) Price action is my #1 indicator. I wait for it to confirm my thesis before i enter a trade
| 3) I only trade SPY Options
| 4) My baseline is to choose a call/put that has a DTE (Date To Expiration) 6-7 days out, with a strike $2-$3 away. I adjust that to fit my current appetite for volatility. i virtually never play same day DTE's.
| 5) I set a 10% stop, but usually exit at 8% before my stop triggers depending on current situation
| 6) I utilize about 10-20% of my Portfolio for one trade. Sometimes more. Rarely less.
| 7) I never hold overnight in these market conditions.
| 8) I shoot for 10-20% for gains. Depending on market conditions.
| 9) Always look for confirmations in your indicators.
| 10) I never force a trade. No trade is a good trade too if the entry just isn't there.
| 11) Patience always pays off. A great set-up can form in minutes or seconds. I never regret being patient to enter. I nearly always regret rushing into a trade.
|
This indicator combines the moving averages into a single unit to simplify one part of the indicator usage rules: the 8 EMA / 21 EMA Cross. . The 8 crossing over the 21 is a Bullish signal, while the 8 crossing under the 21 is a Bearish signal. This indicator places flags at these crossover/under points, as well as shading the area between the 8 and 21 EMAs to help visualize the strength of the trend; green during a Bullish cross, and red during a Bearish cross.
A new addition to this strategy is the Hull Moving Average, or HMA. This script defaults to an HMA of 20 and shows alerts when candles close above or below the plot in the form of green and red candle backgrounds. This alert is best used in conjunction with the main crossovers and should be considered an addition level of confidence rather than providing trade entry/exits directly. This indicator is more flexible and you should feel free to adjust the period if you find a different value works better within your own personal trading style.
Each individual element of this indicator can be modified or toggled, providing maximum customization. While you should strive to become comfortable with the default settings, these options are provided in case you feel the need to adjust for your own style (or if testing on tickers other than SPY, for example).
Goodluch, and happy trading!
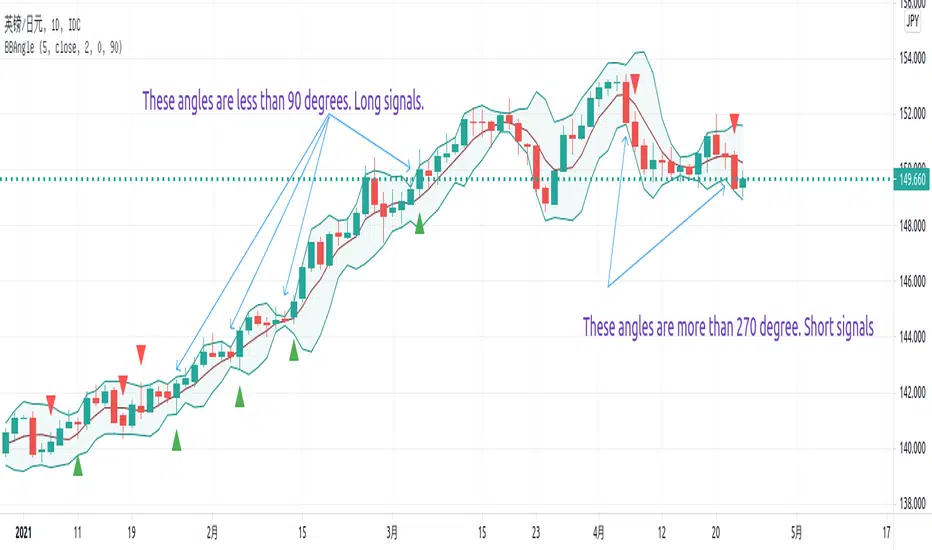
Angle of Bollinger Bands AlertThis script is used to calculate angle of Bollinger Bands and also setup alerts.
The angle is based on the rules:
- if the previous 2 is 1.1, previous 1 is 1, and the current is 1.1, then the angle should be 90 degrees.
- if the previous 2 is 0.9, previous 1 is 1, and the current is 0.9, then the angle should be 270 degrees
If upper angle is below 90 degrees and close is above the average, it is long signal.
If lower angle is above 270 degrees and close is below the average, it is short signal.
- It is good for catch trend trading.
- Not good for swing trading as the BB changes are very tiny but angles for upper may hit below 90 degrees or angle of lower may be above 270 degrees.
RSI-VWAP Indicator %█ OVERALL
Simple and effective script that, as you already know, uses vwap as source of the rsi, and with good results as long as the market has no long-term downtrend.
RsiVwap = rsi (vwap (close), Length)
The default settings are for BTC in a 30 minute time frame. For other pairs and time frames you just have to play with the settings.
█ FEATURES
• The option to start trading from a certain date has been added.
• To make the profit more progressive, a percentage of your equity is used for entries and a percentage of your position is used for closings.
• The option to trade in Spot mode has been added, since, for the TradingView backtest, the money is infinite and if you do not limit it somehow,
it would offer you much better profits than the live trading.
QuantityOnLong = Spot ? (EquityPercent / 100) * ((strategy.equity / close) - strategy.position_size) : (EquityPercent / 100) * (strategy.equity / close)
• The option to stop the system when the drawdown exceeds the fixed limit has been added.
Drawdown, as you already know, is a very important measure of risk in trading systems.
The maximum drawdown will tell us what the maximum loss of a trading system has been during a period. This maximum loss is determined by:
strategy.risk.max_drawdown(Risk, strategy.percent_of_equity)
• Leverage plotted on labels added.
█ ALERTS
To enjoy the benefits of automatic trading, TradingView alerts can be used as direct buy-sell orders on spot, or long-close orders with leverage.
Currently there are Chrome extensions that act as a bridge between TradingView and your Exchange or Broker.
This is an example of syntax for this type of extensions. Copy and paste a message like this into the alert window:
{{strategy.order.action}} @ {{strategy.order.price}} | e = {{exchange}} a = account s = {{ticker}} b = {{strategy.order.action}} {{strategy.order.alert_message}}
█ NOTE
Certain Risks of Live Algorithmic Trading You Should Know:
• Backtesting cannot assure actual results.
• The relevant market might fail or behave unexpectedly.
• Your broker may experience failures in its infrastructure, fail to execute your orders in a correct or timely fashion or reject your orders.
• The system you use for generating trading orders, communicating those orders to your broker, and receiving queries and trading results from your broker may fail.
• Time lag at various point in live trading might cause unexpected behavior.
• The systems of third parties in addition to those of the provider from which we obtain various services, your broker, and the applicable securities market may fail or malfunction.
█ THANKS
Thanks to TradingView, its Pine code, its community and especially those Pine wizards who post their ideas that helps us to learn.
If the world is heading toward a equitable new world economic order, let's get rich first ...
Happy trading!

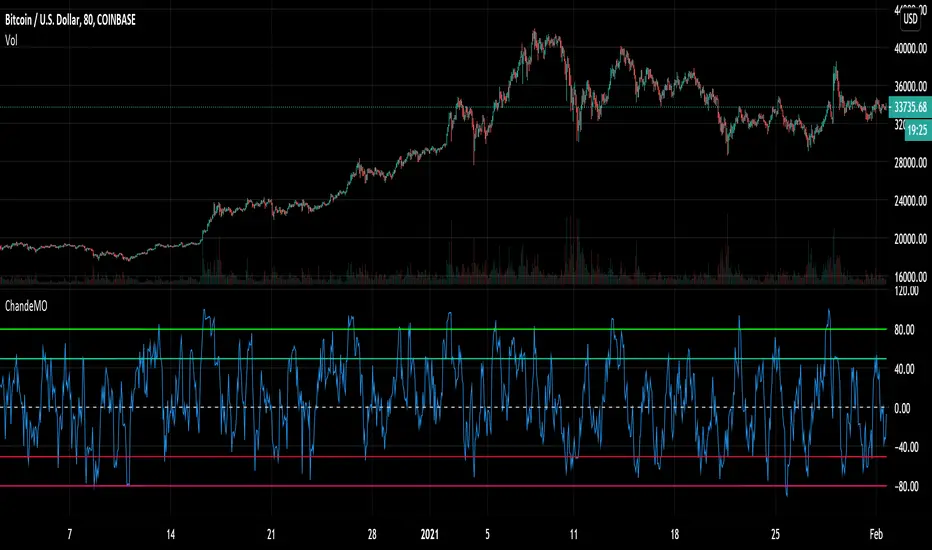
Chande Momentum Oscillator - Alerts and RegionsIt seemed weird to me that the default Chande didn't have overbought and oversold regions, despite them being described for Chande Momentum and working very well. So I added the lines and alert conditions. I've used this to very good results in my day trading.
My strategy involved 4 timeframes of candlestick, each with 4 timeframes of Chande overlaid. Candlesticks are 5 min, 20 min, 80 min, 320 min and Chandes are x1, x2, x4 and x8 of the relevant time zone. Give it a shot. Use the 5 min Chande as Buy and Sell signal with the other timeframes for trend confirmation. You may get a lot of extra alerts with this setup, but it's almost impossible to really miss an opportunity if you use it right. It will take up all your free time though, as a warning. Using this strat made me go crazy.
Use the chande crossing over the lines as the signal, not just being in the region, as that will make you buy early.
Modified Smoothed Heiken AshiThis code is based on Smoothed HA candle which will work on all chart types
condition for BUY:
1. When close crosses Smoothed HA
2.Close should be in side upper band
3.BBW must be greater than the average
vice versa for sell
this code takes data from HA chart so that it can be applied on all chart type.
Bollinger band and Bollinger band width conditions added for removal of unwanted signals
Alert added so that you can apply alert and check it in real time performance
thanks to The Secret Mindset You tube channel from where I got the idea to convert this into a pine script indicator
smooth HA taken from "Smoothed Heiken Ashi Candles v1" at //@jackvmk

Williams Fractals with Alerts by MrTuanDoanCustom William Fractals for alerts and educational purpose.
Added custom alerts for Williams Fractals.
Also added filter to show less fractals on chart.
The simple idea how I use fractals in Binary Option is to determine temporary resistance and support.
Simple strategy:
- Mark Resistance/Support on higher time frame (e.g. 5M)
- Set an alert for new fractal
- Whenever a new fractal that appears close to your marked Resistance/Support, go to lower time frame (e.g. 1M)
- Wait for rejection at the level that lower than new down fractal (or higher than new up fractal).
- Enter with the same expiry of lower time frame.
Good luck and happy trading. :-)

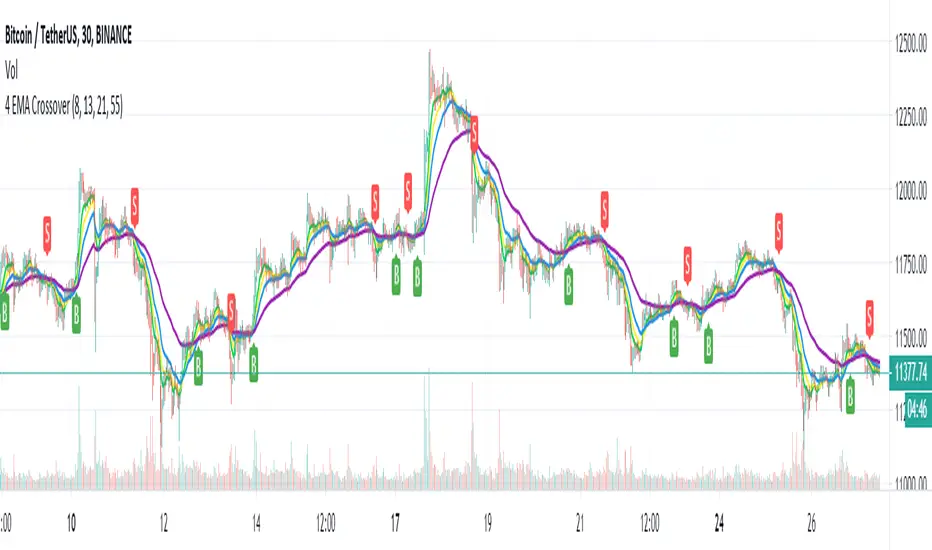
4 EMA Crossover w/alerts4 EMA crossover visualized (buy/sell) w/ alerts.
Personally I use 8, 13, 21 & 55 for LTF's and 21, 55, 100 & 200 for HTF's
[A618] Vortex Indicator Alert Screener [Noise Filtered]This Indicator helps you get alerts from Vortex Indicator if a trend is Established.
One of my followers asked me to do this: @Kiran_05
How this is made ?
1. Vortex Crossovers are taken into consideration in a noise filtered manner
2. Noise filtering is done by trend establishment due to Ehlers 2 pole ButterWorth Filter and EMA50 Crosses
How to use it ?
1. Can be used as a screener on the Script to generate the screened Securities from a Watchlist of Securities
2. Wait for a Candle break above of the generate green signal to get into trade, and vice versa
Credits :
@CheatCountry
For Ehlers 2 Pole Butterworth Filter V2
Hope this Helps

Ehler Stochastic Cyber Cycle Signals/AlertsThis script works based on @everget's version of Ehler Stochastic Cyber Cycle. Unlike @everget's work, my adaptation prints only crossovers into the chart that occur above or below the overbought/oversold zone.
You can find @everget's script with all related documentation here
I didn't change the calculation, I only reinvented how it is presented on the chart and added alerts.

QQE signalsConverted the QQE oscillator to in-chart long and short signals with built in alerts. This is multi-timeframe and quite robust.

Growing or Waning Patterns [Alerts]Example how to color patterns of 3 bodies growing or waning by percentage with or without trend. Also included option for alert triggers. The yellow triangles on the chart denote where the alert triggers will fire.
• Choose Pattern Of Filter: shows bodies growing or waning or both.
• Sample Lengths Of AvgBar: number of recent bars to use for average size.
• BigBar Is Min% Of AvgBar: the minimum percent of average the big bar must be.
• MedBar Is Max% Of BigBar: the maximum percent of big bar the medium bar can be.
• SmlBar Is Max% Of MedBar: the maximum percent of medium bar the small bar can be.
• Repeat Pattern If n Bars: the number of bars to ignore repeat patterns, 1 allows all.
• Trending: on requires the growing or waning patterns to also be trending.
• GrayBars: colors non pattern bodies gray.
NOTICE: This is an example script and not meant to be used as an actual strategy. By using this script or any portion thereof, you acknowledge that you have read and understood that this is for research purposes only and I am not responsible for any financial losses you may incur by using this script!

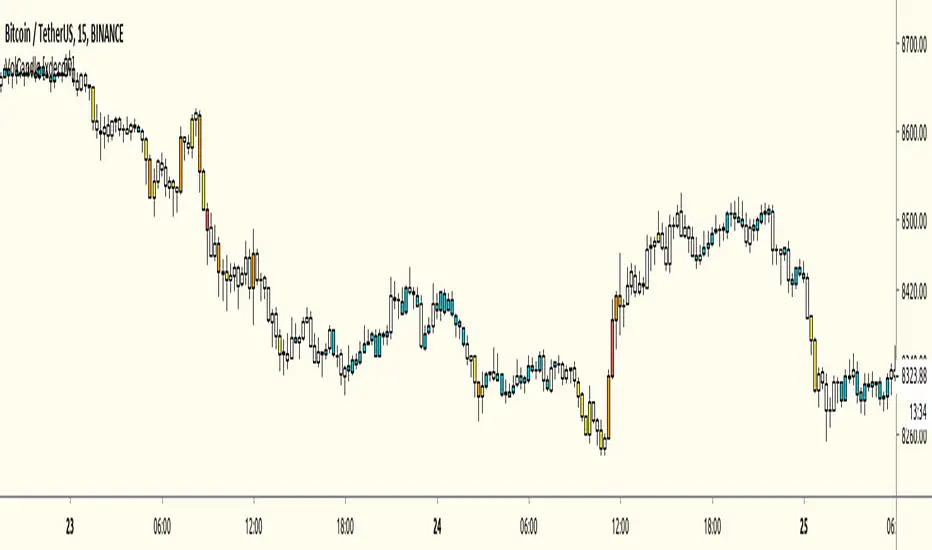
Volume on Candles + Alerts [xdecow]Volume-based candle colors with alerts.
5 threshold levels:
-Extra High (red)
-High (orange)
-Medium (yellow)
-Normal (white)
-Low (aqua)
Multi Timeframe ADX and DI w/ AlertsThis script is based off the public DMI code and used to get a quick visual of trend and direction across 3 different timeframes. Alert conditions have been setup for trend changes to bull/bear for all 3 timeframes. This script is meant to pull together the concepts of multi-time frame indicators, custom functions, and custom alert conditions.
The primary instructions for this script was to find a version of the ADX Indicator and give it the same treatment as we did with the Heiken Ashi demo (displaying green/red/gray circles to indicate trend and direction) over a configurable time frame. Display a matrix of each timeframe and the corresponding directional color (green=bull, red=bear, gray=non-trending). Have it produce an alert when the state of indicator changes to either bull or bear.

Study for Squeeze Momentum Indicator [LazyBear]This study is based on LazyBear Squeeze Momentum Indicator and my strategy developed using it.
I added some custom feature and filters.
Main improvements are:
1- study is updated to version 4 of pine script;
2- I added alerts for entry rules and exit rules.
3- Alert syntax can be customized for webhooks: I added one example only for long entry.
You can customize a lot of features to get a profitable strategy.
Here is a link to original study.
Please use comment section for any feedback.

MFI/RSIThis is a simple study that combines MFI and RSI and provides buy/sell alerts.
The red lines are MFI.
the blue lines are RSI.
Boundries are colored as the indicators and are user configurable.
Black triabgles are buy/sell points when both MFI and RSI are overbought/sold.

Moving Average Cross AlertMoving Average Cross Alert, Multi-Timeframe Option (MTF) (by ChartArt) with buy sell alerts added
Significant PP - Swing Failure / Stop Run Alerts [QN]Tried to create a script for Swing Failure / Stop Run patterns. It is based on my QuantNomad - "Significant Pivot Reversal" Indicator.
It's quite tricky to code these kinds of patterns, so it's really not ideal. I alert when a candle cross pivot level but close below (above for bottom) it and previous close was below (above) it as well.
You can setup params for pivot points and also by how much it should cross pivot level with "SF ATR Mult".
I have in mind a few other things I'd like to test:
* Different types of pivot points
* Few recent pivot levels at once
* Pivots from higher timeframe
* Different types of "touching" levels
* etc.
Ideally, I want to create a strategy from it, but I'm far from it for now.
Do you have any ideas on how to make it better?
Original Significant Pivot Reversal Indicator:

EMA20 MA50 MA200 + T3-CCIEMA20 MA50 MA200 + T3-CCI
This combination of triple Moving Average and CCI is a strategy to be used in conjunction with Harmonical Patterns and Fibonacci Rations .
Heikin Ashi price can be used as the price source for the Moving Averages and the T3-CCI, instead of the real price.
Two instances of the indicator can be spawned to have both the triple MAs and the T3-CCI on the chart (L-Click on the Indicator > Move To > New Pane Below).
Alerts are available to warn of possible opportunities in the markets .
A single alert that can fire on both conditions can be set. It can also be used by other indicators, such as the Risk Management Wrapper .
Additional Technical Analysis is required to confirm the signals before opening a position.
This indicator is an update to MA50 EMA20 MA200 .

Open Close Cross Alerts NoRepaint Version by JustUncleLThis is a Non Repaint version of my ever popular "Open Close Cross Alert R6 by JustUncleL" and is normally used in conjunction with my strategy script "Open Close Cross Strategy NoRepaint Version by JustUncleL", to provide alerts for the TradingView Alarm subsystem.
Brandon BollSecond day at Pinescript and I am attempting to tweak the Bollinger Bands directed strategy to send alerts to Zignaly in order to automate long buy/sells.
I've left in the short script though for completeness.
The buy and sell instructions work perfectly but I don't know how to do a cancel order alert (as included in the original strategy)

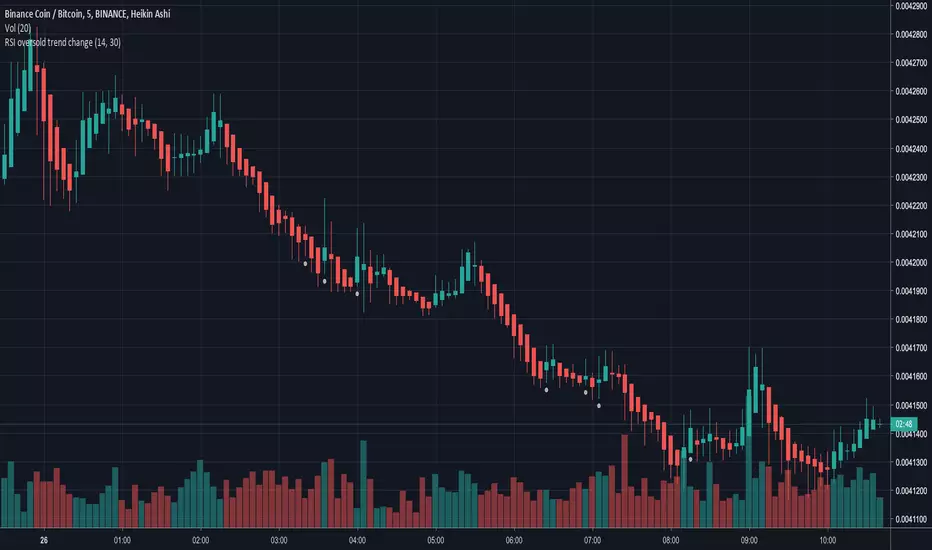
RSI oversold trend changeSimple script that will plot a circle indication on the chart when RSI returns above 30 from oversold position.
Also allows you to create a custom alert.