חפש סקריפטים עבור "alert"

Harami Reversal Alerts BB Touch (Strict First Candle)Harami Reversal Alerts BB Touch (Strict First Candle)
Harami Reversal Alerts BB Touch (Strict First Candle)Harami Reversal Alerts BB Touch (Strict First Candle)Harami Reversal Alerts BB Touch (Strict First Candle)Harami Reversal Alerts BB Touch (Strict First Candle)Harami Reversal Alerts BB Touch (Strict First Candle)

Gamma Levels w/AlertsPlots Gamma Levels for identifying Market Positioning. Has alert function on the specific levels.
---To apply to different tickers You Must:
1. apply to chart layout
2. input ticker specific levels
3. Save as an INDICATOR TEMPLATE titled same as ticker (check the remember symbol box)
Now when switching to different tickers, simply open that template

MACD Divergence auto displayed on chart, with alertsMACD Pivot Divergence Detector
This tool identifies MACD histogram divergences based on confirmed pivot highs and lows.
Instead of comparing swing points on the MACD line, this script focuses specifically on the histogram, which measures momentum shifts between MACD and Signal.
How it works
The script detects confirmed pivots using a two-bar swing structure.
When price breaks above a previous pivot high, the script compares the MACD histogram value at that pivot to the current histogram value:
• If price makes a higher high while the histogram makes a lower high, a potential bearish divergence is marked.
The reverse logic is applied for bullish divergence when price breaks below a pivot low.
What makes this script unique
It uses pivot-confirmed histogram values, not lookback-based divergence.
It evaluates divergence only at actual highs/lows, reducing false positives.
It marks divergence directly on the candles for visual clarity.
Alert conditions are included for automated detection.
How to use
Bullish signals may highlight potential momentum loss in downtrends; bearish signals may highlight momentum loss near highs. Divergence does not guarantee reversal and should be combined with broader context, structure, or trend analysis.

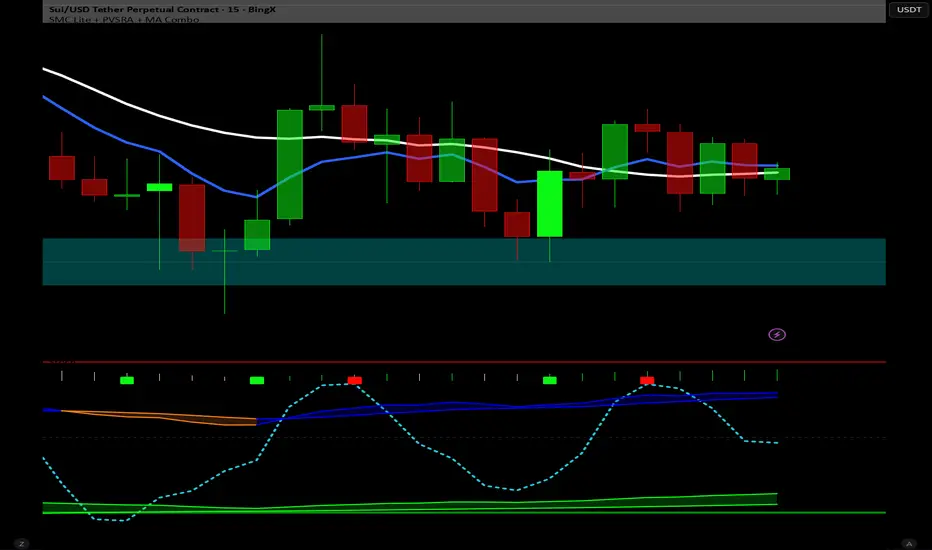
SCOB Pattern with ERC & AlertsSingle Candle Block (SC0B) consists of a single candle appearing at a significant price level, indicating a confirmed reversal in price direction from that particular area of interest.
SCOB is primarily used to confirm and execute trades.
Using a single candle block to enter a trade minimizes risk and maximizes reward.
Single bullish candle block?
1st candle closes at bullish point of interest with a short or long wick.
2nd candle sweeps the low of previous(1st) candle and closes above the low of previous candle.
3rd candle closes above the high of 2nd candle.
How to trade with Scob bullish.
To Trade using Bullish SCOB you have to wait for price to come down and test the single candle order block.
When price tests the SCOB you can directly execute a buy trade or for a precise entry you can wait for a market structure shift in lower time frame.
Scob discount is the opposite of price increase.
This strategy should only be used when price "sweeps through key lever, liquidity, imbalance, poi htf areas.
This indicator will add a filter to help you reduce signal noise.
Use the "Use engulfing candle to test" function to filter the 3rd candle.
Only search for Scob if the 3rd candle is an Engulfing candle.
The logic for finding Engulfing candles can be changed based on the "% maximum wick length" option. The default is that the candle wick is 25% of the total candle wick length.
You can also use the alert function when Scob appears
With Smart money concept, no strategy is perfect in trading, so you should not risk too much of your capital on this strategy.
To be safer, always remember to use stop loss for every trade.

Dual MACD With Pilot Background + + Stoch RSI Alert HELL 2macd 1 chart time macd 2 4x chart time with over bought and over sold stoc rsi alerts
AI Candlestick Pattern Identifier — Arrows & AlertsAI shows you high confidence candlestick patterns so that you can identify them quickly. Buy/Sell arrows will be placed alongside the pattern to alert you of which direction the indicator believes the market will go, as well as showing you the confidence in that indicator.

Wick % Highlighter + AlertThis indicator indicates when the is a wick grater then 1%, You can also add alerts when the indicator fires

Mag 8 ± VWAP AlertI have been following Mag 7 plus Avgo for directional indicators for overall market. This is a chart that displays those over or under vwap and alerts can be added, ie 4 of 8 are under vwap, etc.

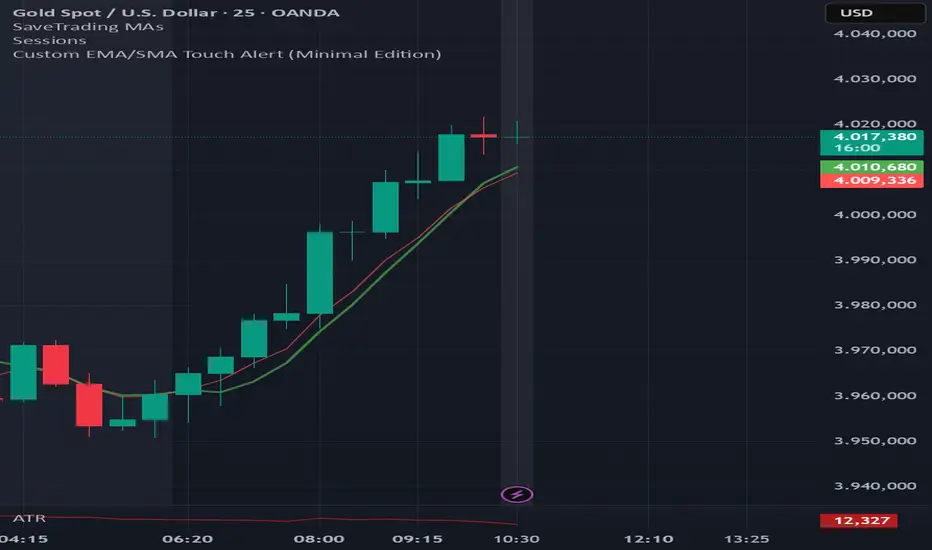
EMA6 or SMA6 Touch AlertThis script monitors the market and notifies you whenever the price touches either the 6-period EMA or the 6-period SMA.
It helps identify potential pullbacks, reaction points, or entry zones, as price interaction with these moving averages often signals short-term market shifts.
What the script does:
Calculates the EMA 6 and SMA 6
Detects if price touches either moving average within the candle
Plots both lines on the chart for visibility
Allows you to set alerts to receive automatic notifications
Best suited for:
Scalping
Day Trading
Pullback Entries
Short-term trend reactions
VIX Overnight Unch or Up AlertThis indicator alerts when VIX opens the day unchanged or higher on the day. If in fact VIX opens up unchanged or higher, it will display near the first bar of the day, previous day's close time and level and the opening time and level. The close time is typically 16:15 New York Time and the opening time is 09:30 or the first print a few minutes later. I use TVC:VIX instead of CBOT because TVC for me is real time. I also use the 1 minute chart and the script is coded as 1 minute.

High Volume AlertThis Pine Script monitors trading volume in real time and alerts you whenever current volume is unusually high — specifically, when it’s greater than a chosen multiple (for example, 1.5×) of the average volume over a recent period (for example, 20 bars).
It’s a quick way to detect volume spikes, which often precede breakouts or reversals.

Koncorde Crossing Screener (UP/DOWN) AlertThis indicators works on Koncorde Crossing Pattern, generating alerts when Cross is Up (buy) and Down (sell).

Strat 2-1-2 Reversal Alerts v2Trying out a new alert! first time. be nice, this will be cool thos!!! woooho
Green & Red Bar AlertsThis indicator identifies when a bar (candle) closes green or red and provides visual markers plus alert notifications.

SMA150 Stop Loss AlertSMA150 indicator that alerts you when stock falls under 150 with additional of -2% (for avoiding early stop-loss)

First Opposite Candle After 3+ (Yellow & Streak Alerts)This overlay tracks consecutive candle direction: when three or more bars run the same way, the very next opposite-color candle is spotlighted in yellow. Two built-in alert events keep you hands-free:
“First Opposite Candle After 3+” – fires the moment that yellow reversal prints.
“3+ Candle Streak” – pings every bar while a bullish-or-bearish run is ≥ 3 candles long.

Double Inside Body Candles with Box & Alert + 5-Bar LinesThis indicator identifies Double Inside Body Candle patterns, where:
Candle 1 is completely inside Candle 2,
Candle 2 is completely inside Candle 3 (the parent candle),
Candle 3 has a real body (not a doji or negligible body size).
Once the pattern is detected:
A label appears below the current candle.
A highlight box is drawn around Candle 3 (the parent candle) body range.
Horizontal lines are drawn from the top and bottom of Candle 3’s body and extend forward for exactly 5 bars to visualize potential breakout levels.
The script also detects and highlights breakouts:
🔼 Bullish breakout: if price closes above Candle 3's body high.
🔽 Bearish breakout: if price closes below Candle 3's body low.
Alerts are available for:
Double Inside Body pattern detection
Bullish breakout
Bearish breakout
Traders can use this script to identify consolidation periods (double inside bars), then monitor for breakout opportunities in either direction, using the 5-bar lines as short-term breakout levels.

ICT Liquidity Sweep MAX RETRI (ALERT)Strategy Description: SMC + ICT Reversal Sniper | 5-Min | R2 TP
This strategy applies Smart Money Concepts (SMC) and ICT methodology to identify high-probability reversal trades using a clean, rule-based system designed for the 5-minute timeframe.
⸻
Core Logic:
• Liquidity Sweep: Identifies stop hunts beyond recent swing highs/lows using a configurable lookback window.
• Break of Structure (BOS): Validates a directional shift after the sweep.
• Fixed R2 Risk-Reward: Entry is followed by a 2:1 take-profit target. Stop loss is set at the sweep candle’s high/low.
• No Entry Between 8 PM–12 AM NY Time: Avoids the manipulation-prone and illiquid zone.
• Discreet SL Handling: SL hits close trades silently — no labels or visuals.
⸻
Entry Precision & Timing Notes:
• The strategy may occasionally fire before a confirmed liquidity sweep — this is expected. If a sweep occurs later, you may still re-enter toward equilibrium, with take profit also targeted at equilibrium.
• Alerts or trades that trigger near 9:30 AM NY often align with real direction, but this time can be volatile.
• For more reliable and lower-risk entries, focus on the 1:30 PM to 2:00 PM silver bullet window, which tends to produce cleaner setups with more favorable flow. 🖤

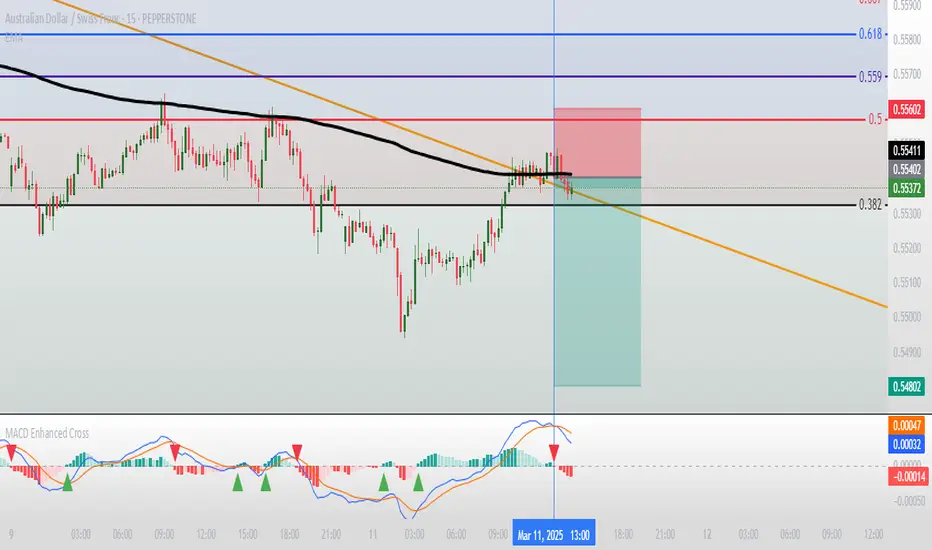
Moving Average Convergence Divergence with Enhanced Cross Alerts
Overview of Features and Settings
- Customizable Parameters:
- Fast and Slow Periods: Users can set the duration for both the fast (default 12) and slow (default 26) moving averages.
- Source Selection: The indicator uses the closing price (close) by default, though this can be modified to any other data source.
- Signal Smoothing: The smoothing period for the signal line is adjustable (default 9), and you can choose whether to use SMA or EMA for both the oscillator and the signal line calculations.
Calculation Logic
1. Calculation of Moving Averages:
- The fast and slow moving averages are computed based on the chosen moving average type (SMA or EMA) over the specified periods.
- The MACD line is then determined as the difference between these two moving averages.
2. Signal Line and Histogram:
- Signal Line: Created by smoothing the MACD line, with the option to choose between SMA and EMA.
- Histogram: Represents the difference between the MACD line and the signal line, visually indicating the divergence between the two.
Detection of Cross Events
The script identifies two specific cross events with additional filtering conditions:
- Bullish Cross:
- The MACD line **crosses above** the signal line.
- The previous value of the histogram is negative, and both the MACD and the signal line are below zero.
- This condition suggests that a cross occurring in the negative territory might indicate a potential upward trend reversal.
- **Bearish Cross:**
- The MACD line **crosses below** the signal line.
- The previous value of the histogram is positive, and both the MACD and the signal line are above zero.
- This condition indicates that a cross in the positive territory may signal a potential downward trend reversal.
For each event, there are dedicated alert conditions defined that trigger notifications when the criteria are met.
Visualization
- Displayed Elements:
- Histogram: Rendered as a column chart with colors that change based on the rate of change. For instance, a rising positive histogram uses a stronger green, whereas a declining positive histogram uses a lighter shade.
- MACD and Signal Lines: Displayed as separate lines with distinct colors to differentiate them.
- Zero Line: A horizontal line is drawn to help visually pinpoint the zero level.
- Crossing Signals:
- Optional markers in the form of arrows appear on the chart:
- **Bullish Cross: A green, upward-pointing triangle at the bottom.
- **Bearish Cross: A red, downward-pointing triangle at the top.
Summary
This indicator not only incorporates the traditional MACD components but also offers the following additional benefits:
- **Enhanced Accuracy:** Extra conditions (such as checking the previous histogram value and the position of the lines relative to zero) improve the identification of significant cross events.
- **Customization:** Users can personalize the moving average types and periods, making the indicator adaptable to different trading strategies.
- **Visual Assistance:** The combination of histogram columns, lines, and markers helps quickly pinpoint potential trend reversals, thereby aiding trading decisions.
This comprehensive description is intended to clearly demonstrate to users how the indicator works, outlining its calculations, filtering conditions, and its role in identifying cross events within technical analysis.
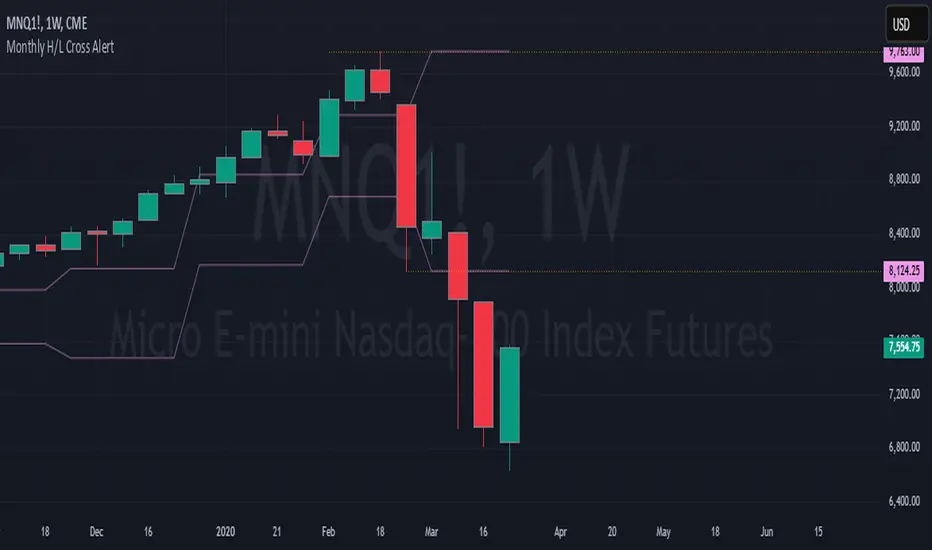
Monthly H/L Cross AlertCreate alerts for when price crosses the previous month's high and low.
You also have the option of plotting the monthly high and low the lower time frame charts.
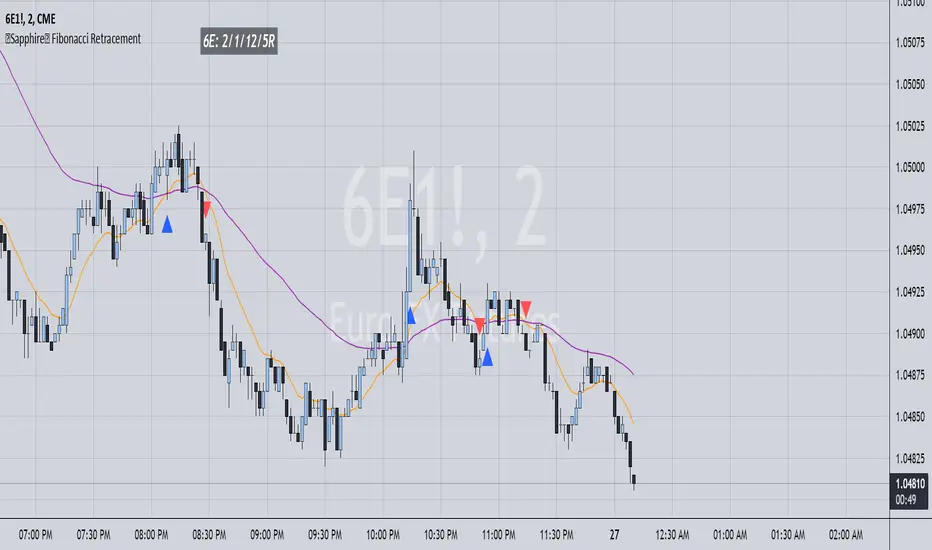
[Sapphire] Fibonacci Retracement + AlertsFibonacci Retracement
This Fibonacci Retracement Indicator utilizes Fibonacci sequence numbers for moving averages and monitors for a crossover of the 13/55 plots.
The option is available to the user if they would like to toggle between an SMA or an EMA for the Fibonacci moving averages.
There is also a trading window built in so you can filter out a certain time of day to show signals if that is preferred.
The signals have alert conditions as well.
In the example, I am using a range chart. I find that it shows a signal much more efficiently as opposed to a time based bar.
Breaker Blocks + Order Blocks confirm [TradingFinder] BBOB Alert🔵 Introduction
In the realm of technical analysis, various tools and concepts are employed to identify key levels on price charts. These tools assist traders in analyzing market trends with greater precision, enabling them to optimize their trading decisions. Among these tools, the Order Block and Breaker Block hold a significant place, serving as effective instruments for analyzing market structure.
🟣 Order Block
An Order Block refers to zones on a chart where large financial institutions and high-volume traders place their orders. Due to the substantial volume of buy or sell orders in these areas, they are often regarded as pivotal points for potential price reversals or temporary pauses in a trend. Order Blocks are particularly crucial when prices react to these zones after a strong market move, acting as strong support or resistance levels.
🟣 Breaker Block
On the other hand, a Breaker Block refers to areas on a chart that previously functioned as Order Blocks but where the price has managed to break through and continue in the opposite direction. These zones are typically recognized as key points where market trends might shift, helping traders identify potential reversal points in the market.
🟣 Overlapping Block (BBOB)
Now, imagine a scenario where these two essential concepts in technical analysis—Order Blocks and Breaker Blocks—overlap on a chart. Although this overlap is not specifically discussed within the ICT (Inner Circle Trader) trading framework, exploring and utilizing this overlap can provide traders with powerful insights into strong support and resistance zones. The combination of these two robust concepts can highlight critical areas in trading, potentially offering significant advantages in making informed trading decisions.
In this article, we will delve into the concept of this overlap, explaining how to utilize it in trading strategies. Additionally, we will analyze the potential outcomes and benefits of incorporating this concept into your trading decisions.
Bullish Overlapping Block (BBOB) :
Bearish Overlapping Block (BBOB) :
🔵 How to Use
The overlap between Order Blocks and Breaker Blocks is a compelling and powerful concept that can help traders identify key levels on the chart with a high probability of success. This overlap is particularly valuable because it combines two well-regarded concepts in technical analysis—zones of high order volume and critical market shifts.
🟣 Here’s how to effectively use this overlap in your trading
1. Dentifying the Overlapping Block : To make the most of the overlap between Order Blocks and Breaker Blocks, begin by identifying these zones separately. Order Blocks are areas where price typically reacts and reverses after a strong market move.
Breaker Blocks are areas where a previous Order Block has been breached, and the price continues in the opposite direction. When these two zones overlap on a chart, it’s crucial to pay close attention to this area, as it represents a high-probability reaction zone.
2. Analyzing the Overlapping Block : After identifying the overlap zone, carefully analyze price action within this region. Candlestick patterns and price behavior can provide essential clues.
If the price reaches this overlap zone and strong reversal patterns such as Pin Bars or Engulfing patterns are observed, it’s likely that this zone will act as a pivotal reversal point. In such cases, entering a trade with confidence becomes more feasible.
3. Entering the Trade : When sufficient signs of price reaction are present in the overlap zone, you can proceed to enter the trade. If the overlap zone is within an uptrend and bullish reversal signals are evident, a long position might be appropriate.
Conversely, if the overlap zone is in a downtrend and bearish reversal signals are observed, a short position would be more suitable.
4. Risk Management : One of the most critical aspects of trading in overlap zones is managing risk. To protect your capital, place your stop loss near the lowest point of the Order Block (for buy trades) or the highest point (for sell trades). This approach minimizes potential losses if the overlap zone fails to hold.
5. Price Targets : After entering the trade, set your price targets based on other key levels on the chart. These targets could include other support and resistance zones, Fibonacci levels, or pivot points.
Bullish Overlapping Block :
Bearish Overlapping Block :
🟣 Benefits of the Overlapping Block Between Order Block and Breaker Block
1. Enhanced Precision in Identifying Key Levels : The overlap between these two zones usually acts as a highly reliable area for price reactions, increasing the accuracy of identifying entry and exit points.
2. Reduced Trading Risk : Given the high importance of the overlap zone, the likelihood of making incorrect decisions is reduced, contributing to overall lower trading risk.
3. Increased Probability of Success : The overlap between Order Blocks and Breaker Blocks combines two powerful concepts, enhancing the likelihood of success in trades, as multiple indicators confirm the importance of the area.
4. Creation of Better Trading Opportunities : Overlap zones often provide traders with more robust trading opportunities, as these areas typically represent strong reversal points in the market.
5. Compatibility with Other Technical Tools : This concept seamlessly integrates with other technical analysis tools such as Fibonacci retracements, trend lines, and chart patterns, offering a more comprehensive market analysis.
🔵 Setting
🟣 Global Setting
Pivot Period of Order Blocks Detector : Enter the desired pivot period to identify the Order Block.
Order Block Validity Period (Bar) : You can specify the maximum time the Order Block remains valid based on the number of candles from the origin.
Mitigation Level Order Block : Determining the basic level of a Order Block. When the price hits the basic level, the Order Block due to mitigation.
Mitigation Level Breaker Block : Determining the basic level of a Breaker Block. When the price hits the basic level, the Breaker Block due to mitigation.
Mitigation Level Overlapping Block : Determining the basic level of a Overlapping Block. When the price hits the basic level, the Overlapping Block due to mitigation.
🟣 Overlapping Block Display
Show All Overlapping Block : If it is turned off, only the last Order Block will be displayed.
Demand Overlapping Block : Show or not show and specify color.
Supply Overlapping Block : Show or not show and specify color.
🟣 Order Block Display
Show All Order Block : If it is turned off, only the last Order Block will be displayed.
Demand Main Order Block : Show or not show and specify color.
Demand Sub (Propulsion & BoS Origin) Order Block : Show or not show and specify color.
Supply Main Order Block : Show or not show and specify color.
Supply Sub (Propulsion & BoS Origin) Order Block : Show or not show and specify color.
🟣 Breaker Block Display
Show All Breaker Block : If it is turned off, only the last Breaker Block will be displayed.
Demand Main Breaker Block : Show or not show and specify color.
Demand Sub (Propulsion & BoS Origin) Breaker Block : Show or not show and specify color.
Supply Main Breaker Block : Show or not show and specify color.
Supply Sub (Propulsion & BoS Origin) Breaker Block : Show or not show and specify color.
🟣 Order Block Refinement
Refine Order Blocks : Enable or disable the refinement feature. Mode selection.
🟣 Alert
Alert Name : The name of the alert you receive.
Alert Overlapping Block Mitigation :
On / Off
Message Frequency :
This string parameter defines the announcement frequency. Choices include: "All" (activates the alert every time the function is called), "Once Per Bar" (activates the alert only on the first call within the bar), and "Once Per Bar Close" (the alert is activated only by a call at the last script execution of the real-time bar upon closing). The default setting is "Once per Bar".
Show Alert Time by Time Zone :
The date, hour, and minute you receive in alert messages can be based on any time zone you choose. For example, if you want New York time, you should enter "UTC-4". This input is set to the time zone "UTC" by default.
🔵 Conclusion
The overlap between Order Blocks and Breaker Blocks represents a critical and powerful area in technical analysis that can serve as an effective tool for determining entry and exit points in trading.
These zones, due to the combination of two key concepts in technical analysis, hold significant importance and can help traders make more confident trading decisions.
Although this concept is not specifically discussed in the ICT framework and is introduced as a new idea, traders can achieve better results in their trades through practice and testing.
Utilizing the overlap between Order Blocks and Breaker Blocks, in conjunction with other technical analysis tools, can significantly improve the chances of success in trading.
