Normalised T3 Oscillator [BackQuant]Normalised T3 Oscillator
The Normalised T3 Oscillator is an technical indicator designed to provide traders with a refined measure of market momentum by normalizing the T3 Moving Average. This tool was developed to enhance trading decisions by smoothing price data and reducing market noise, allowing for clearer trend recognition and potential signal generation. Below is a detailed breakdown of the Normalised T3 Oscillator, its methodology, and its application in trading scenarios.
1. Conceptual Foundation and Definition of T3
The T3 Moving Average, originally proposed by Tim Tillson, is renowned for its smoothness and responsiveness, achieved through a combination of multiple Exponential Moving Averages and a volume factor. The Normalised T3 Oscillator extends this concept by normalizing these values to oscillate around a central zero line, which aids in highlighting overbought and oversold conditions.
2. Normalization Process
Normalization in this context refers to the adjustment of the T3 values to ensure that the oscillator provides a standard range of output. This is accomplished by calculating the lowest and highest values of the T3 over a user-defined period and scaling the output between -0.5 to +0.5. This process not only aids in standardizing the indicator across different securities and time frames but also enhances comparative analysis.
3. Integration of the Oscillator and Moving Average
A unique feature of the Normalised T3 Oscillator is the inclusion of a secondary smoothing mechanism via a moving average of the oscillator itself, selectable from various types such as SMA, EMA, and more. This moving average acts as a signal line, providing potential buy or sell triggers when the oscillator crosses this line, thus offering dual layers of analysis—momentum and trend confirmation.
4. Visualization and User Interaction
The indicator is designed with user interaction in mind, featuring customizable parameters such as the length of the T3, normalization period, and type of moving average used for signals. Additionally, the oscillator is plotted with a color-coded scheme that visually represents different strength levels of the market conditions, enhancing readability and quick decision-making.
5. Practical Applications and Strategy Integration
Traders can leverage the Normalised T3 Oscillator in various trading strategies, including trend following, counter-trend plays, and as a component of a broader trading system. It is particularly useful in identifying turning points in the market or confirming ongoing trends. The clear visualization and customizable nature of the oscillator facilitate its adaptation to different trading styles and market environments.
6. Advanced Features and Customization
Further enhancing its utility, the indicator includes options such as painting candles according to the trend, showing static levels for quick reference, and alerts for crossover and crossunder events, which can be integrated into automated trading systems. These features allow for a high degree of personalization, enabling traders to mold the tool according to their specific trading preferences and risk management requirements.
7. Theoretical Justification and Empirical Usage
The use of the T3 smoothing mechanism combined with normalization is theoretically sound, aiming to reduce lag and false signals often associated with traditional moving averages. The practical effectiveness of the Normalised T3 Oscillator should be validated through rigorous backtesting and adjustment of parameters to match historical market conditions and volatility.
8. Conclusion and Utility in Market Analysis
Overall, the Normalised T3 Oscillator by BackQuant stands as a sophisticated tool for market analysis, providing traders with a dynamic and adaptable approach to gauging market momentum. Its development is rooted in the understanding of technical nuances and the demand for a more stable, responsive, and customizable trading indicator.
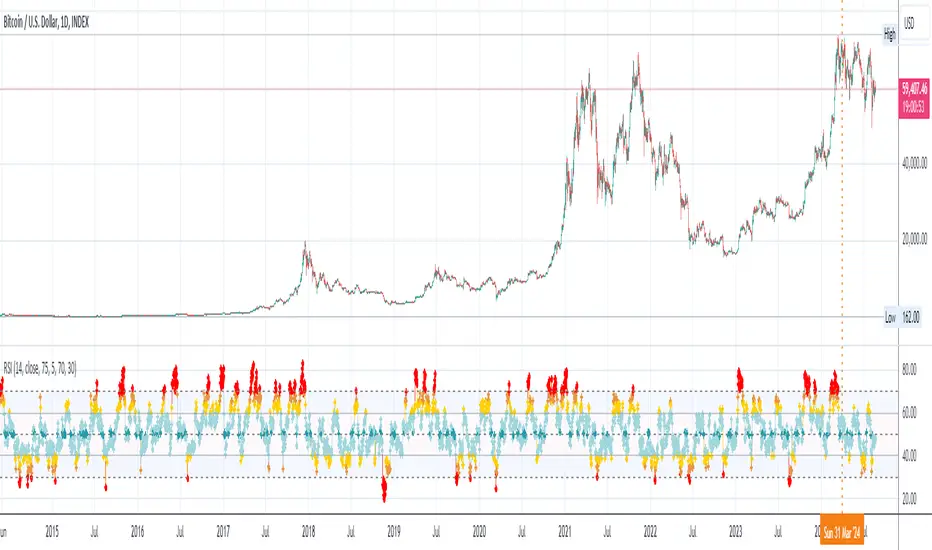
Thus following all of the key points here are some sample backtests on the 1D Chart
Disclaimer: Backtests are based off past results, and are not indicative of the future.
INDEX:BTCUSD
INDEX:ETHUSD
BINANCE:SOLUSD
חפש סקריפטים עבור "alert"

Joesax Red to Green with Alert V2 Candle IndicatorThis indicator displays transitions of candles from red to green and from green to red on a chart, with the ability to set an adjustable percentage threshold. When a candle transitions from red to green and the percentage change exceeds the specified threshold, a red to green transition signal is issued. Similarly, when a candle transitions from green to red and the percentage change exceeds the specified threshold, a green to red transition signal is issued.
Parameters:
Percentage threshold %: Allows you to set the percentage threshold to determine when to consider the transition from one candle to another significant.
Description:
This indicator uses the absolute percentage change between the opening price and the closing price of a candle to determine whether the candle is red or green. When a candle transitions from red to green and the percentage change exceeds the set threshold, a red to green transition signal is issued. Similarly, when a candle transitions from green to red and the percentage change exceeds the set threshold, a green to red transition signal is issued. Alerts are triggered when such transitions occur.
This indicator helps traders identify significant directional changes on the chart, enabling them to make informed decisions during financial market analysis.

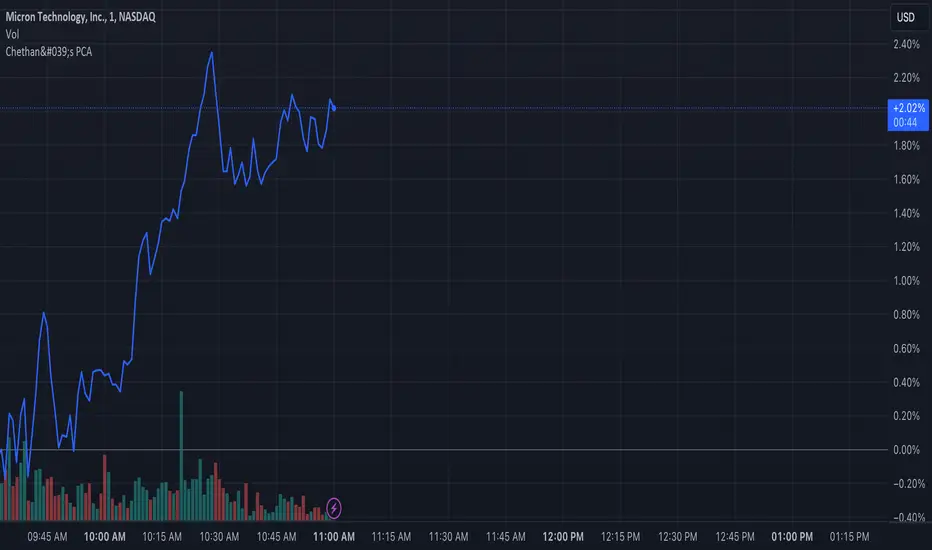
Chethan's Price Change AlertsThis Script will alert when the stock price crosses range from 1% to 20%.
EMA Buy/Sell Alerts with ATR-based TP/SLI wanted to fill a void in the Tradingview FREE indicators. I have searched far and wide on a moving average alert with ATR based take profits and stop loss. I have attempted a rudimentary version of what I hope to improve upon in the future. Will try and add different moving average options such as simple, hull, RMA, JMA, SSL, WMA, etc. For now, a basic EMA with 3 TP and a SL based on the current ATR should suffice.
I grow tired of the ATR take profits being hidden behind a paywall. Please use the script and add to your favorite indicators as you please.
Please leave feedback for future development.

Economic Data Trading alerts - CPI, Interest rate, PPI, etcDescription:
This indicator is designed to alert based on user-selected economic data for Europe, the US, and Japan. It allows users to define their preferred economic data points and trade direction based on the change in the economic data compared to the previous value.
you can use the strategy to automate economic data trading.
Key Features:
Choose from various economic data points for Europe, the US, and Japan.
Customize trade direction based on whether the economic data is above or below the previous value.
Define entry conditions based on user preferences.
Visualize trade entries on the chart.
Display a table showing the results of executed trades.
Please note that this strategy is provided for educational purposes only and should not be considered as financial advice. Always do your own research and use proper risk management when trading.
The indicator is BETA please make sure to test it before using it.
IMPORTANT: you need to be aware of the fundmentals because the regime changes and markets react to every release of data differently.

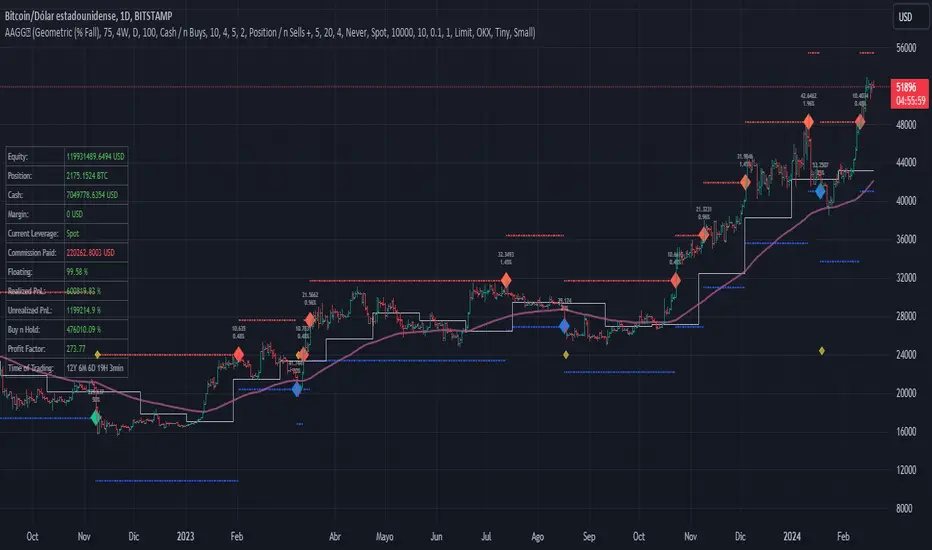
Assassin's Grid
Introduction: Are you a fan of automated grid-based trading and holding onto your crypto assets like they're the last Snickers bar in the world? If so, this Pine script could be your new best friend!
Grid Trading Genius: The script uses some seriously advanced grid trading techniques to automatically place orders at different price levels, creating a mesh of positions that move with the market like a well-oiled machine. This strategy can be great for traders who are willing to sit back and let their positions grow like a fine wine over time.
Optimization Features: The script comes loaded with all sorts of features and tools to help traders optimize their grid positions, like position exits and custom alerts for creating limit and market orders. This helps keep traders in the loop and allows them to take action as needed, like a ninja in the night.
Unique Twists: One of the unique features of this script is the option to choose between normal or incremental entry steps in a 1,2,3,... ratio. By choosing incremental entries, traders can potentially improve their average price and increase their potential profits like a boss. Just keep in mind that this script doesn't have a stop loss feature, but it does include the option to sell without profit on the final entry or on all entries if desired. Additionally, the script is always open to improvement and any ideas for improving it are welcome, like a blank canvas.
Conclusion: If you love automated trading and have the patience and determination to stick to a solid strategy, this Pine script could be a great fit for you. It's suitable for traders who are comfortable with more complex trading approaches and are willing to put in the time and effort to learn and master the script's various features and techniques, like a Jedi Knight
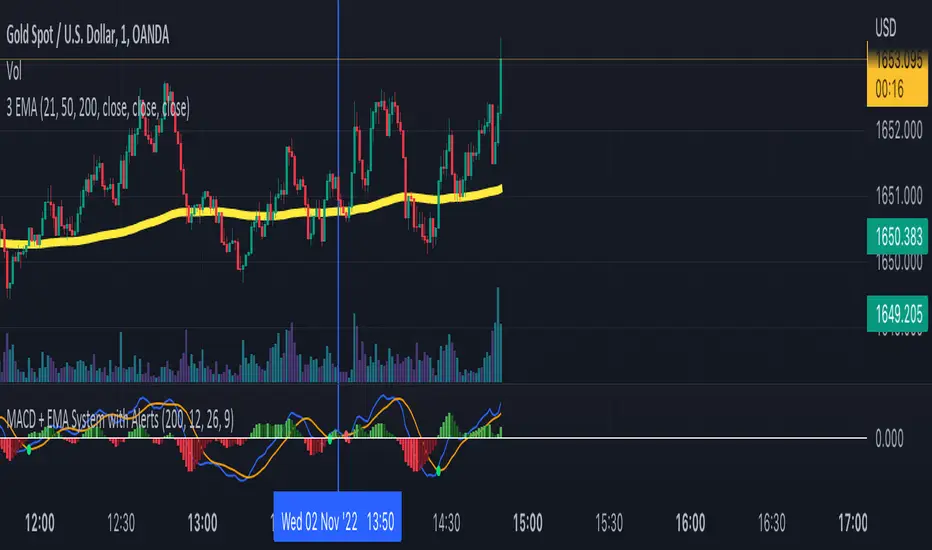
MACD + EMA System with AlertsSo I created the MACD Cross Strategy but not working alone by itself. I added EMA (Exponential Moving Average) filter to improve its winning rate so the MACD Signal only appears when in the same trend direction as Moving Average.
The Main Rules for Long Signal are:
- MACD Main Line Crossover the MACD Signal Line.
- The crossover happens below the MACD center line (0) so the momentum is strong.
- Price above the EMA 200 so it means the market is in a strong uptrend.
The Main Rules for Short Signal are :
- MACD Main Line Crossunder the MACD Signal Line.
- The crossover happens above the MACD center line (0) so the momentum is strong.
- Price below the EMA 200 so it means the market is in a strong downtrend.
The signal crossover & signal alert only generate as per the following rules above.
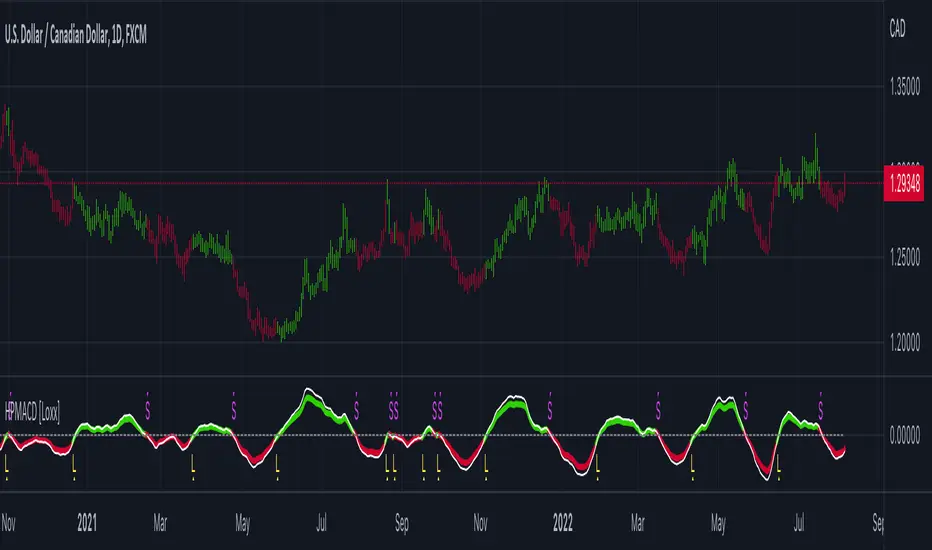
Hodrick-Prescott MACD [Loxx]Hodrick-Prescott MACD is a MACD indicator using a Hodrick-Prescott Filter.
What is Hodrick–Prescott filter?
The Hodrick–Prescott filter (also known as Hodrick–Prescott decomposition) is a mathematical tool used in macroeconomics, especially in real business cycle theory, to remove the cyclical component of a time series from raw data. It is used to obtain a smoothed-curve representation of a time series, one that is more sensitive to long-term than to short-term fluctuations. The adjustment of the sensitivity of the trend to short-term fluctuations is achieved by modifying a multiplier Lambda.
The filter was popularized in the field of economics in the 1990s by economists Robert J. Hodrick and Nobel Memorial Prize winner Edward C. Prescott, though it was first proposed much earlier by E. T. Whittaker in 1923.
There are some drawbacks to use the HP filter than you can read here: en.wikipedia.org
Included
Bar coloring
3 types of signals
Alerts
Loxx's Expanded Source Types
Signal generatorThis simple script generates signals for testing the connection from TradingView to a REST API client via the webhook and demonstrates very basic concepts of gerenating alerts within the script.
This script also demonstrates how to visualize when a buy or a sell should take place and how to use diagnostics text for bug fixes/informational purposes.
This is for testing and learning only. Do not use with real money as losses WILL occur. This script is for educational purposes only and should only be used with demo accounts, never with real money .
Buy signals are generated when closing price is less then opening price.
Sell Signals are generated when closing price is greater then opening price.
Can also be used to test signal counting and very rudimentary dollar cost averaging.

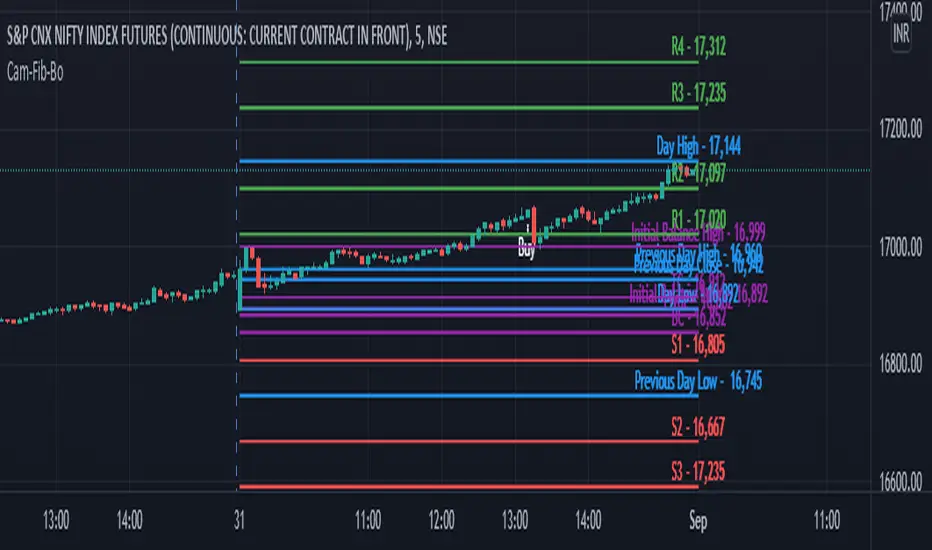
Camarilla Fibonachi Breakout Indicator with AlertsThis Script can be used for Intraday Only.
This Script will Plot the following Lines in the Chart
1. VWAP (Colour will be ploted as per the following condition)
VWAP Line will Plotted in Green if Open Price is Greater Than Close
VWAP Line will Plotted in Red if Open Price is Less Than Close
2. VWMA (VWMA Period used 14)
3. Atr Trailing Stoploss
(ATR Period 5, ATR Multiplier 2.5 is used to plot the Lines)
4. 15 Min High Low of the day will be plotted as dotted Purple lines
5. H4 as BuyAbove Level
6. H3 as Buy Stop Loss Level
7. H5 as Buy Target 1 Level
8. H6 as Buy Target 2 Level
9. H7 as Buy Target 3 Level
10. H8 as Buy Target 4 Level
11. H9 as Buy Bonus 1 Level
12. H10 as Buy Bonus 2 Level
13. H11 as Buy Bonus 3 Level
14. H12 as Buy Bonus 4 Level
15. L4 as Sell Below Level
16. L3 as Sell Stop Loss Level
17. L5 as Sell Target 1 Level
18. L6 as Sell Target 2 Level
19. L7 as Sell Target 3 Level
20. L8 as Sell Target 4 Level
21. L9 as Sell Bonus 1 Level
22. L10 as Sell Bonus 2 Level
23. L11 as Sell Bonus 3 Level
24. L12 as Sell Bonus 4 Level
This script will generate Buy signal on he following condition
1.Close Must be Greater than H4
if Calculate Inside Camarilla is Enabled then the Script will check whether Yesterdays H4 is Less than Todays H4
2.Close Must be Greater than VWAP
3.Volume Must be Greater Than 20 Period Simple Moveing Average
4.Buy Signal will be Displayed only Once for a Day.
This script will generate Sell signal on he following condition
1.Close Must be Less than L4
if Calculate Inside Camarilla is Enabled then the Script will check whether Yesterdays L4 is Less than Todays L4
2.Close Must be Less than VWAP
3.Volume Must be Greater Than 20 Period Simple Moveing Average
4.Sell Signal will be Displayed only Once for a Day.
and the Alert Message will be Generated for Buy and Sell
Strat Assistant Alerts and Highs/LowsStrat Assistant FTC Only
----------------------------
█ OVERVIEW
This script is intended to highlight/draw lines for the prior high/low of 30, 60, day, week, month, quarter, as well as create the alerts for when these thresholds get crossed
Input
----------
The script has inputs for every time frame plotted - 30, 60, day, week, month, quarter. All of the following items below can be "modified"
is the high line active? (for the corresponding time frame, will plot the line yes or no - by default only the DAY is displayed)
is the low line active? (for the corresponding time frame, will plot the line yes or no - by default only the DAY is displayed))
The high line color - modify the color of the corresponding time frame high line to your liking
The low line color - modify the color of the corresponding time frame low line to your liking
The time frame line width - make some lines wider than others for easier distinction
Output
----------
Lines for each corresponding time frame activated in the selected color and width.
Custom alerts - open a stock, select the Alerts button at the top, click the condition as the name of this script. The next drop down will show you all the corresponding alerts you can set for the current price crossing above the prior timelines high or below the prior timelines low (the bracket number is just for sorting purposes).
Best Practices
----------
What's not mapped? - Style (you can't drive this by an input, by default day is dashed, the rest are a solid line)
What's not mapped? - Price on the Y axis. I'm still trying to figure this out, not sure you can do it. I can add a label, just gets cluttered fast
Played with this a little bit using crypto, but obviously I can't test out all these alerts without a lot of things moving. Please do your due diligence.
I know a million people are going to want a million things. I can create more alerts coming soon, for now I wanted to start with this. Please and comments or suggestions or feedback and I'll see what I can do. I can create labels (for price) randomly, but it will clutter the screen. Or I can create one big box or table with prices shown.

Stochastic w/ Crossover Alerts (by WJ)NOTE:
// STOCHASTIC CODE TAKEN FROM DEFAULT INDICATOR
// I HAVE ONLY MADE SOME ADJUSTMENTS FOR VISUAL AID
// I MADE THIS FOR MY OWN USE BUT HAVE DECIDED TO PUBLISH AND SHARE IN CASE ANYBODY WANTS TO USE IT
This is the normal default built-in Stochastic indicator which I have added some stuff for visual aid:
Stochastic background turns green when K line crosses D line UPWARDS, D line is below the oversold level, and price is above selected MA
Stochastic background turns red when K line crosses D line DOWNWARDS, D line is above the overbought level, and price is below selected MA
Alert notification on the crossover candle with background colour change when conditions are met (MA filter)

Awesome Heikin Ashi [Morty]This indicator uses Heikin Ashi candles and two EMAs to help you follow the trend and enter the trade. Heikin Ashi candles help to smooth the price and EMAs are used to detect trend. The default parameter of EMA is EMA10 and EMA20. You can use it at any timeframe. You should always adjust the EMA length according to different timeframes.
Features:
- Highlight background based on two EMAs
- Adjustable EMA length
- Adjustable Label size
- Show entry and exit signal labels
- Show stoploss price
- You can choose Long only or Short only or both signals
- Alert functions for notification
NOTE: If you use this signal to enter a trade, make sure the candle is close and enter in the next candle.

Directional Movement Index color alertThis script is changed from the classic DMI.
I add 4 colors and setup two alerts as well.
- +DI cross up -DI is a long signal
- +DI cross down -DI is a short signal
- ADX keeps increasing means strong trend
- ADX keeps decreasing means swing

Parabolic SAR with Volatility Filter: Buy Alerts for 3commasHey folks and fellow 3commas users !
Here is a new signal generator for your DCA bot on 3commas.
This is a classic Parabolic SAR indicator with a filter for volatility.
NOTE: This is a repainting strategy by design. Recommended to use with "Once per bar" alert style for PSAR

Relative Strength Index with AlertsRSI with alert on enter and exit overbough and oversold area.
You can change the overbough and oversold levels as well.
RSI, STOCHASTIC, KELTNER AND EMA CROSSES COMBINEDI have combined RSI and Stochastic but also added an keltner channel and then also two EMA's.
How the indicator works is the background turns green when the rsi and stochastic are below 20 and the keltner channel is below X and also your fast ema is below your slow ema and then vice versa for sell signals.
Feel free to leave a comment on what you think and what could be improved on it because i know their is some fine tuning to do and some improvement that can be made and I'm sure i'll be updating this myself.
All the variables are interchangable and the indicator has alert functionality.
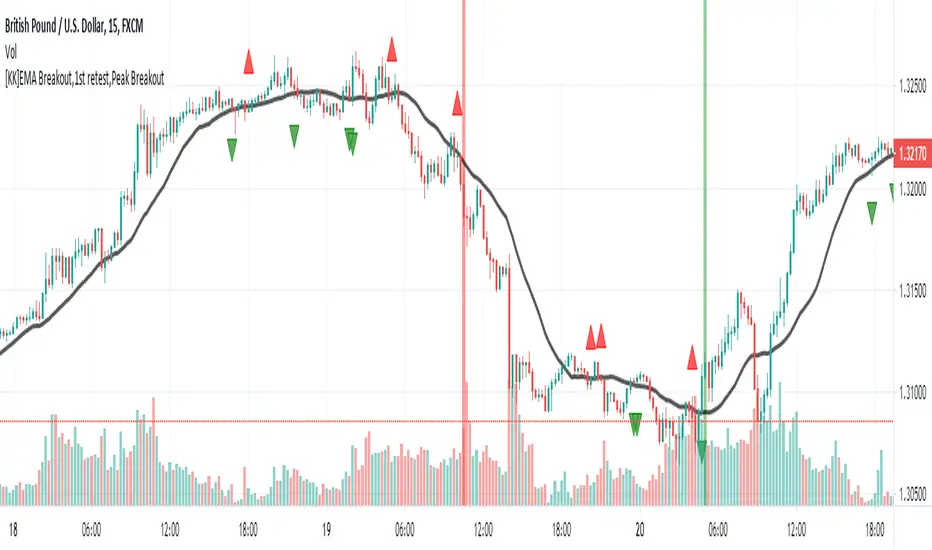
[KK]EMA Breakout,1st retest,Peak BreakoutThis script gives Signal based on 3 parameters
(1) Exponential Moving average breakout
(2)Retest after Breakout
(3) Peak Breakout after retest for conformation
Recommended Settings:
(1) EMA Length = 20 period
(2)Left Bars= Right Bars = 4
(3)15min chart resolution
Note: Default setting is what recommended.
Interpretation:
(1)Green Background = Higher Peak Breakout candle after conformed retest
(2)Red Background = Lower Peak Breakout candle after conformed retest
(3) Green circle = 1st Upward Breakout candle after conformed retest ( if previous breakout is Downward)
(4)Red circle = 1st Downward Breakout candle after conformed retest ( if previous breakout is Upward)
Note: you can additionally add backgrounds for EMA breakout and conformed Retest from code.
Signals:
(1)Long = When Green circle
(2)Short = When Red circle
This script works with any ticker id. Best Use for Equity and Forex Markets. Also, added alert condition for green and red circle.
P.S.: Thanks to @RagingRocketBull for source code for breakout candles
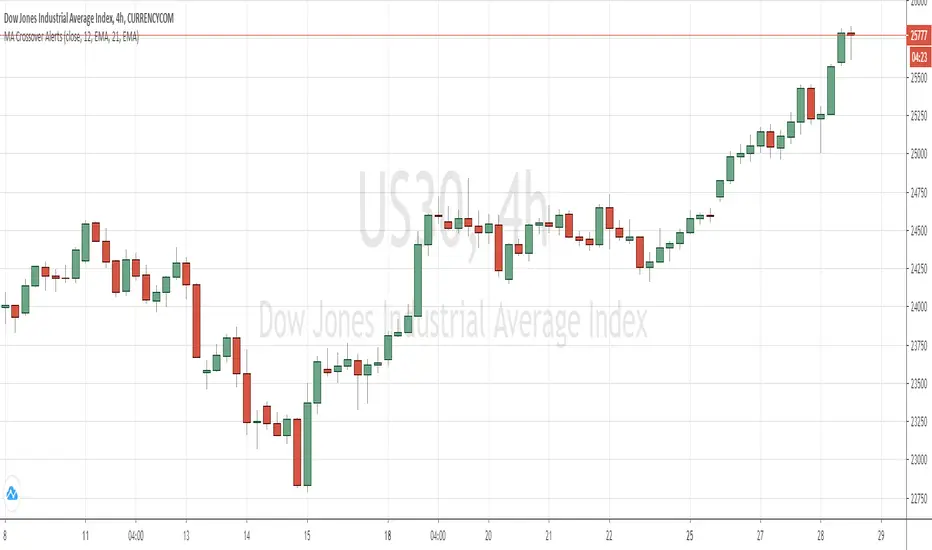
MA Crossover AlertsThis script allows you to configure Create Alert dialogue box for a MA Crossover and send a notification on mobile device.

Ema Cross, 10 /21 / 55Ema Cross tool using Ema 10 / Ema 21 / Ema 55
I have found these settings very useful for catching breakouts on Alt coins.
Alerts Added,
Breakout = Ema 10 crossing above Ema 21
Breakdown = Ema 10 crossing under Ema 21
Ema 55 added as a useful area to catch dips when price is trending

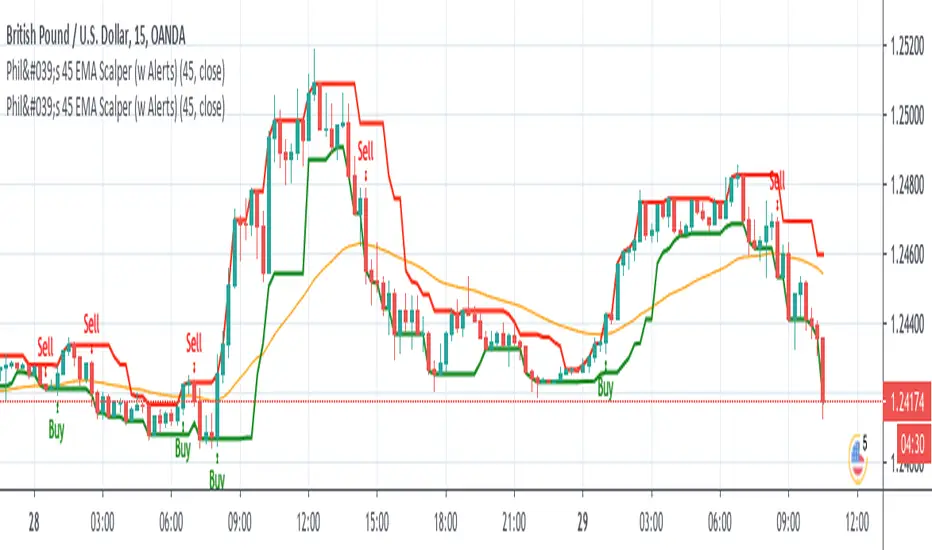
Phil's 45 EMA Scalper - Buy / Sell with Alertsgives buy / sell alert when candle closes above or below 45 EMA respectively.
Ichimoku Kinko Hyo Cloud - no offset - no repaint - strategyIchimoku Kinko Hyo Cloud - no offset - no repaint - RSI filter - strategy
The indicator contains both the standard Ichimoku Cloud , as well as the one without the visual offset.
The Strategy Tester indicates good backtest results when the Ichimoku Cloud is paired with the RSI .
However, it seems it likes to work more as a standalone system.
The indicator can be easily converted to the study() mode by commenting/uncommenting a few lines,
then the alarms can be configured.
There are entry and exit signals ready to be used by the alert system.
The coloring of the cloud without offset contains all 3 conditions: Uptrend , Downtrend , Transition .
