Donchian 20/10 Screener + Alerts Donchian 20/10 Screener + Alerts identifies stocks breaking their 20-day high.
Includes ADX trend filter to confirm strong momentum.
Plots Donchian high/low lines and marks BUY/SELL signals on chart.
Screener output shows “PASS” for stocks meeting entry criteria.
Supports alerts for entry, exit, and screener signals for easy monitoring.
חפש סקריפטים עבור "alert"

[CASH] Crypto And Stocks Helper (MultiPack w. Alerts)ATTENTION! I'm not a good scripter. I have just learned a little basics for this project, stolen code from other public scripts and modified it, and gotten help from AI LLM's.
If you want recognition from stolen code please tell me to give you the credit you deserve.
The script is not completely finished yet and contains alot of errors but my friends and family wants access so I made it public.
_________________________________________________________________________________
CASH has multiple indicators (a true all-in-one multipack), guides and alerts to help you make better trades/investments. It has:
- Bitcoin Bull Market Support Band
- Dollar Volume
- 5 SMA and 5 EMA
- HODL Trend (a.k.a SuperTrend) indicator
- RSI, Volume and Divergence indicators w. alerts
More to come as well, like Backburner and a POC line from Volume Profile.
Everything is fully customizable, appearance and off/on etc.
More information and explainations along with my guides you can find in settings under "Input" and "Style".

Volume Surge AlertVolume is often the fuel behind meaningful price moves. The Volume Surge Alert indicator highlights bars where volume explodes above its recent average, helping you spot accumulation, distribution, and breakout attempts before the price fully reacts.
Calculates a configurable simple moving average of volume to establish “normal” activity.
Flags bars where the current volume exceeds the SMA by a user-defined multiple (default 2×).
Colors the column and background on surge bars for quick visual confirmation.
Provides an alert condition so you can receive notifications the moment activity spikes.
Use it on any timeframe or market to monitor for unusual participation, confirm breakouts, or filter entries. Adjust the SMA length and surge multiple to match your market’s typical liquidity profile.

ASTER Key Levels & Alerts (Improved)TradingView Script Description
Title: ASTER Key Levels & Alerts (Improved)
Description:
Enhance your trading strategy with the "ASTER Key Levels & Alerts" indicator, designed for precision and decision-making on the Aster chart (e.g., ASTS). This Pine Script v6 tool overlays customizable key levels and zones to identify optimal entry, exit, and stop-loss points, complete with real-time alerts.Key Features:
Customizable Levels: Adjust add zones (Light & Main), breakout, stop, and take-profit (TP1-TP3

Volume Peak (2 before & 2 after) - With AlertVolume Peak (2 before & 2 after) - With Alert
There will be an alert for you when a signal appears.
If you find it useful, please give me a like

Arisa RSI Rebound Alert (v6.2)Short description:
Simple RSI-based rebound detection with ATR confirmation — designed for traders who prefer a clean and intuitive signal.
Full description:
This indicator detects oversold and rebound phases using RSI and confirms the strength of each rebound with ATR slope analysis.
It is optimized for deep correction phases (e.g. RSI 25→35 cross), helping traders catch early reversal signals while avoiding unnecessary noise.
💡 Recommended use:
• Timeframes: 30min–4h
• Ideal for short- to mid-term rebound trades
• Combine with Heikin-Ashi or volume expansion for higher accuracy
✨ Key Features:
• Clear oversold/rebound thresholds (default RSI <25 / cross-up >35)
• Background highlight for deep oversold conditions
• Visual markers for strong vs. weak rebounds (ATR slope filter)
• Alert-ready (three conditions included)
🪶 Concept:
This script is designed for traders who value simplicity and intuition — focusing on meaningful signals rather than automation overload.
It’s for those who still want to see and feel the market before taking action.
⸻
Author:
Arisa Sanjo (Japan)
Created with the support of GPT-5, based on live trading insights from October 2025.
License:
Free to use and modify with proper attribution.
If you redistribute or enhance this script, please mention “Based on Arisa RSI Rebound Alert (v6.2)” in your description.
EMA 9/20 Crossover AlertThis EMA 9/20 Crossover Alert indicator is a technical tool used on price charts to detect and notify traders when the short-term 9-period Exponential Moving Average (EMA) crosses above or below the longer-term 20-period EMA. This crossover often signals potential shifts in market momentum, signaling possible buy or sell opportunities. The indicator visually plots both EMAs on the chart and creates alert conditions so traders can be promptly informed of these crossover events, aiding in timely decision-making without needing to constantly watch the chart. It is widely used in momentum and trend-following trading strategies to identify trend reversals or continuations

TMA Bands with AlertsTMA Bands with Alerts uses bands to indicate the up and downtrend with alerts to show potential reversals. POAYEE

RSI with Multiple MAs + Slope Alerts 5,9,34,55RSI with Multiple MAs + Slope Alerts 5,9,34,55
Stacking Alerts Available
HTF POC with Zones & AlertsPlots a Point of Control (POC) per candle from a timeframe you choose (MTF). Because TradingView doesn’t expose true footprint data, the POC here is a proxy (choose: Body Mid, Range Mid, or Typical Price HLC3). The script draws the POC line and an optional POC zone (±% of that candle’s range), then alerts when price retests the zone (wick touches count).
Use it to:
Mark key levels inside candles that often act as magnets or reaction zones
Track retests of strong bars (imbalance) across higher timeframes
Add clean confluence with S/R, FVGs, or trend tools
Features: Selectable TF, zone width, extend lines/zones, historical caps, alerts, and info panel.
Note: This is an estimate of POC from OHLC, not real bid/ask volume. Use as context, not a standalone signal.

Minimalist RSI - Nasdaq (14) with Volume Filter and AlertsDescription:
This indicator shows the standard RSI (period 14) adapted for Nasdaq, with a clean and minimalist design. It adds visual levels for overbought (75) and oversold (25), plus an optional centerline 50 to better interpret momentum.
It incorporates a high volume visual filter to confirm signals and avoid false entries in low-interest conditions. Buy and sell signals are based on RSI crosses in extreme zones, optionally filtered by volume to improve reliability.
You can enable automatic alerts to receive notifications when important signals occur.
How to use:
Watch the RSI and its position relative to overbought/oversold zones and the 50 line.
Wait for high volume confirmation for greater reliability (you can disable this filter if preferred).
Use buy and sell signals alongside your price action and overall context analysis to make decisions.
Set alerts to not miss opportunities.
Important Notice:
This indicator is a support tool, not a complete strategy. Trading involves risks and no guarantees. Always use risk management and test the indicator on a demo before using it live.
Personal note:
This is my first script and I would love to receive constructive feedback to improve and offer better tools to the community. Thanks for trying it!
Motivational phrase:
“No risk, no reward.”
1H MA20 Downbreak Alert1H MA20 Downbreak Alert
1H MA20 Downbreak Alert1H MA20 Downbreak Alert1H MA20 Downbreak Alert

RSI 20/80 Arrows + AlertsRSI 20/80 Arrows + Alerts
This indicator is a modified Relative Strength Index (RSI) tool designed to help traders spot potential overbought and oversold conditions using customizable threshold levels (default 80 for overbought, 20 for oversold).
Features:
Custom RSI Levels – Default to 80/20 instead of the standard 70/30, but fully adjustable by the user.
Visual Signals –
Blue Arrow Up appears below the bar when RSI crosses up from below the oversold level (potential buy zone).
Red Arrow Down appears above the bar when RSI crosses down from above the overbought level (potential sell zone).
Alerts Built In – Receive notifications when either signal occurs, with the option to confirm signals only on bar close for reduced noise.
Guide Levels – Optionally display overbought/oversold reference lines on the chart for quick visual reference.
Overlay Mode – Signals are plotted directly on the price chart, so you don’t need to switch between chart windows.
Use Case:
Ideal for traders who want quick, visual confirmation of potential turning points based on RSI, especially in strategies where more extreme levels (like 20/80) help filter out weaker signals. Works well across all markets and timeframes.

Universal ATR Grid from Entry Price with AlertsUniversal ATR Grid from Entry Price with Alerts
This Pine Script v6 indicator creates a dynamic price grid based on a user-defined entry price and ATR for selected instruments (SOLUSDT, XRPUSDT, DOGEUSDT, PEPEUSDT, WIFUSDT).
Users can customize the entry price, ATR, number of levels (up to 5), and step multiplier per instrument.
The grid shows long (green) and short (red) levels around the entry price (gray), with labels offset right.
Lines extend from labels to the current bar, updating dynamically.
Alerts trigger on breakouts of long, short, and entry levels. Instrument names can be modified in the script.

Liquidity Zones Alerts"Liquidity Zones Alerts" is a powerful smart-money-based indicator designed to detect key liquidity grabs and provide high-probability reversal signals using a combination of market structure, volume, volatility, and candlestick confirmation.
🧠 How It Works
The core logic of this indicator is built around the Smart Money Concepts:
🔺 Liquidity Sweeps: Detects when price takes out previous daily or weekly highs/lows, suggesting stop hunts or engineered liquidity moves by institutional players.
📈 Volume Filter: Ensures signals only appear during above-average volume, filtering out noise and low-interest moves.
⚡ Volatility Filter: Flags high-range candles relative to the average, catching flash crashes/spikes that often precede strong reversals.
🔄 Engulfing Candle Confirmation: Confirms entry with a bullish or bearish engulfing pattern after liquidity is taken — increasing signal reliability.
🧭 Premium/Discount Zone Logic: Trades are filtered to ensure longs are only taken in discount zones, and shorts in premium zones, using a 20-period market range for context.
📌 Features
✅ Daily & Weekly liquidity zones toggle
✅ Visual signals with clean 🔻(short) & 🔺(long) arrows
✅ Auto-detection of flash crashes
✅ Alerts on both long and short setups
✅ Optional previous high/low level plotting for context
✅ Background highlighting of valid signal candles
✅ Multi-timeframe friendly and compatible with any asset
🛠️ Use Case
Whether you're a scalper or a swing trader, this tool helps you spot institutional entry zones before the move happens. It works especially well when combined with your existing bias or supply/demand zones.
💬 “Price doesn't move randomly — it hunts liquidity. This indicator shows you where and when it happens.”

Opening Price Deviations with AlertsOverview
The Timeframe Opening Price Deviations indicator helps traders visualize how price deviates from a key reference point—the opening price of a selected timeframe (Daily, Weekly, or Monthly). It calculates upper and lower deviation levels based on a percentage step and plots these levels on the chart. This can help traders identify potential areas of support and resistance.
----------------------------------------------------------------------------------------------------------------------
How It Works
Opening Price Reference:
The script retrieves the opening price of the selected timeframe (Daily, Weekly, or Monthly).
Deviation Levels Calculation:
Five upper and lower deviation levels are calculated based on a percentage step input by the user.
Each level is determined by multiplying the opening price by (1 ± step size).
Visualization
The indicator plots the calculated levels as horizontal lines above and below the opening price.
Labels appear only on the latest bar, displaying the exact price level along with its percentage deviation from the opening price.
User has the option to turn on/off or change the bar colours. If price is within the 1st deviation lines that's considered neutral coloured orange as default. If price is above/below the first deviation levels the bar colours will be green or red.
---------------------------------------------------------------------------------------------------------------------
Potential Use Cases
Support & Resistance Zones 🟢🔴
The deviation levels can act as potential areas where price may reverse or consolidate based on historical price behaviour.
Breakout & Reversion Strategies 📈📉
If price breaks above an upper deviation level, it could indicate momentum continuation.
If price rejects from a level, it might suggest a mean reversion opportunity.
Trend Strength Analysis 🔍
The distance between the price and deviation levels can help traders assess whether a trend is strong (moving away from the opening price) or weak (hovering near the opening price).
Intraday vs. Multi-Timeframe Perspective 🕒
By selecting different timeframes (Daily, Weekly, Monthly), traders can align intraday price movements with higher timeframe reference points for added confluence.
---------------------------------------------------------------------------------------------------------------------
Customization Options
Timeframe Selection: Choose between Daily, Weekly, or Monthly opening prices.
Deviation Step (%): Adjust the step size to control the spacing between deviation levels.
Colour Bars: User Is able to change the colour of the bars.
---------------------------------------------------------------------------------------------------------------------
Alerts
This Indicator also has alerts for when price crosses above/below a deviation line. It will tell you the ticker, price and time
---------------------------------------------------------------------------------------------------------------------
Final Notes
This indicator is purely for technical analysis and should not be used as a standalone trading system. It works best when combined with price action, volume analysis, or other indicators of you're choosing to refine trade decisions.
Happy Trading! 🚀📊
---------------------------------------------------------------------------------------------------------------------
This explanation is clear, informative, and compliant with TradingView’s House Rules.

New Bar AlertThis is probably the simplest indicator on Tradingview, it generates an alert on every new bar.
Useful for strategies where you only need chart attention at the new bar, see if you have a setup.
Helps not having to stare at the charts, the alert will tell you when it's time to take a look.
Works on all timeframes but in order to keep your sanity, best used on higher timeframes, 5mins and up.
BooBee Digital - Enhanced Buy & Sell Alerts Suite
BooBee Digital - Enhanced Buy & Sell Alerts Suite
Introduction:
The “BooBee Digital - Enhanced Buy & Sell Alerts Suite” is a comprehensive trading tool designed to provide traders with precise buy and sell signals by integrating the Average True Range (ATR) trailing stop technique and the Volume Weighted Average Price (VWAP) indicator. This script is tailored to help traders make informed decisions by considering both market volatility and trading volume.
How It Works:
1. ATR Calculation:
• Purpose: Measures market volatility to set dynamic stop levels.
• Details: The Average True Range (ATR) is calculated over a user-defined period. The ATR value reflects the average range of price movements over the specified period, which is crucial for assessing market volatility.
2. ATR Trailing Stop:
• Purpose: Identifies potential trend reversals by setting trailing stops based on market volatility.
• Details: The ATR trailing stop is dynamically adjusted using the ATR value and a user-defined sensitivity factor. This trailing stop level helps identify trend reversals by moving in accordance with price fluctuations.
3. VWAP Calculation:
• Purpose: Provides a volume-weighted average price to benchmark fair value.
• Details: The VWAP is calculated by taking the sum of the product of price and volume, divided by the total volume. This indicator gives traders a reference point for the average price at which the asset has traded throughout the day, considering trading volume.
4. EMA Crossover:
• Purpose: Adds a confirmation layer for buy and sell signals.
• Details: A 1-period Exponential Moving Average (EMA) is used to identify short-term price movements. Buy and sell signals are generated based on the crossover of the EMA and the ATR trailing stop, adding an extra layer of confirmation for trade entries and exits.
Signal Generation:
Buy Signal:
• Generated when the price is above the ATR trailing stop and there is a bullish crossover of the EMA and ATR trailing stop.
• Indicator: Green label below the bar with “Buy” text.
Sell Signal:
• Generated when the price is below the ATR trailing stop and there is a bearish crossover of the EMA and ATR trailing stop.
• Indicator: Red label above the bar with “Sell” text.
VWAP Line:
• The VWAP line is plotted on the chart to help traders identify significant price levels based on trading volume.
• Indicator: Blue line representing the VWAP.
How to Use:
• Chart Type: The script is designed for use on standard chart types such as Candlestick and OHLC. It does not support non-standard chart types like Heikin Ashi, Renko, Kagi, Point & Figure, and Range, as they may produce unrealistic results.
• Clean Chart: Ensure your chart is clean and free of other indicators to avoid confusion. The signals and colors plotted by the script should be easily identifiable.
• Trade Confirmation: Use the buy and sell signals generated by the script in conjunction with other analysis methods to confirm trades.
Key Concepts:
• ATR Trailing Stop: This technique sets dynamic stop levels based on market volatility, helping to identify trend reversals.
• VWAP: This indicator provides a benchmark for the average price considering trading volume, helping traders identify fair value.
• EMA Crossover: This adds a layer of confirmation for buy and sell signals, improving the accuracy of trade entries and exits.

Triple EMA Trend AlertThis EMA trend indicator works by determining if a short-term EMA is above an intermediate-term EMA that is in turn above a long-term EMA (in a bullish trend) or if the reverse is true in a bearish trend. An alert box is displayed on the chart to give a trend trader a quick at-a-glance reference to see which way the overall trend is moving by turning green when the trend is overall bullish, red when overall bearish, and gray when indecisive and not clearly trending (a good time for the trend trader to consider setting back and just observing as they wait for a new trend to develop). Text is displayed in the box showing the current overall trend direction. Sometimes, using this criterion, a trend can still be considered overall bullish while the EMAs are actually bearish prior an EMA crossover that results in a trend readout change to indecisive or in the opposite direction. For this reason, the indicator will also display in parenthesis if the EMAs are trending lower or higher by comparing all live-bar EMA values to that of the previous bar’s values to determine if they are collectively trending lower or higher at that time in order to give an early warning of a potential trend reversal before the EMA crossovers change the overall bullish or bearish readout of the indicator. Both the alert box and EMA line chart overlays can be turned on and off independently, if desired.
Zazzamira 50-25-25 Trend System Alerts OnlyPublishing my trading system script. It consist of several conditions to happen in order to open a trade. Work best on ES/MES 5 minute timeframe.
I like to use it with this settings:
- UTC -6 (don't tick Exchange Timezone)
and rest as default
To enter a trade, the following conditions must be met: Entry 1: the opening range (8:30AM - 9:15AM UTC-6) must be defined and the price must close above or below the opening range on the 5-minute timeframe. This entry condition defines the trade direction (above = long / below = short). Once the opening range is defined, the Trend-Based Fib Extension is applied from the range high to the range low (and vice versa). Fib levels are required for Exit conditions. Entry 2: the 8 - 27 - 67 - 97 EMAs must be defined. If the EMAs value order is 8 > 27 > 67 > 97, long-only trades are allowed. If the EMAs value order is 8 < 27 < 67 < 97, short-only trades are allowed. This entry condition filters fake breakouts of Entry 1. Entry 3: no trades are allowed after 12:59 UTC-6 (2PM EST). Entry 4: if Entry 1, Entry 2, and Entry 3 conditions are valid and the price hasn't reached the 23.6% Fib line, an entry order can be set at the range high/long with 4 contracts. To exit a trade, the following conditions must be met: Exit 1 (Stop loss): set a trailing stop based on 2.1x ATR (14) from entry. Exit 2: take 50% profits at the 23.6% Fib and leave trailing stop untouched. Exit 3: if Exit 2 triggers, take 50% (25% of total entry) off at 61.8% Fib, leaving Exit 2 trailing stop values valid. Exit 4: exit the full position at the FIB 100% value. Exit 5: all trades must be closed at 3pm UTC-6 (4PM EST). So basically Take Profit are 50%-25%-25% of position.
Code has been written by © Hiubris_Indicators who has been an amazing coder and gave me the possibility to make this script public so a really big shoutout to him.
This indicator only works for alerts, please check version without alerts to backtest or tweaks. This indicator is meant to be used to automate the system via webhooks

PlurexSignalIntegrationLibrary "PlurexSignalIntegration"
Provides tools for integrating Strategies and Alerts into plurex.io signals.
plurexMarket() Build a Plurex market from a base and quote asset symbol.
Returns: A market string that can be used in Plurex Signal messages.
tickerToPlurexMarket() Builds simple Plurex market string from the syminfo
Returns: A market string that can be used in Plurex Signal messages.
simpleMessage(secret, action, marketOverride) Builds simple Plurex Signal Messages
Parameters:
secret : The secret for your Signal on plurex
action : The action of the message. One of .
marketOverride : Optional, defaults to the syminfo for the ticker. Use the `plurexMarket` function to build your own.
Returns: A json string message that can be used in alerts to send messages to Plurex.
executeStrategy(secret, openLong, openShort, closeLongs, closeShorts, marketOverride) Executes strategy actions with Plurex Signal messages
Parameters:
secret : The secret for your Signal on plurex
openLong : Strategy should open long if true, aggregated with other boolean values
openShort : Strategy should open short if true, aggregated with other boolean values
closeLongs : Strategy should close longs if true, aggregated with other boolean values
closeShorts : Strategy should close shorts if true, aggregated with other boolean values
marketOverride : Optional, defaults to the syminfo for the ticker. Use the `plurexMarket` function to build your own.

QFL single TF with alertsBacktesting compatible QFL pine script w/alerts
This version of QFL was made based on this one:
From author:
www.tradingview.com
I made the following additions according to my requirements:
- I need to use pine script 4
- I needed to avoid repainting issues so I'm not calling directly security, I'm using the wrapper function.
- There might be still repainting issues when you use "max base age" which uses the function "barssince" so be careful, you can disable it by setting its value to zero.
- Alerts so I can use it for automated trading and bots
- In order to make this signal compatible with the backtest script there's an option provided in the settings. If you enable this option this indicator will plot 1 whenever there's a BUY signal. This will allow the backtest to pick the "QFL Buy" from external indicator so it can perform the backtest.
I recommend some of these settings to start playing with the chart in 15 min / QFL in 1, 2 or 4 hours.
The higher the TF the more conservative.
QFL with 3.5% is pretty popular but you can try higher QFL percentage settings for a more conservative approach.

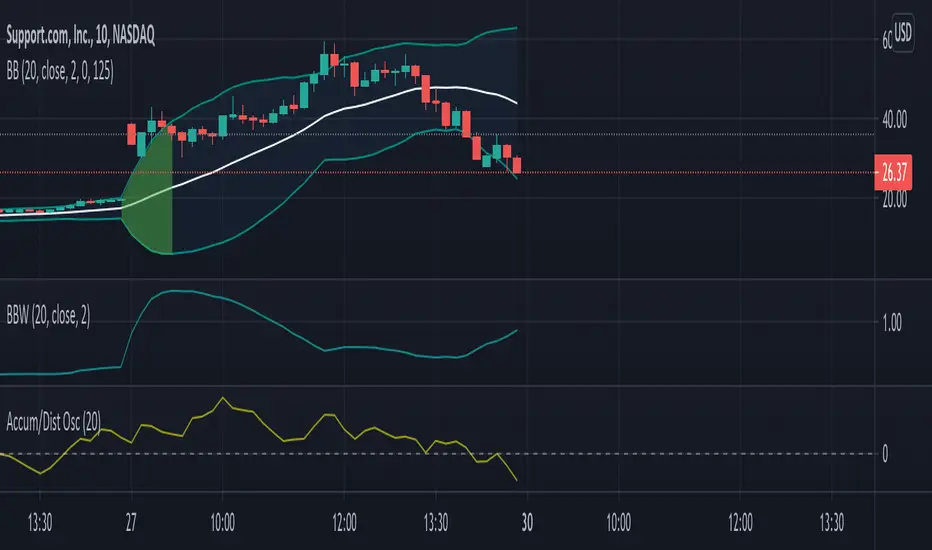
Bollinger Bands w/ Squeeze AlertBollinger's "simple" explanation for a Squeeze is the lowest volatility in the last 6 months. This indicator uses a default look-back period of 125 bars to determine the lowest BandWidth. When current BandWidth drops below the lowest BandWidth of the look-back period, the background of the bands turns red. Default look-back of 125 bars is ~6 months on daily charts.
The source, length, and standard deviation for the Bollinger Bands can all be adjusted. The look-back period for the Squeeze indicator can be adjusted as well.
The image shows my Bollinger Bands w/ Squeeze Alert indicator next to someone else's Bollinger Bandwidth w/ Squeeze Alert indicator to demonstrate how it appears on the chart.