Trend Catcher and Mean ReversionPlease DM if you want to use this strategy.
it took long time to make this code profitable using 3 parameters only!
it allow you to:
1- Pyramid as you see fit.
2- allow option to use trend catching strategy ( while keeping mean reversion strategy)
3- Time filter to limit trading and exit at your preferred time.
4- it works for long, short or both positions.
5- has trailing tp as an option as well while keeping initial sl as hard stop
6- tp multiple (of stop loss) is optional
ongoing working for alerts and automation. More on that for subscribers only.
i will charge the minimum fee to utilize this code as we don't need your money but we need people to support our vision.
חפש סקריפטים עבור "alert"

Zero Lag + Momentum Bias StrategyZero Lag + Momentum Bias Strategy (MTF + Strong MBI + R:R + Partial TP + Alerts)

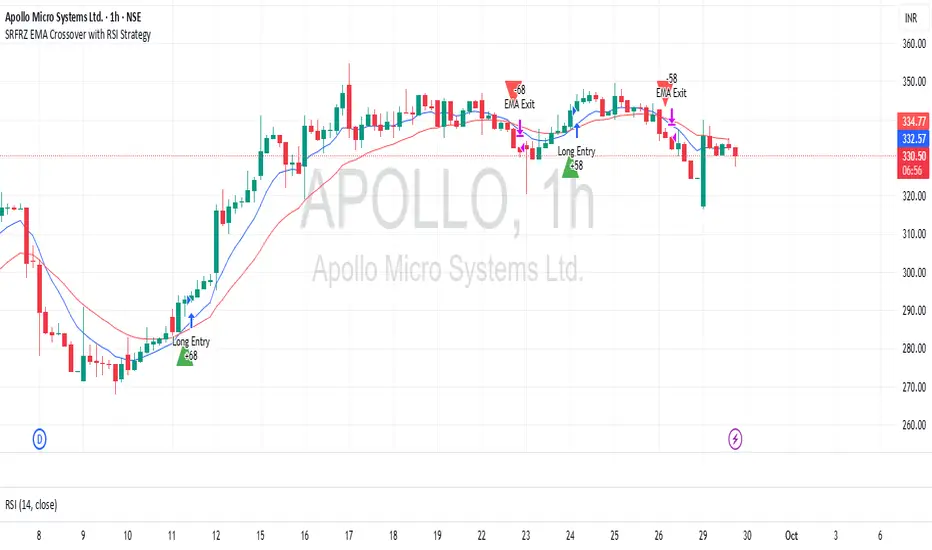
SRFRZ EMA Crossover with RSI StrategySRFRZ EMA Crossover with RSI Strategy
1. Overview
Strategy Name: SRFRZ EMA Crossover with RSI Strategy
Summary: A trend-following strategy designed for Indian stock and index markets, operating on any timeframe (optimized for 1H or 4H charts). It combines a 9-period and 21-period EMA crossover with RSI confirmation to identify high-probability long entries during the Indian trading session (9:15 AM–3:25 PM IST). Backtested with a fixed 20% capital allocation per trade, 3% stop loss, and 50% take profit, it aims for consistent returns in trending markets.
Intended Audience: Intermediate traders familiar with EMA and RSI, seeking automated signals for Indian markets.
2. How It Works (Core Logic)
Entry Conditions (Long/Buy Signal):
Primary Trigger: A "Golden Cross" occurs when the 9-period EMA crosses above the 21-period EMA, signaling bullish momentum.
RSI Confirmation: RSI (14-period) must be above 55, or cross above 55, to confirm strong momentum.
Trend Filter: The 9-period EMA must remain above the 21-period EMA for delayed RSI-triggered entries.
Session Filter: Trades are only executed during the Indian market session (9:15 AM–3:25 PM IST, Monday–Friday).
Exit Conditions:
Take Profit (TP): Fixed at 50% above the entry price (e.g., entry at ₹100, TP at ₹150).
Stop Loss (SL): Fixed at 3% below the entry price (e.g., entry at ₹100, SL at ₹97).
Indicator-Based Exit: Close the position if a "Death Cross" occurs (21-period EMA crosses above 9-period EMA).
Position Sizing: Allocates 20% of initial capital (₹100,000 default) per trade, calculated as (initial_capital * 0.20) / entry_price.
3. Key Indicators & Parameters
Primary Indicators:
EMA (9-period): Fast-moving average to capture short-term trends (plotted in blue).
EMA (21-period): Slower-moving average for trend confirmation (plotted in red).
RSI (14-period): Measures momentum, with a threshold of 55 for bullish confirmation (plotted in purple).
Customizable Settings in Pine Script:
initial_capital: Default ₹100,000 (adjust based on your account size).
qty_percent: Default 20% of capital per trade (adjust for risk tolerance).
sl_percent: Default 3% stop loss (adjust for volatility).
tp_percent: Default 50% take profit (adjust for reward targets).
session_time: Default "0915-1525:1234567" (Indian session, adjustable for other markets).
Default Values: Optimized for Indian stocks/indices (e.g., NIFTY 50) on 1H or 4H charts.
Risk Management:
Always use the built-in 3% stop loss.
Avoid trading during major news events (e.g., RBI announcements), as Pine Script cannot filter these.
Risk only 20% of capital per trade to diversify exposure.
Pro Tips:
Combine with support/resistance levels for manual confirmation.
Test on a demo account to validate performance on your chosen asset.
Monitor RSI for overbought conditions (>70) to anticipate reversals.
4. Visuals on Chart
Plotted Indicators:
Blue line: 9-period EMA.
Red line: 21-period EMA.
Purple line: RSI (14-period) in a separate pane.
Trade Signals:
Green triangle (below bar): Long entry.
Red triangle (above bar): Long exit (via TP, SL, or Death Cross).
5. Disclaimer & Notes
Risk Warning: Past performance is not indicative of future results. Trading involves significant risk. This strategy is for educational purposes only and is not financial advice.
Customization: The script is open-source (modify freely). Fork it to add short-selling logic or additional filters.
Note: The strategy avoids trades during non-session hours but cannot filter news events. Manually check economic calendars.
Add the script to your chart and adjust inputs (e.g., capital, TP/SL percentages).
Enable alerts for "Long Entry" and "Long Exit TP/SL" or "EMA Exit" to automate signals.
Optionally, connect to a broker via webhooks for auto-trading (consult your broker’s API).
AlgoAIDESIGNED FOR HEIKEN ASHI BARS
Gain Access here: algoai.store
AlgoAI
The Dark Edge of Trading
An AI-powered TradingView strategy that thrives across all markets. Short altcoin pumps. Ride NAS100 waves. Dominate gold, FX, stocks, and futures — all with one AI brain.
#1
Semi-Automatic Trading (Recommended)
Set up alerts on AlgoAI signals. As they come in, grade the setups and choose to enter manually. This gives you full control while leveraging AI precision.
#2
Fully Automated Trading
Pass signals via webhooks to TradersPost for futures or PineConnector for FX. Note: When running fully automated, it's suggested to use long-only or short-only mode to avoid side swiping and potential unintended drawdown.
BITSTAMP:BTCUSD

Liquidity+FVG+OB Strategy (v6)How the strategy works (summary)
Entry Long when a Bullish FVG is detected (optionally requires a recent Bullish OB).
Entry Short when a Bearish FVG is detected (optionally requires a recent Bearish OB).
Stop Loss and Take Profit are placed using ATR multiples (configurable).
Position sizing is fixed contract/lot size (configurable).
You can require OB confirmation (within ob_confirm_window bars).
Alerts still exist and visuals are preserved.

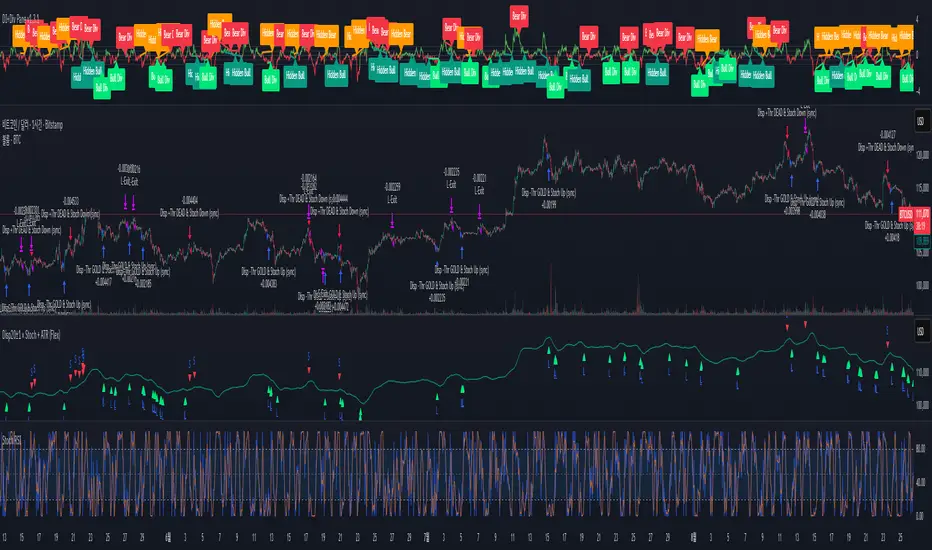
G. Santostasi Bitcoin Power Law StrategyG. Santostasi Bitcoin Power Law Strategy
Overview
The "G. Santostasi Bitcoin Power Law Strategy" is a TradingView strategy script built upon the foundational Bitcoin Power Law Theory by physicist Giovanni Santostasi.
Unlike the companion Monte Carlo indicator, this strategy focuses on generating actionable buy entry and exit signals for trading Bitcoin, leveraging the normalized "Daily Slopes" metric to detect deviations from the long-term power-law trend. It employs two moving windows to compute local means (mu) of the Daily Slopes—a short-term 3-day window for responsive signals and a longer 2-week (14-day) window for establishing baseline bands. By comparing the short-term mu against deviation bands derived from the longer window's parameters, the strategy identifies entry points during undervalued dips and exit points during overvalued peaks. This approach capitalizes on Bitcoin's scale-invariant behavior, where price follows a power law
P(t)= c t^n, with n~5.9.
since the Genesis Block, resulting in diminishing but predictable returns. Backtested over Bitcoin's full history, the strategy boasts a 77% winning rate and a profit factor of 3.2, making it a robust tool for trend-following with mean-reversion elements. It emphasizes Bitcoin's long-term stability while navigating short-term oscillations, treating cycles as temporary deviations from the core power-law "DNA.
"Core Concept: Daily Slopes
The strategy inherits the Daily Slopes metric from the power-law framework, which normalizes daily logarithmic returns to reveal a stable local slope that oscillates around the global value of ~5.9.Definition and Calculation:
Daily log returns: log(P2/P1)\, where P2 and P1 are consecutive closing prices.
Normalization: Divide by log((t+1)/t), where ( t ) is days since the Genesis Block, yielding:
Daily Slope=log(P2/P1)log((t+1)/t).
This produces a "local n" that remains stable over time, with no long-term drift observed in Bitcoin's 16+ years of data. The metric accounts for diminishing returns, showing constant relative volatility in recent years despite absolute price stabilization.
Distribution and Parameters:
Daily Slopes are fitted to a t-location scale distribution over moving windows, estimating:μ (mu): The location/mean, stable around 5.9 globally.
σ (sigma): Scale/volatility measure.
ν (nu): Degrees of freedom for tail heaviness.
For the strategy, focus is on mu and sigma from the windows, enabling deviation-based signals.
Strategy Logic: Dual Moving Window Mus and Deviation Bands
The strategy computes two mus via rolling fits to the t-distribution:
Short Window mu (3 days): A fast-moving average of Daily Slopes, sensitive to immediate price action for timely signals.
Long Window mu (2 weeks/14 days): A slower baseline, capturing medium-term trends and providing stability.
Deviation bands are derived from the long window's mu and sigma:
Upper Band: Long mu + Long sigma
Lower Band: Long mu - Long sigma
These bands represent 1-standard-deviation ranges around the longer-term mean, highlighting overbought and oversold conditions relative to the power-law trend. The short mu acts as a "signal line," crossing the bands to trigger trades.
Plotting:
Short mu: Responsive line for crossovers.
Long mu: Central baseline.
Bands: Upper (+σ) and lower (-σ) lines from the long window.
Additional elements: Raw Daily Slopes and strategy signals (arrows for entries/exits).
Entry and Exit Rules:
The strategy generates long-only signals (buy/sell) based on crossovers, assuming a single-position approach without leverage or shorting:
Buy Entry: Triggered when the short-window mu crosses above the lower band (long mu - long sigma). This detects potential local minima, signaling undervaluation and a reversion to the power-law mean.
Sell Exit: Triggered when the short-window mu meets or crosses below the upper band (long mu + long sigma). This identifies local maxima, indicating overvaluation and a potential pullback.
Trade Management:
No stop-loss or take-profit hardcoded; users can add via TradingView settings.
Positions close on exit signals, with re-entry on the next valid buy.
Filters for false signals: Optional confirmation from global slope (e.g., only trade if long mu > 5.0) to align with bullish regimes.
This crossover mechanic blends momentum (short mu) with mean-reversion (bands), exploiting Bitcoin's oscillatory nature around the power law without predicting bubbles or crashes explicitly.
Performance Metrics:
Backtested on BTCUSD daily data from the Genesis Block to present (assuming continuous updates):Winning Rate: 77% – A high hit rate due to the strategy's focus on statistically stable deviations.
Profit Factor: 3.2 – Gross profits are 3.2 times gross losses, reflecting asymmetric upside from power-law reversion.
Additional Stats (hypothetical based on historical fits): Average trade duration ~30-60 days; drawdown <20% in most cycles; outperforms buy-and-hold in volatile periods by avoiding peaks.
Caveats: Past performance is not indicative of future results. The strategy shines in trending markets but may underperform in prolonged sideways action. Transaction costs (e.g., fees, slippage) not included in base metrics.
Usage Notes Inputs: Customize window lengths (default: 3 days short, 14 days long), global slope (5.9), and signal thresholds. Enable alerts for entries/exits.
Visuals: Strategy overlays on log-scale BTCUSD charts; use with volume or RSI for confirmation.
Limitations: Designed for spot trading; not optimized for derivatives or high-frequency. Assumes power-law persistence—major regime shifts (e.g., adoption plateaus) could impact efficacy.
Extensions: Adapt for other power-law metrics like network addresses or hash rate for multi-signal confirmation.
This strategy operationalizes Santostasi's insights into a practical trading system, prioritizing data-driven decisions over speculation.

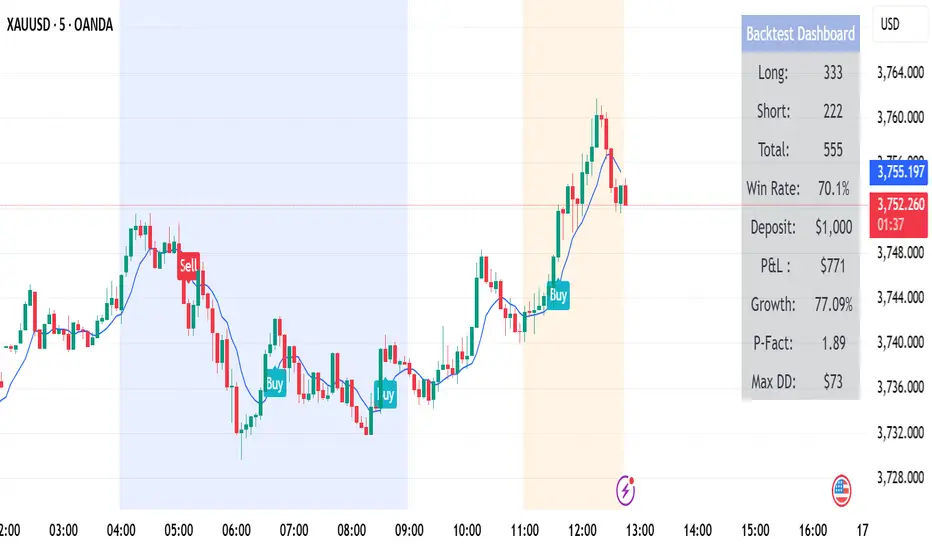
AR Alerts Basic 🤖A non-repainting, ATR-based trailing stop strategy and session-based trading filters.
Features:
Dynamic buy/sell trailing stops using ATR for stable exits.
EMA exit for remaining positions to lock in profits.
Time session filters: trade only during defined market hours.
Trend detection using EMA50/EMA100 coloring.
Backtest dashboard Table showing total trades, win rate, P&L, growth, profit factor, and max drawdown. can be uncheck from Style Tab.
Fully non-repainting signals for reliable historical testing.
Perfect for traders who want stable signals, trailing stops, and a clean backtest summary in one indicator.
@infonatics
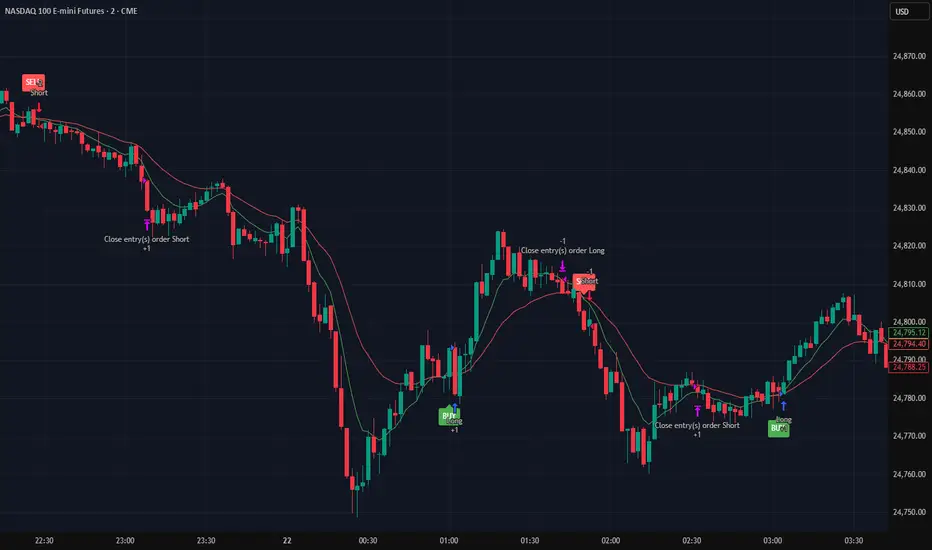
Alpha SignalsThis strategy is designed to highlight potential short-term market setups using a fast and slow EMA crossover system on a 5-minute chart. It provides visual signals directly on the chart to help traders observe trend changes and potential entry points.
Key Features:
EMA Crossover Entries – The strategy enters long trades when the fast EMA crosses above the slow EMA and short trades when the fast EMA crosses below the slow EMA.
Time-Based Exits – Trades are automatically closed after a configurable number of bars to manage exposure.
Visual Alerts – Buy and sell signals are displayed as labels directly on the chart for easy interpretation.
Configurable Settings – Users can adjust fast and slow EMA lengths as well as the exit bar count to suit their trading preferences.
Usage:
Suitable for short-term traders focusing on the NQ1 futures contract or other instruments with similar volatility.
Can be used for observation, back testing, or as a confirmation tool alongside other strategies.
Does not guarantee profitability; intended for educational purposes and strategy testing only.
Small-Cap — Sell Every Spike (Rendon1) Small-Cap — Sell Every Spike v6 — Strict, No Look-Ahead
Educational use only. This is not financial advice or a signal service.
This strategy targets low/ mid-float runners (≤ ~20M) that make parabolic spikes. It shorts qualified spikes and scales out into flushes. Logic is deliberately simple and transparent to avoid curve-fit.
What the strategy does
Detects a parabolic up move using:
Fast ROC over N bars
Big range vs ATR
Volume spike vs SMA
Fresh higher high (no stale spikes)
Enters short at bar close when conditions are met (no same-bar fills).
Manages exits with ATR targets and optional % covers.
Tracks float rotation intraday (manual float input) and blocks trades above a hard limit.
Draws daily spike-high resistance from confirmed daily bars (no repaint / no look-ahead).
Timeframes & market
Designed for 1–5 minute charts.
Intended for US small-caps; turn Premarket on.
Works intraday; avoid illiquid tickers or names with constant halts.
Entry, Exit, Risk (short side)
Entry: parabolic spike (ROC + Range≥ATR×K + Vol≥SMA×K, new HH).
Optional confirmations (OFF by default to “sell every spike”): upper-wick and VWAP cross-down.
Stop: ATR stop above entry (default 1.2× ATR).
Targets: TP1 = 1.0× ATR, TP2 = 2.0× ATR + optional 10/20/30% covers.
Safety: skip trades if RVOL is low or Float Rotation exceeds your limit (default warn 5×, hard 7×).
Inputs (Balanced defaults)
Price band: $2–$10
Float Shares: set per ticker (from Finviz).
RVOL(50) ≥ 1.5×
ROC(5) ≥ 1.0%, Range ≥ 1.6× ATR, Vol ≥ 1.8× SMA
Cooldown: 10 bars; Max trades/day: 6
Optional: Require wick (≥35%) and/or Require VWAP cross-down.
Presets suggestion:
• Balanced (defaults above)
• Safer: wick+VWAP ON, Range≥1.8×, trades/day 3–4
• Micro-float (<5M): ROC 1.4–1.8%, Range≥1.9–2.2×, Vol≥2.2×, RVOL≥2.0, wick 40–50%
No look-ahead / repaint notes
Daily spike-highs use request.security(..., lookahead_off) and shifted → only closed daily bars.
Orders arm next bar after entry; entries execute at bar close.
VWAP/ATR/ROC/Vol/RVOL are computed on the chart timeframe (no HTF peeking).
How to use
Build a watchlist: Float <20M, RelVol >2, Today +20% (Finviz).
Open 1–5m chart, enter Float Shares for the ticker.
Start with Balanced, flip to Safer on halty/SSR names or repeated VWAP reclaims.
Scale out into flushes; respect the stop and rotation guard.
Limitations & risk
Backtests on small-caps can be optimistic due to slippage, spreads, halts, SSR, and limited premarket data. Always use conservative sizing. Low-float stocks can squeeze violently.
Alerts
Parabolic UP (candidate short)
SHORT Armed (conditions met; entry at bar close)

Hilly's Reversal Scalping Strategy - 5 Min CandlesHow to Use
Copy the Code: Copy the script above.
Paste in TradingView: Open TradingView, go to the Pine Editor (bottom of the chart), paste the code, and click “Add to Chart.”
Set Timeframe: Ensure the chart is set to 5-minute candles (TradingView: right-click chart > Timeframe > 5 Minutes).
Check for Errors: Verify no errors appear in the Pine Editor console.
Apply to Chart: Use a liquid crypto pair (e.g., BTC/USDT, ETH/USDT on Binance or Coinbase).
Verify Signals:
Green “BUY” labels and triangle-up arrows for bullish reversals (e.g., bullish engulfing, hammer, doji, morning star, three white soldiers, double bottom in a downtrend).
Red “SELL” labels and triangle-down arrows for bearish reversals (e.g., bearish engulfing, shooting star, doji, evening star, three black crows, double top in an uptrend).
Green/red background highlights for signal candles.
Backtest: Use TradingView’s Strategy Tester to evaluate performance over 1–3 months, checking Net Profit, Win Rate, and Drawdown.
Demo Test: Run on a demo account to confirm signal visibility and performance before trading with real funds.
Troubleshooting
If Errors Occur: If any errors appear in TradingView’s Pine Editor console (e.g., “Syntax error” or “Invalid argument”), please share the exact error messages to diagnose environment-specific issues.
Signal Overload: If too many signals appear, increase patternLookback to 15 or set volFilter = volume > volMa * 2.0.
Missed Signals: If signals are too rare, set useVolumeFilter=false or reduce patternLookback to 5.
Additional Features: If you need alerts, other indicators (e.g., EMA, RSI), or dynamic arrow sizing, please specify. Note that dynamic sizing caused errors previously, so I’ve kept size=size.normal.

Sr.Ram.GodSoun.Market StructureDisclaimer: This chart is for educational purposes only. Please do your own due diligence — this is not trade advice. Any signals for buys, sells, calls, or puts are purely strategy outputs and should not be considered trading recommendations.
This strategy is designed for "SPY" and "QQQ" on a 3-minute time frame. It is built on market-structure breakouts, identifying swing highs and lows using a configurable Market Structure Duration.
A bullish breakout triggers a Calls (long) entry, while a bearish breakout triggers a Puts (short) entry.
Signals are filtered with session-based exclusions, ensuring no entries or exits occur during the following EST time windows:
09:30 – 09:45
12:00 – 13:00
15:30 – 16:00
Risk management is enforced through percentage-based exits:
Close Longs and switch to Puts if price moves 0.2%
Close Puts and switch to Calls if price moves 0.2%
The strategy also incorporates re-entry logic after a stop-out:
Re-enter Puts on a further 0.3% breakdown.
Re-enter Calls on a further 0.3% breakout.
Built-in alerts cover all entries, exits, and re-entries, enabling seamless use with automated trading or notifications.

Sr.Rma.Prev High/lows with Alerts
Disclaimer: This chart is designed for educational purposes only. Please conduct your own due diligence before entering any trades.
The strategy is based on previous highs and lows, combined with stop-loss and reversal percentage logic. It is most effective on SPY and QQQ using the 1-minute time-frame, where I personally trade next-day expiration with preset configurations.
If you choose to apply it to other stocks, be sure to adjust the stop-loss % and re-entry % parameters to match your trading style and risk tolerance.

Dynamic Swing Anchored VWAP STRAT (Zeiierman/PineIndicators)Dynamic Swing Anchored VWAP STRATEGY — Zeiierman × PineIndicators (Pine Script v6)
A pivot-to-pivot Anchored VWAP strategy that adapts to volatility, enters long on bullish structure, and closes on bearish structure. Built for TradingView in Pine Script v6.
Full credits to zeiierman.
Repainting notice: The original indicator logic is repainting. Swing labels (HH/HL/LH/LL) are finalized after enough bars have printed, so labels do not occur in real time. It is not possible to execute at historical label points. Treat results as educational and validate with Bar Replay and paper trading before considering any discretionary use.
Concept
The script identifies swing highs/lows over a user-defined lookback ( Swing Period ). When structure flips (most recent swing low is newer than the most recent swing high, or vice versa), a new regime begins.
At each confirmed pivot, a fresh Anchored VWAP segment is started and updated bar-by-bar using an EWMA-style decay on price×volume and volume.
Responsiveness is controlled by Adaptive Price Tracking (APT) . Optionally, APT auto-adjusts with an ATR ratio so that high volatility accelerates responsiveness and low volatility smooths it.
Longs are opened/held in bullish regimes and closed when the regime turns bearish. No short positions are taken by design.
How it works (under the hood)
Swing detection: Uses ta.highestbars / ta.lowestbars over prd to update swing highs (ph) and lows (pl), plus their bar indices (phL, plL).
Regime logic: If phL > plL → bullish regime; else → bearish regime. A change in this condition triggers a re-anchor of the VWAP at the newest pivot.
Adaptive VWAP math: APT is converted to an exponential decay factor ( alphaFromAPT ), then applied to running sums of price×volume and volume, producing the current VWAP estimate.
Rendering: Each pivot-anchored VWAP segment is drawn as a polyline and color-coded by regime. Optional structure labels (HH/HL/LH/LL) annotate the swing character.
Orders: On bullish flips, strategy.entry("L") opens/maintains a long; on bearish flips, strategy.close("L") exits.
Inputs & controls
Swing Period (prd) — Higher values identify larger, slower swings; lower values catch more frequent pivots but add noise.
Adaptive Price Tracking (APT) — Governs the VWAP’s “half-life.” Smaller APT → faster/closer to price; larger APT → smoother/stabler.
Adapt APT by ATR ratio — When enabled, APT scales with volatility so the VWAP speeds up in turbulent markets and slows down in quiet markets.
Volatility Bias — Tunes the strength of APT’s response to volatility (above 1 = stronger effect; below 1 = milder).
Style settings — Colors for swing labels and VWAP segments, plus line width for visibility.
Trade logic summary
Entry: Long when the swing structure turns bullish (latest swing low is more recent than the last swing high).
Exit: Close the long when structure turns bearish.
Position size: qty = strategy.equity / close × 5 (dynamic sizing; scales with account equity and instrument price). Consider reducing the multiplier for a more conservative profile.
Recommended workflow
Apply to instruments with reliable volume (equities, futures, crypto; FX tick volume can work but varies by broker).
Start on your preferred timeframe. Intraday often benefits from smaller APT (more reactive); higher timeframes may prefer larger APT (smoother).
Begin with defaults ( prd=50, APT=20 ); then toggle “Adapt by ATR” and vary Volatility Bias to observe how segments tighten/loosen.
Use Bar Replay to watch how pivots confirm and how the strategy re-anchors VWAP at those confirmations.
Layer your own risk rules (stops/targets, max position cap, session filters) before any discretionary use.
Practical tips
Context filter: Consider combining with a higher-timeframe bias (e.g., daily trend) and using this strategy as an entry timing layer.
First pivot preference: Some traders prefer only the first bullish pivot after a bearish regime (and vice versa) to reduce whipsaw in choppy ranges.
Deviations: You can add VWAP deviation bands to pre-plan partial exits or re-entries on mean-reversion pulls.
Sessions: Session-based filters (RTH vs. ETH) can materially change behavior on futures and equities.
Extending the script (ideas)
Add stops/targets (e.g., ATR stop below last swing low; partial profits at k×VWAP deviation).
Introduce mirrored short logic for two-sided testing.
Include alert conditions for regime flips or for price-VWAP interactions.
Incorporate HTF confirmation (e.g., only long when daily VWAP slope ≥ 0).
Throttle entries (e.g., once per regime flip) to avoid over-trading in ranges.
Known limitations
Repainting: Swing labels and pivot confirmations depend on future bars; historical labels can look “perfect.” Treat them as annotations, not executable signals.
Execution realism: Strategy includes commission and slippage fields, yet actual fills differ by venue/liquidity.
No guarantees: Past behavior does not imply future results. This publication is for research/education only and not financial advice.
Defaults (backtest environment)
Initial capital: 10,000
Commission value: 0.01
Slippage: 1
Overlay: true
Max bars back: 5000; Max labels/polylines set for deep swing histories
Quick checklist
Add to chart and verify that the instrument has volume.
Use defaults, then tune APT and Volatility Bias with/without ATR adaptation.
Observe how each pivot re-anchors VWAP and how regime flips drive entries/exits.
Paper trade across several symbols/timeframes before any discretionary decisions.
Attribution & license
Original indicator concept and logic: Zeiierman — please credit the author.
Strategy wrapper and publication: PineIndicators .
License: CC BY-NC-SA 4.0 (Attribution-NonCommercial-ShareAlike). Respect the license when forking or publishing derivatives.

Disparity(20MA) ±1 × Stochastic 80/20 + ATR SL/TP[by Irum]Disparity(20MA) ±1 × Stochastic 80/20 + ATR SL/TP
사용 설명서 (KR/EN Bilingual Manual)
1) 목적 & 정의 / Purpose & Definition
KR — 목적 & 정의
이 스크립트는 이격도(Disparity) 와 스토캐스틱(80/20) 의 동시 신호를 활용해 추세 전환/지속 구간의 고확률 진입 시점을 포착하고, ATR 기반 손절/익절(고정 또는 트레일링)로 리스크를 정량화하여 운용 효율을 높이기 위해 설계되었습니다.
핵심 아이디어:
가격이 20MA 대비 ±임계값을 크로스(과열/침체 해소 신호)하고,
스토캐스틱이 80/20을 돌파/이탈(모멘텀 전환 신호)할 때,
두 신호가 동일봉 또는 N봉 내 동기화되면 진입.
청산: ATR×배수를 이용한 고정 TP/SL 또는 ATR 트레일링.
EN — Purpose & Definition
This strategy combines Disparity (price vs. 20MA) and Stochastic (80/20) to identify high-probability entries when momentum confirms mean-reversion/continuation, while ATR-based stops/take-profits (fixed or trailing) provide quantified risk control.
Core Idea:
Disparity crosses ±threshold (overbought/oversold release),
Stochastic crosses 80/20 (momentum shift),
Both conditions sync on the same bar or within N bars → entry.
Exits: Fixed ATR TP/SL or ATR trailing.
2) 신호 로직 요약 / Signal Logic Overview
KR
롱 진입: Disparity가 −임계값 상향 돌파 & Stochastic 20 상향 돌파가 syncBars 이내에 동시 충족.
숏 진입: Disparity가 +임계값 하향 돌파 & Stochastic 80 하향 돌파가 syncBars 이내에 동시 충족.
완화 옵션(useRelaxStoch): 최근 relaxLookback 내 20/80 터치 이력 + 현재 방향성만으로도 모멘텀 전환을 인정(교차 미충족 보완).
EN
Long: Disparity crosses up −threshold & Stochastic crosses up 20 within syncBars.
Short: Disparity crosses down +threshold & Stochastic crosses down 80 within syncBars.
Relaxed option (useRelaxStoch): Accepts momentum shift if 20/80 was touched in the last relaxLookback bars and the current slope confirms, even without a strict cross.
3) 설정 메뉴 안내 / Settings Menu Guide
A. 기본 / Core
기준가격 / Source (source)
설명: Disparity 계산에 쓰는 가격 소스.
입력: close, hl2, ohlc4 등.
기본값: close.
팁: 변동성 큰 종목은 hlc3/ohlc4가 노이즈를 줄이기도 함.
이격도 기준 MA 길이 / MA Length (for Disparity) (int ≥1)
설명: Disparity의 기준선이 되는 단순이동평균 길이.
기본값: 20.
영향: 길이↑ → 신호 빈도↓, 안정성↑.
이격도 임계값(±%) / Disparity Threshold (±%) (float ≥0.1, step 0.1)
설명: Disparity가 +임계값 아래로 하향 크로스(숏) 또는 −임계값 위로 상향 크로스(롱)할 때 신호.
기본값: 1.0%.
팁: 너무 크면 신호 드뭄, 너무 작으면 과다.
B. 스토캐스틱 / Stochastic
%K Length / K 길이 (int ≥1, 기본 14)
%K Smoothing / K 스무딩 (int ≥1, 기본 1)
%D Length / D 길이 (int ≥1, 기본 3)
설명: ta.stoch의 K를 스무딩한 kSlow와, 추가 스무딩한 dSlow(참조용)를 구성.
Buy Level (↑20) / 매수 기준선 (0~100, 기본 20)
Sell Level (↓80) / 매도 기준선 (0~100, 기본 80)
C. 신호 로직 / Signal Logic
Signal Sync Window (bars) / 신호 동기화 윈도우 (0~10, 기본 0)
설명: 0=두 신호가 같은 봉에서 모두 충족해야 함. N>0=최근 N봉 내에서 각각 한 번 발생하면 인정.
팁: 1~3은 현실적 체결/지연을 반영하며 과최적화 방지에 도움.
Relaxed Stochastic? (교차 완화) (bool, 기본 false)
설명: 교차 대신 최근 20/80 터치 + 현재 기울기만으로도 모멘텀 전환을 인정. 신호 빈도↑.
Relax lookback bars (int ≥1, 기본 5)
설명: 완화판정에 쓰는 최근 봉 수.
D. 리스크 / Risk (ATR)
ATR Length / ATR 길이 (int ≥1, 기본 14)
ATR Mult for Stop / 손절 ATR 배수 (float ≥0.1, 기본 1.5)
ATR Mult for Take-Profit / 익절 ATR 배수 (float ≥0.1, 기본 2.0)
설명: 진입가 ± ATR×배수로 SL/TP 설정.
팁: 변동성 큰 자산은 SL 배수↑, TP 배수도 함께 조정 권장.
Use ATR Trailing Stop? / ATR 트레일링 사용 (bool, 기본 false)
ATR Mult for Trailing / 트레일링 ATR 배수 (float ≥0.1, 기본 2.0)
설명: 고정 TP/SL 대신 추적 손절을 사용(수익 추적에 유리).
E. 시각화 / Visualization
Plot 20MA / 20MA 표시 (bool, 기본 true)
Show Entry Markers / 진입 마커 표시 (bool, 기본 true)
4) 진입·청산 규칙 / Entry & Exit Rules
KR
진입: 위 “신호 로직” 충족 시 strategy.entry("L"/"S").
청산 (고정형):
롱: Stop = 진입 − ATR×SL, TP = 진입 + ATR×TP
숏: Stop = 진입 + ATR×SL, TP = 진입 − ATR×TP
청산 (트레일링형):
ATR×trailMult로 산출한 trail_points/offset으로 추적 손절.
EN
Entry: Place strategy.entry("L"/"S") when sync conditions are met.
Exit (Fixed):
Long: Stop = Entry − ATR×SL, TP = Entry + ATR×TP
Short: Stop = Entry + ATR×SL, TP = Entry − ATR×TP
Exit (Trailing):
Use ATR×trailMult as trailing distance & offset.
5) 알림 / Alerts
조건
Long Entry (Disp −Thr & Stoch Up, sync) → longSignal
Short Entry (Disp +Thr & Stoch Down, sync) → shortSignal
메시지 포맷 / Message format
{"signal":"long|short","symbol":"{{ticker}}","price":{{close}}}
Webhook(예: 거래소·봇)에서 signal/symbol/price를 활용해 체결 로직과 연동하십시오.
6) 빠른 시작 & 권장 프리셋 / Quick Start & Suggested Presets
KR — BTC/USDT (15분봉) 제안
maLen=20, thrPct=1.0~1.5, kLen=14, kS=1, dLen=3, stBuyLv=20, stSellLv=80
syncBars=1~3 (동시성 여유), useRelaxStoch=true, relaxLookback=5
고정형: atrLen=14, atrMultSL=1.5~2.0, atrMultTP=2.0~3.0
트레일링형: useTrail=true, trailMult=2.0~3.0
EN — BTC/USDT (15-min) suggestion
Above defaults, with syncBars=1~3, useRelaxStoch=true to improve fill realism.
Increase atrMultSL on high-volatility days to reduce whipsaws.
7) 운용 팁 & 점검 / Tips & Troubleshooting
KR
신호가 안 나와요: thrPct가 지나치게 크거나 syncBars=0으로 너무 엄격할 수 있음. thrPct↓, syncBars↑ 조정.
휩쏘 과다: useRelaxStoch를 끄거나 thrPct↑, atrMultSL↑.
TP 도달 전에 청산: 트레일링 사용 시 변동성 확대로 SL이 따라붙다 체결될 수 있음 → trailMult↑ 또는 고정형 전환.
과최적화 방지: 한 구간에 과특화된 튜닝(특히 syncBars, thrPct)은 다른 시장에서 성능 저하. Walk-forward 권장.
EN
No signals: Lower thrPct and/or increase syncBars.
Too many whipsaws: Disable relaxed mode, raise thrPct and/or atrMultSL.
Stopped before TP (trailing): Increase trailMult or switch to fixed exits.
Robustness: Avoid over-tuning; validate via walk-forward testing.
ENAUSDT.P Strategy – Alerts Ready (JSON)Ena/usdt trend trading strategy.
Backtesting results:
Starting date: 2 September 2025
7 days:
PnL: +13.91 (+1.39%)
Max drawdown: -17.68 (-1.73%)
Total trades: 22
Win rate: 63.64%
Profit factor: 1.82
30 days:
PnL: +81.16 (+8.12%)
Max drawdown: -26.38 (-2.51%)
Total trades: 89
Win rate: 68.54%
Profit factor: 2.52
90 days:
PnL: +270.64 (+27.06%)
Max drawdown: -36.29 (-3.34%)
Total trades: 273
Win rate: 67.09%
Profit factor: 2.72
365 day:
PnL: +702.89 (+70.29%)
Max drawdown: -130.40 (-10.16%)
Total trades: 986
Win rate: 65.42%
Profit factor: 1.67

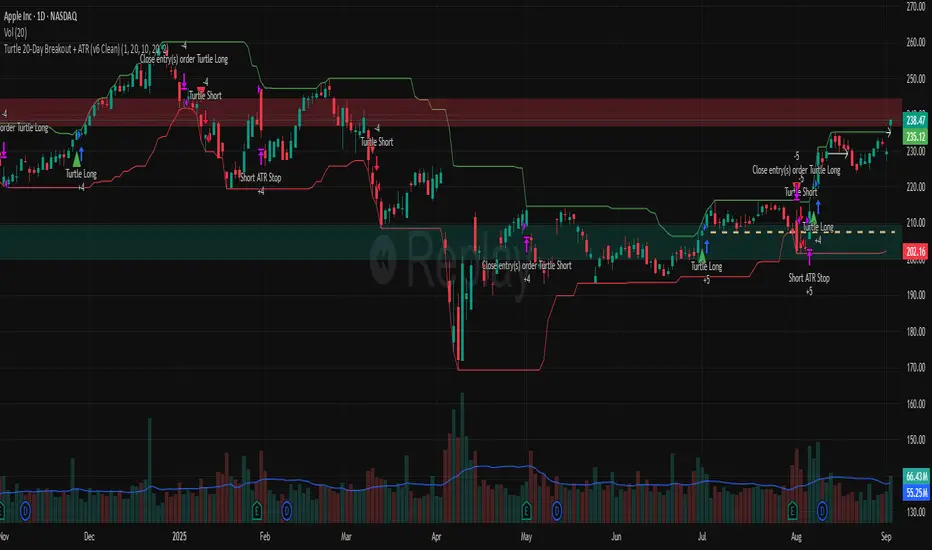
Turtle 20-Day Breakout + ATR (v6 Clean)20-bar breakout entries
ATR protective stops
Classic 10-bar opposite breakout exits
Proper plotting of breakout levels and stops
Signals on chart
Alert conditions in global scop
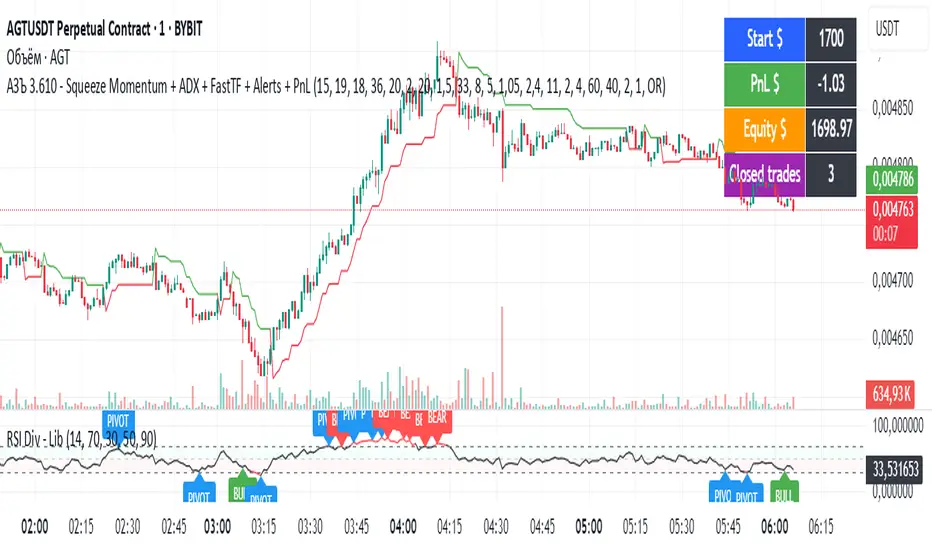
АЗЪ 3.610 - Squeeze Momentum + ADX + FastTF + Alerts + PnLStrata genius squeeze momentum + tester + adx +fast tf
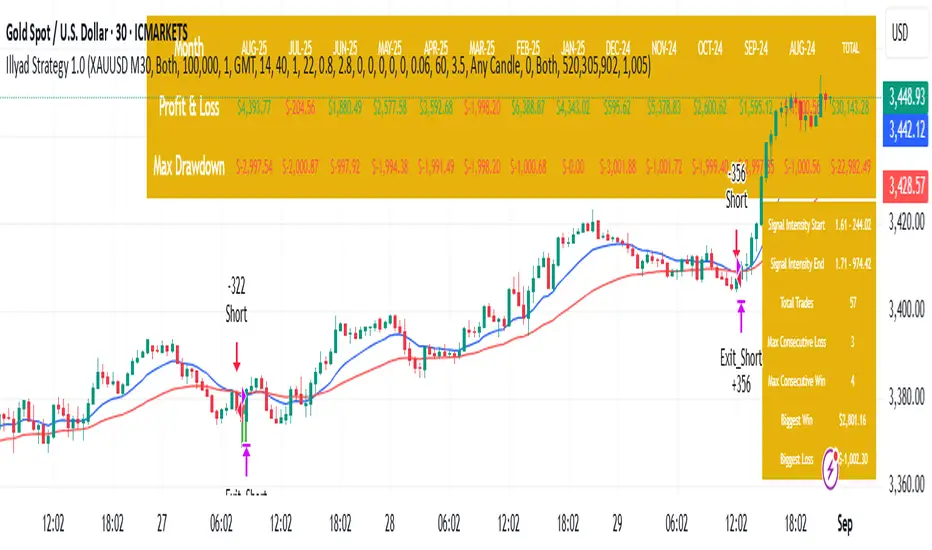
Optimised XAU/USD (Gold, IC Markets, 30m)The Illyad Strategy 1.0 optimised for XAU/USD (Gold) on the 30-minute timeframe (IC Markets feed).
📊 Backtest Results (Jan 2024 – Aug 2025):
✅ Total P&L: +30,143.28 USD (+30.14%)
📉 Max Drawdown: 3.60% (3,945.84 USD)
🔁 Total Trades: 57
📈 Win Rate: 42.11% (24/57 trades)
⚖️ Profit Factor: 1.91
This setup shows steady performance and low drawdown on Gold — ideal for traders wanting to capture volatility while maintaining consistency.
🔧 Optimisation Notes:
Works best on the 30m timeframe.
Each instrument (forex, indices, commodities, stocks) has unique behaviour.
To maximise results, always optimise the parameters per symbol — e.g., Gold requires a different configuration than GBP/USD or NASDAQ.
💡 Best Use Cases:
Prop firm challenges & scaling funded accounts.
Long-term compounding with low risk.
Automated execution via TradingView alerts → MT5 for hands-free trading.
⚠️ Disclaimer:
This strategy is for educational purposes only. Past results do not guarantee future performance. Always backtest and forward-test before going live.
📲 Next Steps:
This example demonstrates the Gold (XAU/USD) optimisation. The Illyad Strategy can be tuned for any forex pair, index, or commodity with proper optimisation.
👉 Visit my profile for full automation solutions.
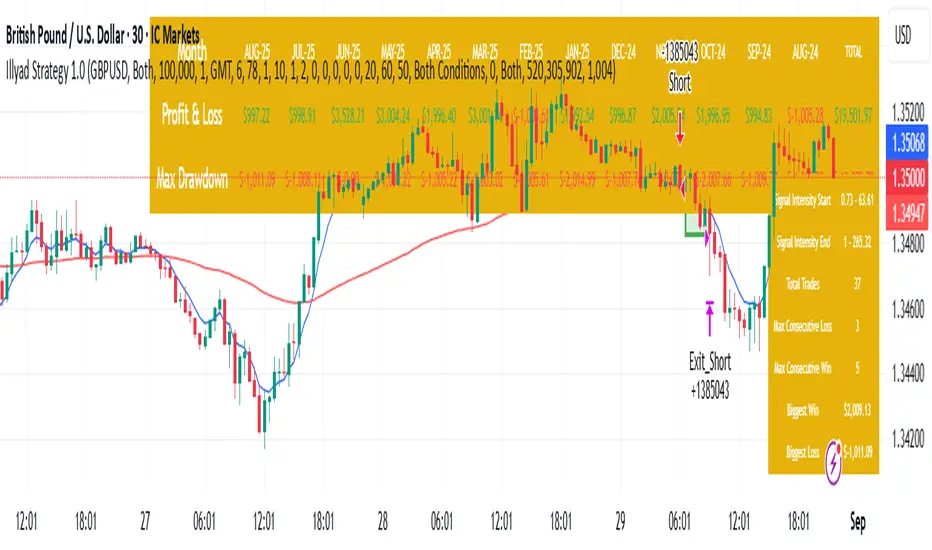
Optimised GBP/USD (IC Markets, 30m)This is the Illyad Strategy 1.0 optimised for GBP/USD on the 30-minute timeframe (IC Markets feed).
📊 Backtest Results (Jan 2024 – Aug 2025):
✅ Total P&L: +19,501.97 USD (+19.50%)
📉 Max Drawdown: 3.57% (3,607.64 USD)
🔁 Total Trades: 37
📈 Win Rate: 51.35% (19/37 trades)
⚖️ Profit Factor: 2.08
This version shows steady profitability with controlled drawdown, making it highly effective for prop firm evaluations and scaling accounts.
🔧 Optimisation Notes:
Works best on the 30-minute timeframe.
Each symbol behaves differently — always optimise the algo per instrument (e.g. GBP/USD vs EUR/GBP vs Gold).
Parameters such as moving averages, risk, and SL/TP ratios can be tuned to maximise performance.
💡 Best Use Cases:
Prop firm challenges (FTMO, AquaFunded, MyForexFunds, etc.).
Scaling funded capital by trading multiple accounts simultaneously.
Full automation via TradingView alerts → MT5 integration.
⚠️ Disclaimer:
This script is for educational purposes only. Past results do not guarantee future performance. Always backtest and forward-test on demo before going live.
📲 Next Steps:
This setup demonstrates the GBP/USD optimisation. The Illyad Strategy can be adjusted to perform across any forex pair, index, or stock with proper optimisation.
👉 Check my profile for full automation solutions.
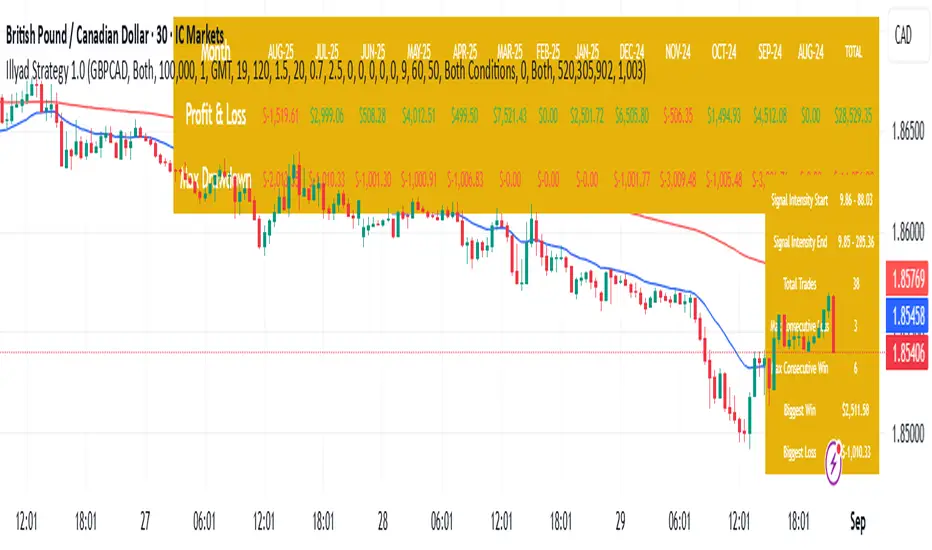
Optimised GBP/CAD (IC Markets, 30m) - Automated TradingHere’s the Illyad Strategy 1.0 optimised for GBP/CAD on the 30-minute timeframe (IC Markets feed).
📊 Backtest Results (Jan 2024 – Aug 2025):
✅ Total P&L: +28,529.35 CAD (+28.53%)
📉 Max Drawdown: 3.61% (3,822.27 CAD)
🔁 Total Trades: 38
📈 Win Rate: 50.00% (19/38 trades)
⚖️ Profit Factor: 2.49
This setup shows strong performance with low drawdown, making it well-suited for prop firm trading and long-term portfolio compounding.
🔧 Optimisation Notes:
Works best on the 30-minute timeframe.
Each symbol has unique volatility and structure. To maximise results, you must optimise the algo per symbol (e.g., GBP/CAD vs EUR/USD vs NASDAQ).
Parameters such as moving averages, signal intensity, and SL/TP levels should be tuned to the instrument.
💡 Best Use Cases:
Prop firm challenges (FTMO, AquaFunded, MyForexFunds alternatives).
Running across multiple accounts simultaneously for compounding.
Automated execution via TradingView alerts → MT5 integration.
⚠️ Disclaimer:
This script is provided for educational purposes only. Past results do not guarantee future performance. Always backtest and forward-test on demo before live trading.
📲 Next Steps:
This version demonstrates the GBP/CAD optimisation. The Illyad Strategy can be tuned to work on any symbol (forex, indices, or stocks).
👉 Visit my profile for full automation solutions (TradingView → MT5)
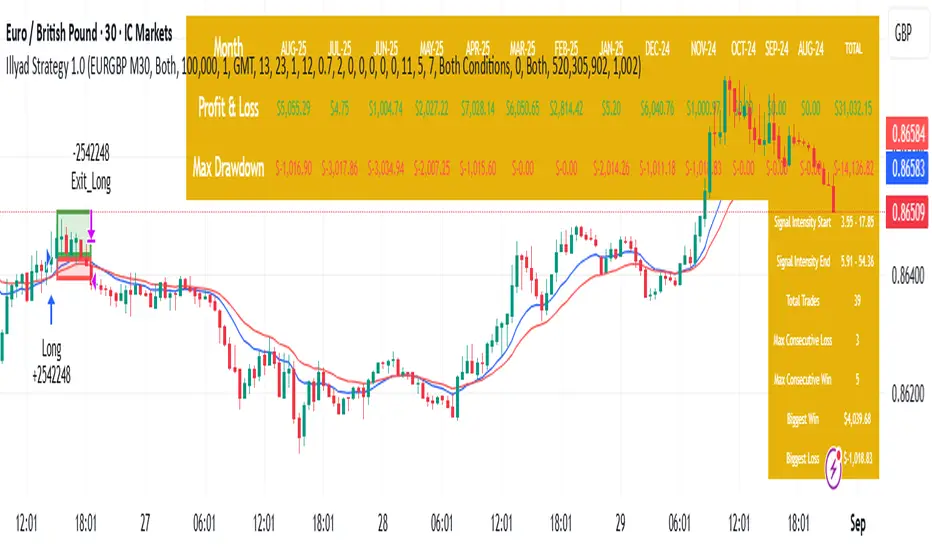
Optimised EURGBP (IC Markets, 30m)Illyad Strategy 1.0 – Optimised EURGBP (IC Markets, 30m)
Description:
This is the Illyad Strategy 1.0 optimised for EURGBP on the 30-minute timeframe (IC Markets feed).
📊 Results (Jan 2024 – Aug 2025):
✅ Total P&L: +£31,032.15 (+31.03%)
📉 Max Drawdown: 2.86% (£3,576.85)
🔁 Total Trades: 39
📈 Win Rate: 58.97%
⚖️ Profit Factor: 2.92
This strategy focuses on controlled drawdown + consistent growth, making it ideal for prop trading challenges and long-term account compounding.
🔧 Optimisation:
Works best on the 30m timeframe.
Each symbol behaves differently — for maximum performance, you should optimise the parameters (MAs, SL/TP, intensity) to the instrument you want to trade.
Example: The EURGBP setup shown here differs from what you’d use on NASDAQ, XAUUSD, or stocks like Tesla.
💡 Best Use Cases:
Passing and scaling prop firm accounts (FTMO, AquaFunded, etc.).
Automated alerts → MT5 integration (hands-free trading).
Consistent, rule-based trading without emotion.
⚠️ Disclaimer:
This script is for educational purposes only. Past results don’t guarantee future performance. Always backtest and forward-test on demo before live trading.
📲 Next Steps:
This version shows the EURGBP optimisation. If you want to run it on other pairs, indices, or stocks → simply optimise parameters for that symbol.
👉 For full automation (TradingView → MT5 execution), check my profile for details.
Twin Range Filter StrategyClarity Over Confusion: See price action through a全新的 lens. Watch as erratic, choppy movements are smoothed into a clear, actionable trajectory. The path of least resistance becomes obvious.
Confidence Over Hesitation: Receive high-probability entry and exit signals with a proven logic that waits for the market to commit before you do. No more second-guessing.
Discipline Over Emotion: Our algorithm enforces a systematic approach, helping you avoid emotional FOMO chasing and panic selling. Stick to the plan and execute with precision.
What Can You Expect?
Dynamic Adaptability: Unlike static indicators, continuously adapts to volatility. It widens its filter in turbulent markets to avoid whipsaws and tightens it in trending markets to capture more of the move.
The Power of Two: By synthesizing data from two distinct market perspectives, it confirms strength and filters out weakness, providing a confluence that standalone indicators simply cannot match.
Clean, Unambiguous Signals: We’ve eliminated the clutter. The software provides clear visual alerts (Green Arrows for Long, Red Arrows for Short) right on your chart, telling you exactly when the equilibrium has shifted.
Who is this for?
Swing Traders looking to capture the heart of a trend and avoid false breakouts.
Day Traders needing a reliable filter to navigate volatile intraday action.
Systematic Traders seeking a robust logic layer to add to their automated strategy.
Anyone overwhelmed by indicator overload and craving a single, trusted source of truth on their chart

