CryptoGraph StrategizerA complete system to backtest and automate comprehensive trading strategies
═════════════════════════════════════════════════════════════════════════
🟣 How it works
This indicator allows you to use buy & sell signals from external CryptoGraph indicators, and fully backtest these signals in the TradingView strategy tester. After configuring buy & sell signals, the trader can look into exit criteria with this indicator. The indicator offers percentage based an ATR based take profit/stop losses, as well as safety orders (DCA) in order to get a better average entry price.
Once your strategy is fully set up to your desired results, it's possible to set up alerts and connect the indicator through an automation platform ( API connection), to your broker. Alertatron & Wick Hunter auto configuration is included, meaning everything configured in the indicator settings, will automatically be carried out with Alertatron & Wick Hunter syntaxes.
🟣 Features
• Multiple methods of scaling in entries (Multiple DCA/Pyramiding methods). There will be an option to scale up or down your volume per order and distance between orders.
• Multiple methods of determining order sizes. Methods are percentage risk per trade, dollar risk per trade, position size in contracts, position size in percentage and position size in dollar.
• Multiple methods and levels of taking profits and losses. Both percentage based and ATR based take profit and stop loss.
• Option to use external indicator buy/sell signals for entry.
• Visualised liquidation prices in TradingView (both cross and isolated)
• Information panel on chart with additional information regarding your strategy results
• Bot setup directly from indicator inputs tab with Wick Hunter & Alertatron
🟣 How to use
• Choose a symbol that corresponds to your bot pair and exchange
• Pick a chart time frame
• Always use the regular candle type
• Configure your deal start condition
• Configure your profit target
• Use the Take Profit/Stop Loss feature to set a target for profit and loss
• Configure your safety orders
• Check your backtest parameters
•Make sure that the initial capital and order size make sense. Since you can use pyramiding in your strategy with safety orders, the sum of all deals should not be bigger than the initial capital
חפש סקריפטים עבור "alert"

Broadview Economic StudioThank you for taking the time to read this description. We'll be taking a look at the Broadview Economic Studio. This has been a work-in-progress for years and is a very powerful tool for planning trades with complex volume scaling strategies. We will be talking about many indicators and types of indicators used in the public domain, but it is NOT recommended to reverse engineer our scripts as there is quite a bit of logic in the code that works to make each common approach entirely unique. So although you may understand quite a bit about oscillators, the way they work with the rest of the logic within the script may change the way you know them to work from elsewhere.
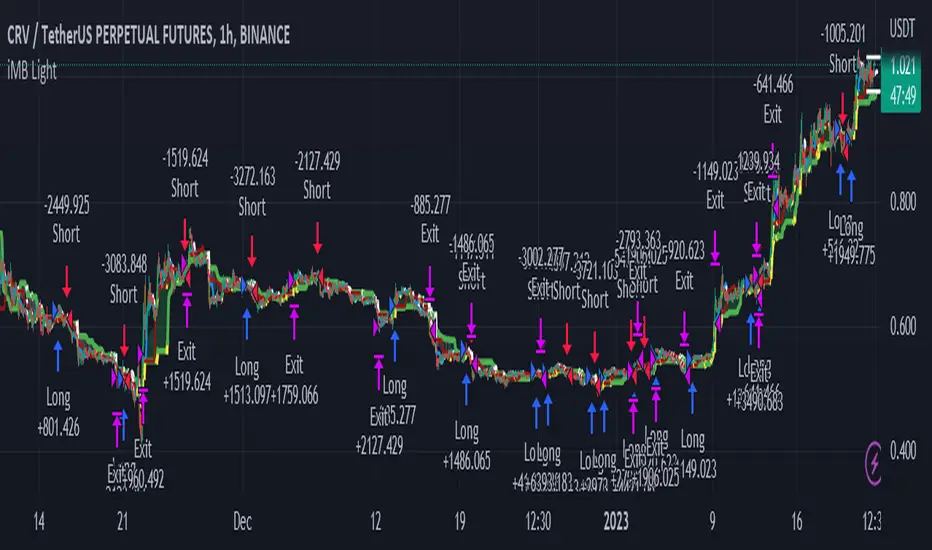
In the chart snapshot above you'll see a mild configuration where I only had to tweak a few settings. Commissions are set to 0.1%, starting capital is set to $10,000, and slippage is off. In my tests orders came through less than a penny off. Generally speaking, there are really only two situations in which you should be concerned about slippage. The first is if you trade really low timeframe charts like the 1 second. This tool, while it works for any timeframe, is programmed on the 45 minute timeframe and works best there. The other situation in which you should be prepared for slippage is if you're using extremely high volume trades in the hundreds of thousands or millions depending on the market cap and liquidity of the asset you're studying. Large orders like that have to be split up among several deals and that can cause slippage.
There are 31 primary inputs for users to tweak. Each input is grouped within a module called a Suite. Each suite has a focus like filtering signals or strategically allocating volume according to your strategy. Everything starts with the Origin Suite. The Origin Suite is a group of inputs that generates Tops & Bottoms from price action. It uses math like Rate of Change, where one can specify a required rate of change before an Origin signal can be made, and users can specify how much lower in price a bar must be compared to previous bars. So with the Origin Suite, users can control how often they want to see originating signals and under what conditions they can appear.
We used to use WVF and CVI to produce top and bottom signals, but our Origin Suite works much better for systematically generating profitable configurations.
The triangles you see on the chart represent markers, potential signals, or Prop Signals as they're referred to within the script. The blue arrows represent trades where Prop Signals were allowed to pass as true long signals. There are two ways to ignore Prop Signals. You can filter the markers entirely, or you can reduce their volume scaling to the minimum which is usually $10 for most exchanges. We're first going to be talking about some of the primary DCA inputs before we talk about the technology we use to filter and overload signals.
Here are some important features found within the script:
Base Orders
Safety Orders
Take Profits
Change-Based Volume Scaling
Ignoring Low or Medium Changes
Overloading
Filtering
Alert Messages w/ Volume Scaling
Let's walk through each of these features in more depth.
The Base Order is the initial Long position within a series. It comes in first and is followed by all of its Safety Orders. The Base Order is set to $25 within the script by default. Keeping the base order low allows one to reserve more of their capital for Safety Orders that are lower within a dip, and thus, lower the user's Position Average. The primary feature of this script is to help users plan their volume scaling strategically, and this is where we start. It's this kind of due diligence and effort in protecting trades that makes this script unique.
So we start with a low Base Order. Then, we follow with a lot of Safety Orders. Typically in DCA this is done in consistent time intervals and in consistent amounts. So in regular DCA one may invest the same amount bi-weekly on pay day. They use the financial instrument as a sort of savings and average their position over their consistent investments. This is not where the bleeding edge of DCA is today though. In modern Doller Cost Averaging, I would expect to see signals and volume scaling based on logic.. as opposed to being consistent intervals.
This sets up the explanation of the primary means of volume scaling within the script. Mathematically, we start with the net balance. This is your specified starting balance plus any wins or losses. Users specify what % of their Available Balance they would like to start with when volume scaling. This percent of capital is then multiplied by a Safety Order Multiplier. The safety order multiplier is made up of a number specified by the user, multiplied by the number of the Safety Order you're on. So user's can control this equation/algorithm and scale their investments as the number of Safety Orders increases and drops in price become more opportune.
The Take Profit within the script lets users specify their desired ROI from a series. So if a user sets a 60% take profit, the script will set a price from the position average that when reached will give the user a 60% ROI for the series including its Base Order and all its Safety Orders.
Before moving on, let's talk about the amazing internal reporting found in the script. When you zoom in on the blue arrows, you can see each trade is accompanied by some extremely helpful information. This is just another feature that makes this script unique, it is the feature that gives us accurate reporting and ultimately allows us to connect with TradingView's Strategy Tester in a way that provides instant backtests with good merit. With this reporting not only can users get reports and information on trades made on different assets with different configurations, but user's can perform a deep dive on each configuration and know exactly what was going on for each trade. The first number is the number of the safety order the script is on. Remember, this is used in the primary volume scaling math. The second number is the amount the script spent on the current trade. The third number denotes the cumulative spending for the series. The final number displays the script's available balance at that time. With these numbers, the TradingView Strategy Tester, and the List of Trades feature, users can practice as much due diligence as they need during their studies.
Let's move on to talking about my favorite suite within the script, the Volume Scaling Suite. Here there are two primary means of controlling volume scaling. Although, in the near future there will be more.
In this suite you'll find Change-Based Volume Scaling and Position Average Volume Scaling. Position Average Volume Scaling is quite easy to explain. This feature only allows signals to pass if they are lower in price than your base order. In this way, users can apply most of their capital to trades that lower their position average. Simply having the money in the market can boost profits, but having a lower Position Average is the entire reason we DCA. Change-Based Volume Scaling is quite a bit more complex.
In theory, one could argue that every moment is a great moment to buy. It's just that some moments are more opportune than others. So it's not about perfect signals as much as it's about proper volume scaling.
Change-Based Volume Scaling allows us to set rules that dictate how much volume scaling is used based on the asset's current delta, or Rate of Change.
Using CBVS, one can downscale capital applied to signals with a low ROC, or simply ignore them. So if a signal comes in and the price hasn't changed very much then you can automatically use less volume for the trade. One can do the same thing for medium changes, and the user can specify what quantifies as a low or medium change. Users can give extra volume to signals with a greater rate of change, or overload signals with a high rate of change! So the CBVS feature gives users the ability to allocate volume based on logic rooted in the asset's rate of change. If a signal has dropped a lot in price, then generally, it is deserving of more capital and that's what makes this feature unique and so powerful.
There are two kinds of Overloading found in the script. There's overloading from CBVS, and then overloading from the 4 signal filtering suites. There's an important difference to note before we move on. Overloading performed by CBVS is based on ignored signals. So if you ignore low or medium change signals, and you have CBVS Overloading on, the script will allocate more capital to High Change signals. When signals are ignored, they are downscaled to $10. Whereas with the filtering suites, if a signal is filtered the Prop Signal triangle marker is removed entirely. The overloading in that scenario is simply applied to signals that aren't filtered. The reason it's done this way is because allowing ignored signals to still come in, with the lowest volume scaling possible, keeps the Safety Order count rising which works in the volume scaling math. This math is intrinsic to getting capital deep within dips and crashes.
So in future versions we may allow ignored signals to be filtered out entirely but for the time being, simply scaling them down to the lowest possible amount is what produces the best and most consistent configurations.
Let's talk about filtering signals, and the overloading provided within each filtering suite.
Here you can see our Overbought & Oversold Heatmap V3. This is a unique indicator that takes 15 common oscillators and visualizes them in a way that clearly denotes confluence. Looking at this indicator makes it easer to read cycles and trends. It is quite common for investors to base their entire scripts on one or more of the oscillators found within the OBOS Heatmap V3. So the OBOS Heatmap V3 is an awesome way to ensure your signals follow an oversold trend! The orange represents an oscillator being oversold, while the yellow represents it being overbought. Generally, when an asset is oversold it is a better time to buy. One can filter signals based on this information and use the Heatmap's unique ability to quantify confluences. In this script users can set a sensitivity and that sets the number of oscillators that must be in agreement before a signal is allowed to pass.
Here are the oscillators found within the OBOS Heatmap:
*Please keep in mind that although some of these oscillators may have big names, the code and math in the script may work differently than you're used to. This is because the code and math is changed quite a bit, and the overall intended functionality of the OBOS Heatmap has a larger scope than any one indicator. It's also important to note that the lengths for these oscillators are set low and are meant to classify the individual signal as either overbought or oversold, and not the entire period. So while the OBOS Heatmap is awesome for trends and cycles, it's ultimately meant to classify individual price bars as either overbought or oversold according to a consensus.*
Relative Strength Index
Money Flow Index
Commodity Channel Index
Aroon Oscillator
Relative Volatility Index
Fast Stochastic Detrended Price Oscillator
Fast Stochastic Elders Force Index
Fast Stochastic Relative Strength Index
Fast Stochastic Relative Vigor Index
Fast Stochastic Klinger Oscillator
Fast Stochastic Awesome Oscillator
Fast Stochastic Ultimate Oscillator
Fast Stochastic Chande Momentum Oscillator
Fast Stochastic On Balance Volume Oscillator
Fast Stochastic Moving Average Convergence/Divergence
Each band of the Overbought & Oversold Heatmap represents an oscillator. When it's orange it's said to be oversold. When it's yellow it's said to be overbought. The indicator turns purple during trends and reversals where it is neither overbought nor oversold. It can differentiate between uptrends and downtrends with differing colors of purple, but the OBOS Heatmap is not used for trends or cycles in this script. It is used to quantify oversold confluence.
Let's talk about the Dominance Suite.
First note in the top portion of the screenshot above, you will see various colors in the script. It replaces the price line with something we call Price Flow bars. So when you add the script it's best to make the stock price line invisible in TV settings. The Price Flow Bars use a preset EMA to color price action as being in either a downward momentum or upward momentum. The triangular signals represent dark teal for the initial long marker within a series, dark green for long orders and long signals that convert into safety orders, and light green for safety orders. This is more logic that makes this script really unique. The dark green initial long marker signals are rarely seen. You can find them at the beginning of a new series of signals and they work to establish when a new series of signals should begin. The dark green signals actually denote a long base order opportunity, but if a series has already started then these signals are converted into Safety Orders. The Safety Orders then come in light green, and red for Prop Shorts. Prop Shorts work with Initial Longs to establish the start of a new series. More on that math I cannot tell.
In the bottom half of the screenshot is the Dominance Suite itself. It's another one of the four filtering suites found in the script. It is made up of 7 oscillators that work to classify a price bar as being controlled by either the bears or the bulls. If a price bar is controlled by the bears it is said to be a better investment. The Dominance Suite works by applying a moving average to the balance of power. This is the way TradingView has intended the balance of power to be used, and works quite nicely in classifying individual price bars as either bearish or bullish. It's not an overall trend indicator as much as it states whether a bar is mostly controlled by the bears or the bulls.
Here are the oscillators found within the Dominance Suite:
SMA of BOP
EMA of BOP
HMA of BOP
WMA of BOP
VWMA of BOP
TEMA of BOP
LSMA of BOP
Within the script, there is an input for a negative threshold. When each of these 7 oscillators is in confluence and below this set threshold, the Prop Long will be allowed to pass as a real trade.
Keep in mind that each filtering suite also has the option to overload signals.
So not only can you filter signals based on these suites but you can also apply additional volume scaling to signals that don't get filtered.
Here we have the True Oscillator. The True Oscillator is a brand new oscillator. It's similar to things like the RSI or DPO, but technically speaking it considers many more factors into its average than other oscillators. It considers balance of power, sentiment, volume, momentum, gravity, and places special-strategic weighting on price data based on whether it's opening, closing, high, or low. If you stack the True Oscillator up with the RSI you'll notice right away they look similar, but each movement is quite different. Overall the movements are more balanced, the individual bars are more consistent with price data, and the swings are more clearly pronounced while simultaneously having a better register of strength in momentum. We use this indicator to filter and overload signals, to trade according to momentum, and to provide a 16th independent oscillator that can check the OBOS Heatmap without having to be confluent.
The final filtering suite is based on Net Volume. It classifies signals as oversold when there is a significant negative trend in net volume. If Net Volume is under 0, and trends downward for either 3, 4, or 5 bars in a row then it will mark a signal as oversold and allow it to pass. Then, if overloading for this suite is turned on it will allocate more volume to signals it does not filter out.
There is a lot that can be said about this strategy. The primary takeaway though is that it's not just one strategy. It's a tool for everyone, to help them plan their approach to different assets in different market climates. This tool can help you study current market conditions. It can allow you to plan a strategic approach to market segments, and see how your strategy would fare if new market data performed similarly. It's not just one strategy, but more of a strategy printer.
The Origin Suite allows users to plan the positioning of their signals. The Overbought & Oversold Suite allows users to filter their signals based on whether or not they are oversold. The Dominance Suite allows users to filter signals based on whether the market is being controlled by the bears or the bulls. The True Oscillator gives users the ability to filter signals based on a deep and powerful momentum oscillator. The Net Volume Suite lets users filter signals based on volume trends. When signals are filtered, signals that pass, can be overloaded with additional volume scaling. Features like Change-Based Volume Scaling and Position Average Volume Scaling give users plenty of inputs to create complex volume scaling strategies. Common-sense DCA inputs allow users to scale into markets the way pros do.
The Broadview Economic Studio is a powerful tool for planning trades with complex volume scaling strategies.
Users can plan their approach to different kinds of markets. They can link the script with their bot or broker like 3Commas, and the script will automatically send the correct volume scaling through to the bot.
Thank you for your time, and for reading the description of the Broadview Economic Studio.

ichimoku Masters Backtester LightThis Indicator has so many options for build your own strategy
With this indicator you can build your own strategy using the options that we provided here
in the "Static Enter" Section you can choose where do you want to enter your position and customize it with "Enter Candle" Section,by specifying these options, the indicator will start opening the position for you and show you the backtest.
In the "Static Exit (SL & TP)" section you can choose where do you want to exit your positions with setting target and stop for your positions.
And at the end you can set alert on opening and closing position and be aware of that
We hope that you enjoy using ichimoku Masters Backtester Light
-Notice : The Sections: "Dynamic Enter" , "Dynamic Exit" , "9Br Enter" , "9Br Exit" , "Pre Cross" , "Cross Enter" , "Cross Exit" , "Chiko Enter" , "Break Enter" , "Pre Switch" , "Switch Enter" , "Switch Exit" , "Ichi Elements" , "Ichi Elements Order" and "Risk Management" are limited on this version and you are not able to use them
- the "Name" Argument is for naming your strategy
- Open Section has 3 options :
1 : Buy/Sell opens positions when ichimoku cloud and conversion and base line cross at the sametime
2 : 26BoxBr opens position when candle breaks the ichimoku 26 box that indicator builds on "Box" Section
3 : 52BoxBr opens position when candle breaks the ichimoku 52 box that indicator builds on "Box" Section
- Box Section has 6 options :
1 : Cr sets the box on conversion and base cross
2 : OldCr sets the box on conversion and base cross with the beginning candle
3 : PC sets the box on a cross which has no cross before until 26 candles
4 : 9Signal Box sets the box on 9 candles of open position candle
5 : 26Signal Box sets the box on 26 candles of open position candle
4 : 52Signal Box sets the box on 52 candles of open position candle
- Enter1% sets the percent of entry position
- Risk% sets the percent you want to risk your equity
- Max Leverage sets the maximum leverage you want to have on your positions
- S2S is for staying on the position and the indicator does not open the opposite position
- Enter Candle Section has 14 check boxes:
1 : Scandle means that our open position candle should be standard
2 : NoScandle means that our open position candle should not be standard
3 : Tr means that our open position candle should be green for long positions and red for short positions
4 : NoTr means that our open position candle should be red for long positions and green for short positions
5 : G means that our open position candle should be big candle
6 : NoG means that our open position candle should not be big candle
7 : 9Grd means that conversion line shoud be yellow for long positions and white for short positions
8 : No9Grd means that conversion line shoud not be yellow for long positions and white for short positions
9 : 26Grd means that base line shoud be yellow for long positions and white for short positions
10 : No26Grd means that base line shoud not be yellow for long positions and white for short positions
11 : 52Grd means that Lead2 line shoud be yellow for long positions and white for short positions
12 : No52Grd means that Lead2 line shoud not be yellow for long positions and white for short positions
13 : InCL means that our open position candle should be in ichimoku cloud
14 : OutCL means that our open position candle should not be in ichimoku cloud
- Static Exit (SL & TP)
- Sl Section has 6 Options:
1 : Middle26 sets the stop loss of the position on the middle of the box
2 : 9 Stop sets the stop loss of the position on the 9 candles box
3 : 26 Stop sets the stop loss of the position on the 26 candles box
4 : 52 Stop sets the stop loss of the position on the 52 candles box
5 : 26Double box sets the stop loss of the position on the Double of 26 candles box
6 : 52Double box sets the stop loss of the position on the Double of 52 candles box
- in TP we can set our targets from 1 to 20
- LogTp sets our target based on logarithm
- Multiple Enter:
in this section we can set our additional orders for open positions,for this you should turn on the "On" button and then set your orders base on box, for example:
when you put 50 on Enter2 and 10 on Enter2% ,then indicator sets an order on the 50 percent of box in 10% of your equity
- Multiple Exit:
in this section you can set your step exit of order, for this you should turn on the "on" button and set your steps on box targets, for example:
when you put 1 on Exit1 and 10 on Exit1% , then indicator exit 10 percent of your position on the target 1 of box
- RF Stands for risk free and you can risk free your positions using RF ,for example :
when you put 1 on RF and 10 on RF% ,then indicator place your stop on opening position candle when it touches the target 1 of the box and exits 10 percent of your position
- Ichi Numbers : in this section you can specify your ichimoku numbers
- C stands for Conv
- B stands for Base
- L stands for Lead2
- Visual Setting : in this section you can choose variable that you want to see on the chart
- Long TP/SL shows you the Long position target and stop
- Short TP/SL shows you the Short position target and stop
- Cloud shows you the ichimoku cloud
- Offset shifts the ichimoku clouds on 26 candles
- Conv shows you the conversion line
- Base shows you the base line
- Chiko shows you the chiko span line
- Pre shows you the point that conv prediction line and base prediction line cross each other and lead2 prediction line and lead1 prediction line cross too at the same time
- Cr shows you the cross point of conv and base lines
- PC shows the cross point of conv and base lines which has no cross up to 26 candles ago
- EqCr shows you the cross point of conv and base lines which the conv and base are equal
- Buy_Sell shows you the point that conv line and base line cross each other and lead2 line and lead1 line cross too at the same time
- Position Info shows you the information of position such as leverage and entry equity
- Enjoy :)
Strategy: Range BreakoutWhat?
In the price action, levels have a significant role to play. Based on the price moving above/below the levels - the underlying instrument shows some price-action in the direction of breakout/breakdown.
There are plenty of ways level can be determined. Levels are the decision point to take a trade or not. But if we make the level derivation complex, then the execution may get hamper.
This strategy script, developed in PineScript v5, is our attempt at solving this problem at the core by providing this simple, yet elegant solution to this problem.
It's essentially an attempt to Trade Simple by drawing logical (horizontal) lines in the chart and take actions, after multiple associated parameters confirmation, on the breakout / breakdown of the levels.
How?
Let us explain how we are drawing the levels.
We are depending on some of the parameters as described below:
Open Range : During intraday movement, often if prices move beyond a particular level, it exibits more movement in the same swing in same direction. We found out, through our back testing for Indian Indices like NSE:NIFTY , NSE:BANKNIFTY or NSE:CNXFINANCE the first 15m (i.e 09:15 AM to 09:30 AM, IST) is one of such range. For Indian stocks, it is 9:15 to 9:45. And for MCX MCX:CRUDEOIL1! it's 5:00 pm to 6:00 pm. There are our first levels.
PDHCL : Previous Day High, Close, Low. This is our next level
VWAP : The rolling VWAP (volume weighted average price)
In the breakout/breakdown of the Open Range and Previous Day High/Low, we are taking the trade decisions as follows using CEST principle:
C onditions :
If current bar's (say you are in 5m timeframe) closing is broken out the Open Range High or Previous Day High, taken a Buy/Long decision (let's say buying a Call Option CE or selling a Put Option PE or buying the future or cash).
If current bar's (say you are in 5m timeframe) closing is broken down the Open Range Low or Previous Day Low, taken a Sell/Short decision (let's say buying a Put Option CE or selling a Call Option PE or selling the future or cash).
Additionally, and optionally (default ON, one can turn off): we are checking various other associated multiple confirmations as follows:
1. Momentum : Checking 14-period RSI value is more than 50 or less than 50 (all parameters like period, OB, OS ranges are configurable through settings)
2. Current bar's volume is more than the last 20 bars volume average. How much more - that multiplier is also configurable. (default is 1)
3. The breakout candle is bullish (green) or bearish (red).
E ntry :
All of these happens only on the closing of the candle . Means: Non Repainting! .
Clearly in the chart we are showing as green up arrow BO (breakout for buy) and red down arrow BD (breakdown for sell) to take your decision process smooth.
So, on the closing of the decision BO/BD candle we are entering the trade (with a thumping heart and nail biting ...)
S top Loss :
We are relying on the time tasted (last 40 years) mechanism of Average True Range (ATR) of default 14 period. This default period is also configurable.
So for Long trades: the 14 period ATR low band is the SL.
For Short trades: the 14 period ATR high band is the SL.
T arget :
We are depending on the thump rule of 1:2 Risk Reward. It's simple and effective. No fancy thing. We are closing the trade on double the favorable price movement compared to the SL placed. Of course, this RR ratio is confiurable from the settings, as usual.
What's Unqiue in it?
The utter simplicity of this trading mechanism. No fancy things like complex chart pattern, OI data, multiple candlestick patterns, Order flow analysis etc.
Simple level determination,
Marking clearly in the chart.
Making each parameter configurable in Settings and showing tooltip adjacent to the parameter to make you understand it better for your customization,
Wait for the candle close, thus eliminating the chances of repainting menace (as much as possible)
Additional momentum and volume check to trade entry confirmation.
Works with normal candlestick (nothing special ones like HA ...)
Showing everything as a Summary Table (which, again can be turned off optionally) overlaying at the bottom-right corner of the chart,
Optionally the Summary Table can be configured to alert you back (say you get it notified in your email or SMS).
That way, a single, simple, effective trade setup will ease your journey as smooth sail as possible.
Mentions
There are plenty of friends from whom time to time we borrowed some of the ideas while working closely together over last one year.
From tradingview community, we took the spirit of @zzzcrypto123 awesome work done long back (in 2020) as the indicator "ORB - Opening Range Breakout". (We tried to reach him for his explicit consent, unable to catch hold of him).
Some other publicly available materials we have consulted to get the additional checks (like RSI, volume).
Lat word
Use it please and thank you for your constant patronage in following us in this awesome platform. Let's keep growing together.
Disclaimer :
This piece of software does not come up with any warrantee or any rights of not changing it over the future course of time.
We are not responsible for any trading/investment decision you are taking out of the outcome of this indicator.

The Zig Zag Leveler Strategy 1This indicator is designed to identify potential trade setups in the market using the ZigZag indicator. It uses a combination of the ZigZag indicator and the background fill color to help identify areas of support and resistance. It also uses a pip offset to help with entries and exits. Additionally, it can generate alert conditions when the market direction changes and when a buy or sell signal is generated. This indicator can be used to help identify potential trade setups and can be customized to fit the user's trading strategy.
This indicator takes the guesswork out of trading by providing traders with an array of signals that can help identify entry and exit points. The indicator uses two sets of signals to identify price levels that indicate potential entry and exit points - one set of signals that indicate potential entry points and another set of signals that indicate potential exit points. The indicator also provides traders with a visual representation of the signals that can help them better understand the signals and make informed trading decisions. With this indicator, traders can have a better understanding of the market and have a better chance of making profitable trades.

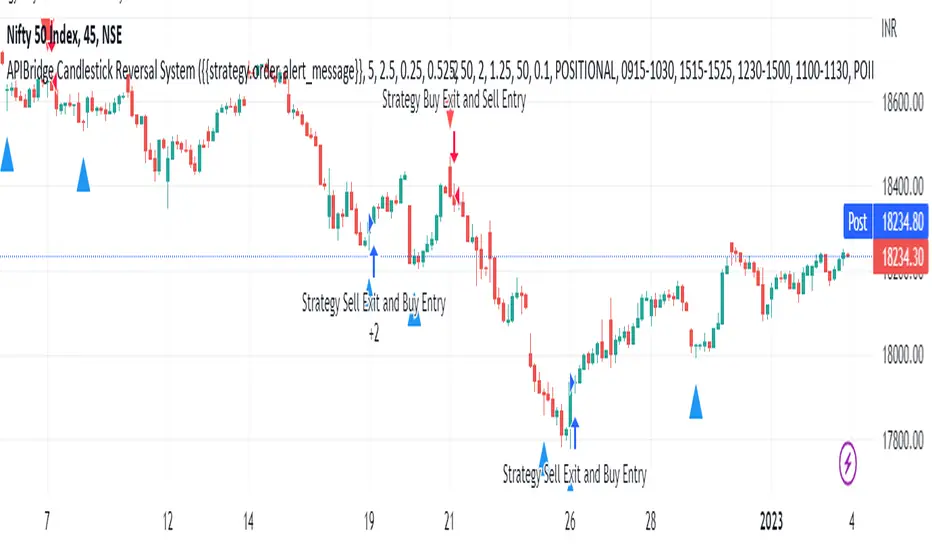
APIBridge Candlestick Reversal SystemStrategy Premise
This strategy uses the Wick Reversal System introduced in Pivot Boss and generates signals based on Candlestick Patterns.
– Wick Reversal System
– Extreme Reversal System
– Outside Reversal System
– Doji Reversal System
Wick Reversal System:
1. For a Bullish reversal wick to exist, the close of the bar should fall within the top 35% of the overall range of the candle.
2. For a bearish reversal wick to exist, the close of the bar should fall within the bottom 35% of the overall range of the candle.
Extreme Reversal System:
1. The first bar of the pattern is about two times larger than the average size of the candles in the look-back period.
2. The body of the first bar of the pattern should encompass more than 50% of the bar’s total range, but usually not more than 85%.
3. The second bar of the pattern opposes the first. If the first bar of the pattern is bullish (C > 0), then the second bar must be bearish (C < 0). If the first bar is bearish (C < 0), then the second bar must be bullish (C > 0).
Outside Reversal System:
1. The Engulfing bar of a bullish outside reversal setup has a low that is below the prior bar’s low (L < L) and a close that is above the prior bar’s high (C > H).
2. The Engulfing bar of a bearish outside reversal setup has a high that is above the prior bar’s high (H > H) and a close that is below the prior bar’s low (C < L).
3. The Engulfing bar is usually 5 to 25 percent larger than the size of the average bar in the look-back period.
Doji Reversal System:
1. The open and close prices of the Doji should fall within 10 percent of each other, as measured by the total range of the Candlestick .
2. For a Bullish Doji , the high of the Doji Candlestick should be below the ten-period Simple Moving Average (H SMA (10)).
4. For a Bearish Doji , one of the two bars following the Doji must close beneath the low of the Doji (C < L or C < L).
5. For a Bullish Doji setup, one of the two bars following the Doji must close above the high of the Doji (C > H) or C > H)
Strategy Logic
Long Entry:
When Low Pivot Point and Wick Reversal System and Bullish Wick Reversal Setup Pattern Send, LE
OR When Low Pivot Point and Extreme Reversal System and Bullish Extreme Reversal setup Send ,LE
OR When Low Pivot Point and Outside Reversal System and Bullish Outside Reversal Setup Send LE
OR When Low Pivot Point and Doji Reversal System and Bullish Doji Reversal Setup Send, LE
Long Exit:
Either when SL or Target is hit. If SL/ TGT is not hit and
When High Pivot Point and Wick Reversal System and Bearish Wick Reversal Setup Pattern Send LXSE
OR When High Pivot Point Extreme Reversal System and Bearish Extreme Reversal setup Send LXSE
OR When High Pivot Point Outside Reversal System and Bearish Outside Reversal Setup Send LXSE
OR When High Pivot Point Doji Reversal System and Bearish Doji Reversal Setup Send, LXSE
Short Entry:
When High Pivot Point and Wick Reversal System and Bearish Wick Reversal Setup Pattern Send SE
OR When High Pivot Point Extreme Reversal System and Bearish Extreme Reversal setup Send SE
OR When High Pivot Point Outside Reversal System and Bearish Outside Reversal Setup Send SE
OR When High Pivot Point Doji Reversal System and Bearish Doji Reversal Setup Send, SE
Short Exit:
Either when SL or Target is hit. If SL/ TGT is not hit and
When Low Pivot Point and Wick Reversal System and Bullish Wick Reversal Setup Pattern Send, SXLE
OR When Low Pivot Point and Extreme Reversal System and Bullish Extreme Reversal setup Send ,SXLE
OR When Low Pivot Point and Outside Reversal System and Bullish Outside Reversal Setup Send SXLE
OR When Low Pivot Point and Doji Reversal System and Bullish Doji Reversal Setup Send, SXLE
Candlestick Reversal System Algo Strategy Parameters for TradingView Charts
1.Length: This is number of bars used to calculated Ex: 14 à previous 14 candles are used
2.Backtesting : Use this to backtest the strategy between Starting and Ending Date and time , it can also be used to set trades in future time
3.Alert_Message : Need to copy while creating alert into Message Box
4.Trade Setup : Intraday / Positional (Selecct accordingly)
5.Start Time Stop Time (Session 1) : Intraday / Positional start time and end time of trade for session 1
6.End Session 1 : Define time to exit any existing position taken in session 1 so that exchange charges will not apply
7.Use Second Session : Check this to use second intraday session
8.Start Time Stop Time (Session 2) : Intraday / Positional start time and end time of trade for session 2
9.End Session 1 : Define time to exit any existing position taken in session 2 so that exchange charges will not apply
10.Use Target : check if you want to set required target if not cheque will not applicable
11.Use StopLoss : Cheque if you want to set stop loss if not cheque will not applicable
12.Trailling Stoploss : Cheque if you want to set trailing stop loss if not cheque will not applicable
13.Point Or Percentage For TG SL : Use Points or Percentage as per your choice
14.Target : Set as per the selection of (Point Or Percentage For TG SL)
15.Stop Loss : Set as per the selection of (Point Or Percentage For TG SL)
16.TSL_Type : Select as per your logic in %/ATR/Points
17.TSL_Input : Set in case you select %/Points in TSL_Type
18.ATR Length : Set as per your logic if you select ATR in the field of TSL_Type
19.ATR_Mult : Set as per your logic if you select ATR in the field of TSL_Type
20.Segment : Select segment of your logic EQ/FUTIDX/FUTSTK/OPTIDX/OPTSTK/FUTCUR/FUTCUM (Used in case of option / Futures )
21.Select Expiry Date : Select the expiry date of your trade as per the segment you selected (Used in case of option / Futures )
22.Select Expiry Month : Select the expiry Month of your trade as per the segment you selected (Used in case of option / Futures )
23.Year : Select the expiry Year of your trade as per the segment you selected (Used in case of option / Futures )
24.Quantity : Enter the quantity in which you want to trade (Used in case of option / Futures )
25.Product Type : Select MIS/Normal/ CNC as per your logic (Used in case of option / Futures )
26.Order Type : Select Market/Limit as per your logic (Used in case of option / Futures )
27.Strategy Tag : Enter the value in case you are using webhook / advance template in APIBridgeTM
28.Lotsize : Enter the lotsize as per your lotic and quentity selection (Used in case of option / Futures )
29.STEP (OTM/ATM/ ITM ) : Select OTM(+1)/ATM(0)/ ITM (-1) as per your logic works in case of options only
30.DIFFERENCE_BETWEEN 2 STRIKE : Select difference of 2 strikes you have used in APIBridge symbol setting list, like for Nifty 50 BankNifty 100
31.APIB Port : Set as per provided to you by Algoji in case of webhook / advance templet
The Segment full form is given below
EQ Equity
FUTIDX Future Index
FUTSTK Future Stock
OPTIDX Index Option
OPTSTK Stock Option
FUTCUR Futcur Currency
FUTCUM Future Commodity
Ultimate Strategy Template (Advanced Edition)Hello traders
This script is an upgraded version of that one below
New features
- Upgraded to Pinescript version 5
- Added the exit SL/TP now in real-time
- Added text fields for the alerts - easier to send the commands to your trading bots
Step 1: Create your connector
Adapt your indicator with only 2 lines of code and then connect it to this strategy template.
For doing so:
1) Find in your indicator where are the conditions printing the long/buy and short/sell signals.
2) Create an additional plot as below
I'm giving an example with a Two moving averages cross.
Please replicate the same methodology for your indicator wether it's a MACD , ZigZag , Pivots , higher-highs, lower-lows or whatever indicator with clear buy and sell conditions.
//@version=5
indicator(title='Moving Average Cross', shorttitle='Moving Average Cross', overlay=true, precision=6, max_labels_count=500, max_lines_count=500)
type_ma1 = input.string(title='MA1 type', defval='SMA', options= )
length_ma1 = input(10, title=' MA1 length')
type_ma2 = input.string(title='MA2 type', defval='SMA', options= )
length_ma2 = input(100, title=' MA2 length')
// MA
f_ma(smoothing, src, length) =>
rma_1 = ta.rma(src, length)
sma_1 = ta.sma(src, length)
ema_1 = ta.ema(src, length)
iff_1 = smoothing == 'EMA' ? ema_1 : src
iff_2 = smoothing == 'SMA' ? sma_1 : iff_1
smoothing == 'RMA' ? rma_1 : iff_2
MA1 = f_ma(type_ma1, close, length_ma1)
MA2 = f_ma(type_ma2, close, length_ma2)
// buy and sell conditions
buy = ta.crossover(MA1, MA2)
sell = ta.crossunder(MA1, MA2)
plot(MA1, color=color.new(color.green, 0), title='Plot MA1', linewidth=3)
plot(MA2, color=color.new(color.red, 0), title='Plot MA2', linewidth=3)
plotshape(buy, title='LONG SIGNAL', style=shape.circle, location=location.belowbar, color=color.new(color.green, 0), size=size.normal)
plotshape(sell, title='SHORT SIGNAL', style=shape.circle, location=location.abovebar, color=color.new(color.red, 0), size=size.normal)
/////////////////////////// SIGNAL FOR STRATEGY /////////////////////////
Signal = buy ? 1 : sell ? -1 : 0
plot(Signal, title='🔌Connector🔌', display = display.data_window)
Basically, I identified my buy, sell conditions in the code and added this at the bottom of my indicator code
Signal = buy ? 1 : sell ? -1 : 0
plot(Signal, title="🔌Connector🔌", transp=100)
Important Notes
🔥 The Strategy Template expects the value to be exactly 1 for the bullish signal, and -1 for the bearish signal
Now you can connect your indicator to the Strategy Template using the method below or that one
Step 2: Connect the connector
1) Add your updated indicator to a TradingView chart
2) Add the Strategy Template as well to the SAME chart
3) Open the Strategy Template settings and in the Data Source field select your 🔌Connector🔌 (which comes from your indicator)
From then, you should start seeing the signals and plenty of other stuff on your chart
🔥 Note that whenever you'll update your indicator values, the strategy statistics and visual on your chart will update in real-time
Settings
- Color Candles: Color the candles based on the trade state ( bullish , bearish , neutral)
- Close positions at market at the end of each session: useful for everything but cryptocurrencies
- Session time ranges: Take the signals from a starting time to an ending time
- Close Direction: Choose to close only the longs, shorts, or both
- Date Filter: Take the signals from a starting date to an ending date
- Set the maximum losing streak length with an input
- Set the maximum winning streak length with an input
- Set the maximum consecutive days with a loss
- Set the maximum drawdown (in % of strategy equity)
- Set the maximum intraday loss in percentage
- Limit the number of trades per day
- Limit the number of trades per week
- Stop-loss: None or Percentage or Trailing Stop Percentage or ATR - I'll add shortly multiple options for the trailing stop loss
- Take-Profit: None or Percentage or ATR - I'll add also a trailing take profit
- Risk-Reward based on ATR multiple for the Stop-Loss and Take-Profit
Special Thanks
Special thanks to @JosKodify as I borrowed a few risk management snippets from his website: kodify.net
Best
Dave

LuxAlgo - Backtester (S&O)The S&O Backtester is an innovative strategy script that encompasses features + optimization methods from our Signals & Overlays™ toolkit and combines them into one easy-to-use script for backtesting the most detailed trading strategies possible.
Our Signals & Overlays™ toolkit is notorious for its signal optimization methods such as the 'Optimal Sensitivity' displayed in its dashboard which provides optimization backtesting of the Sensitivity parameter for the Confirmation & Contrarian Signals.
This strategy script allows even more detailed & precise backtests than anything available previously in the Signals & Overlays™ toolkit; including External Source inputs allowing users to use any indicator including our other paid toolkits for take profit & stop loss customization to develop strategies, along with 10+ pre-built filters directly Signals & Overlays™' features.
🔶 Features
Full Sensitivity optimization within the dashboard to find the Best Win rates or Best Profits.
Counter Trade Mode to reverse signals in undesirable market conditions (may introduce higher drawdowns)
Built-in filters for Confirmation Signals w/ Indicator Overlays from Signals & Overlays™.
Built-in Confirmation exit points are available within the settings & on by default.
External Source Input to filter signals or set custom Take Profits & Stop Losses.
Optimization Matrix dashboard option showing all possible permutations of Sensitivity.
Option to Maximize for Winrate or Best Profit.
🔶 Settings
Sensitivity signal optimizations for the Confirmation Signals algorithm
Buy & Sell conditions filters with Indicator Overlays & External Source
Take Profit exit signals option
External Source for Take Profit & Stop Loss
Sensitivity ranges
Backtest window default at 2,000 bars
External source
Dashboard locations
🔶 Usage
Backtests are not necessarily indicative of future results, although a trader may want to use a strategy script to have a deeper understanding of how their strategy responds to varying market conditions, or to use as a tool for identifying possible flaws in a strategy that could potentially be indicative of good or bad performance in the future.
A strategy script can also be useful in terms of it's ability to generate more complete & configurable alerts, giving users the option to integrate with external processes.
In the chart below we are using default settings and built-in optimization parameters to generate the highest win rate.
Results like the above will vary & finding a strategy with a high win rate does not necessarily mean it will persist into the future, however, some indications of a well-optimized strategy are:
A high number of closed trades (100+) with a consistently green equity curve
An equity curve that outperforms buy & hold
A low % max drawdown compared to the Net Profit %.
Profit factor around 1.5 or above
In the chart below we are using the Trend Catcher feature from Signals & Overlays™ as a filter for standard Confirmation Signals + exits on a higher timeframe.
By filtering bullish signals only when the Trend Catcher is bullish, as well as bearish signals for when the Trend Catcher is bearish, we have a highly profitable strategy created directly from our flagship features.
While the Signals & Overlays features being used as built-in filters can generate interesting backtests, the provided External Sources can allow for even more creativity when creating strategies. This feature allows you to use many indicators from TradingView as filters or to trigger take-profit/stop-loss events, even if they aren't from LuxAlgo.
The chart below shows the HyperWave Oscillator from our Oscillator Matrix™ being used for take-profit exit conditions, exiting a long position on a profit when crossing 80, and exiting a short position when crossing 20.
🔶 Counter Trade Mode
Our thesis has always firmly remained to use Confirmation Signals within Signals & Overlays™ as a supportive tool to find trends & use as extra confirmation within strategies.
We included the counter-trade mode as a logical way to use the Confirmation signals as direct entries for longs & shorts within more contrarian trading strategies. Many traders can relate to using a trend-following indicator and having the market not respect its conditions for entries.
This mode directly benefits a trader who is aware that market conditions are generally not-so-perfect trends all the time. Acknowledging this, allows the user to use this to their advantage by introducing countertrend following conditions as direct entries, which tend to perform very well in ranging markets.
The big downfall of using counter-trade mode is the potential for very large max-drawdowns during trending market conditions. We suggest for making a strategy to consider introducing stop-loss conditions that can efficiently minimize max-drawdowns during the process of backtesting your creations.
Sensitivity Optimization
Within the Signals & Overlays™ toolkit, we allow users to adjust the Confirmation Signals with a Sensitivity parameter.
We believe the Sensitivity paramter is the most realistic way to generate the most actionable Confirmation Signals that can navigate various market conditions, and the Confirmation Signals algorithm was designed specifically with this in mind.
This script takes this parameter and backtests it internally to generate the most profitable value to display on the dashboard located in the top right of the chart, as well as an optimization table if users enable it to visualize it's backtesting.
In the image below, we can see the optimization table showing permutations of settings within the user-selected Sensitivity range.
The suggested best setting is given at the current time for the backtesting window that's customizable within the indicator. Optimized settings for technical indicators are not indicative of future results and the best settings are highly likely / guaranteed to change over time.
Optimizing signal settings has become a popular activity amongst technical analysts, however, the real-time beneficial applications of optimizing settings are limited & best described as complicated (even with forward testing).
🔶 Strategy Properties (Important)
We strongly recommend all users to ensure they adjust the Properties within the script settings to be in line with their accounts & trading platforms of choice to ensure results from strategies built are realistic.
🔶 How to access
You can see the Author's Instructions below to learn how to get access on our website.

iMoku (Ichimoku Complete Tool) - The Quant Science iMoku™ is a professional all-in-one solution for the famous Ichimoku Kinko Hyo indicator.
The algorithm includes:
1. Backtesting spot
2. Visual tool
3. Auto-trading functions
With iMoku you can test four different strategies.
Strategy 1: Cross Tenkan Sen - Kijun Sen
A long position is opened with 100% of the invested capital ($1000) when "Tenkan Sen" crossover "Kijun Sen".
Closing the long position on the opposite condition.
There are 3 different strength signals for this strategy: weak, normal, strong.
Weak : the signal is weak when the condition is true and the price is above the 'Kumo'
Normal : the signal is normal when the condition is true and the price is within the 'Kumo'
Strong : the signal is strong when the condition is true and the price is below the 'Kumo'
Strategy 2: Cross Price - Kijun Sen
A long position is opened with 100% of the invested capital ($1000) when the price crossover the 'Kijun Sen'.
Closing the long position on the opposite condition.
There are 3 different strength signals for this strategy: weak, normal, strong.
Weak : the signal is weak when the condition is true and the price is above the 'Kumo'
Normal : the signal is normal when the condition is true and the price is inside the 'Kumo'
Strong : the signal is strong when the condition is true and the price is below the 'Kumo'
Strategy 3: Kumo Breakout
A long position is opened with 100% of the invested capital ($1000) when the price breakup the 'Kumo'.
Closing the long position with a percentage stop loss and take profit on the invested capital.
Strategy 4: Kumo Twist
A long position is opened with 100% of the invested capital ($1000) when the 'Kumo' goes from negative to positive (called "Twist").
Closing the long position on the opposite condition.
There are 2 different strength signals for this strategy: weak, and strong.
Weak : the signal is weak when the condition is true and the price is above the 'Kumo'
Strong : the signal is strong when the condition is true and the price is below the 'Kumo'
This script is compliant with algorithmic trading.
You can use this script with trading terminals such as 3Commas or CryptoHopper. Connecting this script is very easy.
1. Enter the user interface
2. Select and activate a strategy
3. Copy your bot's links into the dedicated fields
4. Create and activate alert
Disclaimer: algorithmic trading involves risk, the user should consider aspects such as slippage, liquidity and costs when evaluating an asset. The Quant Science is not responsible for any kind of damage resulting from use of this script. By using this script you take all the responsibilities and risks.

Miyagi BacktesterMiyagi: The attempt at mastering something for the best results.
Miyagi indicators combine multiple trigger conditions and place them in one toolbox for traders to easily use, produce alerts, backtest, reduce risk and increase profitability.
The Miyagi Backtester is a standalone backtester which is to be applied to the chart after the Miyagi indicator to be backtested.
The backtester can only backtest one script at a time, and is meant to backtest ONCE PER BAR CLOSE entries.
It is currently not possible to backtest ONCE PER BAR entries.
The backtester will allow users to all Miyagi Indicators using DCA strategies to show returns over a selectable time period.
The backtester allows leverage, and as such users should be aware of the Maximum Amount for Bot Usage and Leverage Required Calculations.
The DCA Selector switch will allow users to backtest with, or without DCA.
Static DCA is used within the backtester and allows users to see DCA Statistics on closed trades.
How to use the Miyagi Backtester
Step 1: Apply the Miyagi Indicator of Choice to backtest (4in1/10in1/Strend).
DATE AND TIME RANGE:
-Date and time range to backtest.
TRADE:
-Entry source to backtest. Please select the "Outbound Entry Signal Sender"
-Trade Direction to backtest. This can be helpful to backtest according to your strategy (long or short).
-Take Profit % to backtest. This is the percent take profit to backtest. Slippage can be accounted for on the "Properties" tab.
-Stoploss % to backtest. This is the percent stoploss to backtest.
DCA:
DCA Checkbox: Enable the DCA Checkbox to backtest with DCA. Disable it to backtest without DCA.
Leverage: Input the Leverage you will trade with.
Base Order Size (% Equity): This is the Base order (BO) size to backtest in % of equity.
Safety Order Size (% Equity): This is the Safety order (SO) size to backtest in % of equity.
Number of DCA Orders: This is the maximum amount of DCA orders to place, or total DCA orders.
Price Deviation (% from initial order): This is the percent at which the first safety is placed.
Safety Order Step Scale: This is the scale at which is applied to the deviation for the step calculation to determine next SO placement.
Safety Order Volume Scale: This is the scale at which is applied to the safety orders for the volume calculation to determine SO Volume.
Real world DCA Example:
The process is as follows.
Base Order: This is your initial order size, $100 used for Base Order
Safety Order: This is your first safety order size, which is placed at the deviation. $100 Safety Order, it is good to keep the same size as your BO for your scaling to be effective.
Price deviation: This is the deviation at which your first Safety order is placed. 0.3-0.75% used by most of our members.
Safety Order Volume Scale: This is the scale at which is applied to the safety orders for the volume calculation. Scale of 2 used, which means that SO2 = (SO1) * 2, or $200. This scaling is typical for all following orders and as such SO3 = (SO2) *2, or $400.
Safety Order Step Scale: This is the scale at which is applied to the deviation for the step calculation. This is similar to the volume scale however the last order percentage is added.
Scale of 2 used, which means that SO2 % = ((Deviation) * 2) + (SO1%). (0.5% *2) + (0.5) = 1.5%.
This scaling is typical for all following orders except that the prior deviation is used and as such SO3 = ((Prior%) * 2) + (Deviation). (1.5% * 2) +(0.5%) or 3.5%.
Total SO Number: The calculations will continue going until the last SO. It is helpful to understand the amount of SO’s and scaling determines how efficient your DCA is.
Backtester Outputs include:
Net Profit to display net profit
Daily Net Profit to estimate
Percent Profitable which shows ratio of winning trades to losing trades.
Total Trades
Winning Trades
Losing Trades (only applicable if stoploss is used)
Buy & Hold Return (of the backtested asset) to compare if the strategy used beats buy & hold return.
Avg Trade Time is very helpful to see average trade time.
Max Trade Time is very helpful to see the maximum trade time.
Total Backtested Time will return total backtested time.
Initial Capital which is taken from the Properties tab.
Max amount for Bot Usage which can be helpful to see bot usage.
Leverage Required will show you the leverage required to sustain the DCA configuration.
Total SO Deviation will allow users to see the drop coverage their DCA provides.
Max Spent which is a % of total account spent on one trade.
Max Drawdown which displays the maximum drawdown of any trade.
Max % distance from entry shows the maximum distance price went away from entry prior to the trade closing.
Max SO Used which shows the maximum number of SO's used on a single trade
Avg SO Used which shows the average number of SO's used in all closed trades.
Deals closing with BO Only calculation will show how many trades are closed without DCA.
Deals closing with 1-7 SOs calculation will show how many trades are closed with DCA, and allow for fine-tuning.
Happy Trading!
This script will be effective to backtest and produce the best settings for each timeframe and pair across all STP Scripts.
This will take a lot of the manual work out of backtesting for our users while improving profit potential.
Happy Trading!

Multi Trend Cross Strategy TemplateToday I am sharing with the community trend cross strategy template that incorporates any combination of over 20 built in indicators. Some of these indicators are in the Pine library, and some have been custom coded and contributed over time by the beloved Pine Coder community. Identifying a trend cross is a common trend following strategy and a common custom-code request from the community. Using this template, users can now select from over 400 different potential trend combinations and setup alerts without any custom coding required. This Multi-Trend cross template has a very inclusive library of trend calculations/indicators built-in, and will plot any of the 20+ indicators/trends that you can select in the settings.
How it works : Simple trend cross strategies go long when the fast trend crosses over the slow trend, and/or go short when the fast trend crosses under the slow trend. Options for either trend direction are built-in to this strategy template. The script is also coded in a way that allows you to enable/modify pyramid settings and scale into a position over time after a trend has crossed.
Use cases : These types of strategies can reduce the volatility of returns and can help avoid large market downswings. For instance, those running a longer term trend-cross strategy may have not realized half the down swing of the bear markets or crashes in 02', 08', 20', etc. However, in other years, they may have exited the market from time to time at unfavorable points that didn't end up being a down turn, or at times the market was ranging sideways. Some also use them to reduce volatility and then add leverage to attempt to beat buy/hold of the underlying asset within an acceptable drawdown threshold.
Special thanks to @Duyck, @everget, @KivancOzbilgic and @LazyBear for coding and contributing earlier versions of some of these custom indicators in Pine.
This script incorporates all of the following indicators. Each of them can be selected and modified from within the indicator settings:
ALMA - Arnaud Legoux Moving Average
DEMA - Double Exponential Moving Average
DSMA - Deviation Scaled Moving Average - Contributed by Everget
EMA - Exponential Moving Average
HMA - Hull Moving Average
JMA - Jurik Moving Average - Contributed by Everget
KAMA - Kaufman's Adaptive Moving Average - Contributed by Everget
LSMA - Linear Regression , Least Squares Moving Average
RMA - Relative Moving Average
SMA - Simple Moving Average
SMMA - Smoothed Moving Average
Price Source - Plotted based on source selection
TEMA - Triple Exponential Moving Average
TMA - Triangular Moving Average
VAMA - Volume Adjusted Moving Average - Contributed by Duyck
VIDYA - Variable Index Dynamic Average - Contributed by KivancOzbilgic
VMA - Variable Moving Average - Contributed by LazyBear
VWMA - Volume Weighted Moving Average
WMA - Weighted Moving Average
WWMA - Welles Wilder's Moving Average
ZLEMA - Zero Lag Exponential Moving Average - Contributed by KivancOzbilgic
Disclaimer : This is not financial advice. Open-source scripts I publish in the community are largely meant to spark ideas that can be used as building blocks for part of a more robust trade management strategy. If you would like to implement a version of any script, I would recommend making significant additions/modifications to the strategy & risk management functions. If you don’t know how to program in Pine, then hire a Pine-coder. We can help!

Adulari ATSAdulari's Automated Trading Strategy combines more then 10+ innovative indicators and is carefully designed to provide honest and accurate backtesting results. We created and optimized this strategy to provide realistic results, not insane backtesting results that are very inconsistent and unrealistic. It is made for swing trading on the 15m timeframe. It is recommended to use the BYBIT:BTCUSDT pair.
This strategy has been thoroughly backtested throughout 2 years in order to provide optimal results.
ATS was designed to provide live results close to those of backtesting. It has been ensured this strategy is not overfitted.
Our strategy works in any market & allows users to:
Automate their trades using our alert system and integrations.
View realistic backtesting results.
Filter trades in irregular price action using our trend filters.
And many new features that can be found in the changelog below.
Our strategy detect the direction of trends for any asset & on any timeframe allowing traders to increase their confidence in positions and follow trends.
This strategy is built to be very profitable when used for long time periods. Compounding will make profits very solid.
We give our users the possibility to adjust the settings of the strategy to market price variations, as well as the option to make them less sensitive to irregular price movements so that it only trades predictable price action.
Save time by automating everything!
The strategy's settings play an important role towards profitable trades, however, the constant adjustment of these is not necessary since no overfitting is in play.
We made our strategy as flexible as possible in order to allow it to adjust to internal market dynamics, thus completely removing the need for traders to adjust any settings. We offer multiple setting profiles that are optimized for a certain market, with lower or higher risk.
If you are using this script you acknowledge past performance is not necessarily indicative of future results and there are many more factors that go into a profitable trade.

CONSOLIDATION BAND BREAKOUT [5MIN TF]CONSOLIDTION BREAKOUT STRATEGY for 5 minute Time-Frame , that has the time condition adjustable for Indian Markets.
// ══════════════════════════════════════════════════════════════════════════ //
Unlike the Free Scripts - Risk Management , Position Sizing , Partial Exit etc. are also included .
Message to know more about the strategy.
// ══════════════════════════════════════════════════════════════════════════ //
The Timing can be changed to fit other markets, scroll down to "TIME CONDITION" to know more.
The commission is also included in the strategy .
The basic idea is when ,
1) Price crosses above upper Level ,indicated by Red Line, is a Long condition .
2) Price crosses below lower Level ,indicated by Green Line , is a Short condition .
3) Candle close crosses above ema1 , is a part of the Long condition .
4) Candle close crosses below ema1 , is a part of the Short condition .
5) Allowed hours specifies the trade entry timing.
6) ATR STOP is the stop-loss value on chart , can be adjusted in INPUTS.
7) Target 1 is the 1st target value on chart , can be adjusted in INPUTS.
8) RISK is Maximum Risk per trade for the intraday trade can be changed .
9) Total Capital used can be adjusted under INPUTS.
10) ATR TRAIL is used for trailing after entry, as mentioned in the inputs below.
11) Check trades under the list of trades .
12) Trade only in liquid stocks .
13) Risk only 1-5% of total capital.
14) Inputs can be changed for better back-test results, but also manually check the trades before setting alerts
15) SQUARE OFF TIME - As you change the time frame , also change the square-off time to that candle's closing time.
Eg: For 3min Time-frame , Hour = 2Hrs | Minute = 57min
16) Strategy stops for the day if you have a loss .
*The input values and the results are mentioned under "BACKTEST RESULTS" below*
// ══════════════════════════════ //
// ————————> RISK MANAGEMENT <——————— //
// ══════════════════════════════ //
Risk management is done based on max loss per trade and can be adjusted in the INPUTS.
// ═══════════════════════════ //
// ————————> POSITION SIZE <——————— //
// ═══════════════════════════ //
Quantity of each trade is different based on the loss
// ═════════════════════════ //
// ————————> PROPERTIES <——————— //
// ═════════════════════════ //
COMMISSION , SLIPPAGE ,RECALCULATE is already mentioned .
COMMISSION can be charges , based on the broker charges.
// ═══════════════════════════════//
// ————————> TIME CONDITION <————————— //
// ═══════════════════════════════//
The time can be changed in the INPUT.
The Indian Markets open at 9:15am and closes at 3:30pm.
The 'Allowed hours' under Inputs specifies the time at which Entries should happen .
"Close All" function closes all the trades before 3pm , at the open of the next candle.
To change the time to close all trades , check INPUT.
All open trades get closed at 3pm , because some brokers don't allow you to place fresh intraday orders after 3pm .
// ═══════════════════════════════════════════════ //
// ————————> BACKTEST RESULTS ( 123 CLOSED TRADES )<————————— //
// ═══════════════════════════════════════════════ //
INPUTS can be changed for better Back-Test results.
The strategy applied to NSE:TCS (5 min Time-Frame and with a capital of 1,00,000 ) gives us 77% profitability , as shown below
It was tested for a period a 1 year with a Profit Factor of 2.143 ,net Profit of 10,886 Rs .
The Initial Capital and Risk can be increased for better results.
The graph has a Linear Curve with Consistent Profits.
The INPUTS are as follows,
1) LENGTH ——————————————> 79
2) MUT_STDEV ————————————> 2.3
3) ALLOWED HRS ———————————> 9:25 TO 14:30
4) ATR STOP ——————————————> 2.2
5) RISK ——————————————————> 400
6) ATR TRAIL ———————————————> 2.6
7) TARGET 1 ————————————————> 2.1
8) MAX POSITION VALUE ——————————> 1,00,000
8) MAX DRAWDOWN —————————————> 2,000
8) SQUARE-OFF ————————————————> 14:55
NSE:TCS
Apply it to your charts Now !!
Send us a message to know more about this strategy
Thank You ☺ NSE:TCS

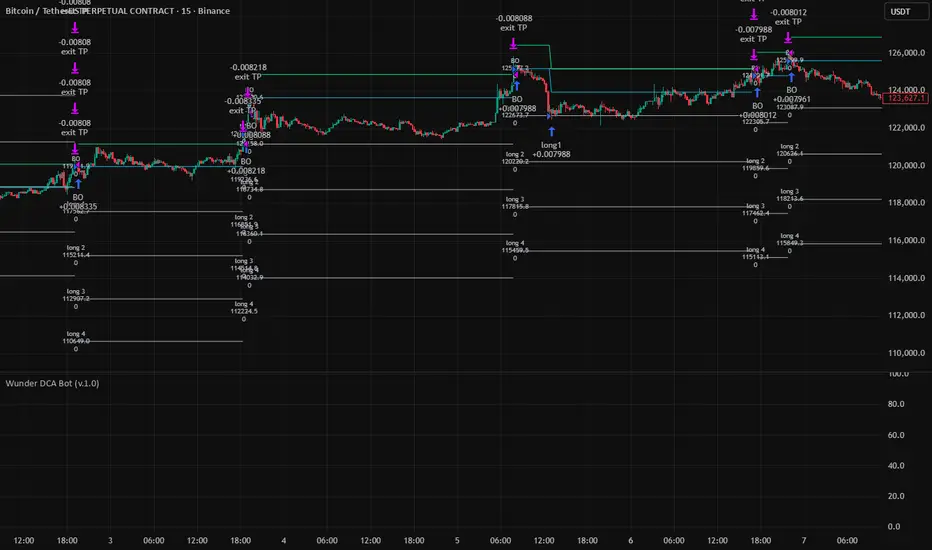
Wunder DCA BotThe bot is based on the DCA system.
1. DCA is the investment method in which you buy a certain portion of the asset after the determined price deviation.
2. For entry, we evaluate the maximum and minimum levels for a given period that you can adjust in the script. The bot enters when price rebound from the specified levels.
3. For the exit, the bot will use the take profit percentage that you will specify in settings.
It is also possible to choose how the take profit is calculated either from the average entry price or from the entry order (first order).
4. DCA uses the following settings:
- Base order Volume: Volume of your first order on entry signal
- Subsequent orders volume: The volume of all subsequent orders except the first
- DCA orders count: This parameter will determine how many entries your overall strategy will have. For example: If you will put 3, that will mean that including your initial position you will have 2 additional orders.
- DCA order price deviation:
This is the value in % which determines the deviation of the additional entries from the entry price. Example: If you go long and the price of the asset is 100$ and you put an order price deviation of 1% that will mean that the first additional entry will occur when the price will drop by 1%, and the second entry will be triggered when the overall price will drop by 2% (as the interval between the first and the second additional entry will be 1%).
- DCA Order Volume Multiplier:
This parameter will determine the amount that you put into each additional position. If this parameter is equal to 1 that means that each additional entry will be equal to the initial amount. The extra volume will be added to your position from the second DCA entry. Example: Your initial position was 10$ and your Volume Multiplier is set to 2. When you reach your 1st DCA target your additional order will have the same volume of 10$. When you reach your 2nd DCA target your additional order will be 20$ (previous position volume * multiplier). Your 3rd DCA target will place the order of 40$.
- DCA order price Deviation Multiplier:
This value will increase the price deviation between each additional entry. It is calculated as the price deviation multiplied by the deviation multiplier. For example: if you enter long at the price 100$ and have a price deviation of 1% with the price deviation multiplier of 2 that will mean that the first additional entry will occur when the price will drop to 99$ however the second will occur when the price will go to 97$. The third additional position will be entered at 94$
5. For full automation of the bot, you should set your comments to the input in the bot settings in the "LONG" and "SHORT" fields. You also need to create an alert signal and set a Webhook to send signals.
IMPORTANT!!!
1. Position calculation should take into account several factors: your deposit, leverage, the number of DCA orders, the distance to the last DCA order;
2. When choosing leverage, it is important to correctly calculate the possible drawdown. If you set a high leverage value, then liquidation awaits and the bot will not be able to take profits and will exit the position ahead of time;
3. The size of the position must be determined in accordance with all risks and take into account the size of your deposit;
4. This DCA Bot is able to earn consistently with the correct calculated money management.
Strategy Myth-Busting #10 - InsideBar+EMA - [MYN]This is part of a new series we are calling "Strategy Myth-Busting" where we take open public manual trading strategies and automate them. The goal is to not only validate the authenticity of the claims but to provide an automated version for traders who wish to trade autonomously.
Our 10th one we are automating is the " 75% Win Rate High Profit Inside Bar Trading Strategy - What If You ... " strategy from " Trade Pro " who claims to have backtested this manually and achieved 11,063% profit with a 75% winrate over 100 trades. I was unable to emulate these results consistently accommodating for slippage and commission but even so, the results look promising. I was only able to achieve this win-rate with some multiple take profit staggering. Even so the markdown is above where I would normally consider comfortable (>20%).
If you know of or have a strategy you want to see myth-busted or just have an idea for one, please feel free to message me.
This strategy uses a combination of 2 open-source public indicators:
Inside Bar Ind/Alert by CMA
EMA (built-in)
Trading Rules
4 hour candles
Stop Loss at EMA Line with TP Target 1.5x the risk
Long Entry when these conditions are true
inside bar and bullish
Bar close's above 50 ema
Price action rises above high of inside bar .
Short Entry when these conditions are true
inside bar and bearish
Bar close below 50 ema
Price action falls below low of inside bar

Strategy Myth-Busting #8 - TrendSurfers+TrendOsc - [MYN]This is part of a new series we are calling "Strategy Myth-Busting" where we take open public manual trading strategies and automate them. The goal is to not only validate the authenticity of the claims but to provide an automated version for traders who wish to trade autonomously.
Our 8th one is an automated version of the " 653% Gain Magical 1 Minute Scalping Strategy Tested 100 Times | Become Consistently Huge Profit " strategy from " Fxaccurate US " who claims to have achieved 653% profit scalping GOLD on the 5 minute timeframe. As you can see from the backtest results below, I was unable to substantiate anything close to that that claim on any timeframe or symbol. Myth 10000% busted.
If you know of or have a strategy you want to see myth-busted or just have an idea for one, please feel free to message me.
This strategy uses a combination of 2 open-source public indicators:
Trend Surfers - Premium Breakout + Alerts by TrendSurfersSignals
Mawreez' Trend Oscillator Indicator by Mawreez
Trading Rules:
1 min - 15 min candles
Stop loss middle between high and low Risk 1:2
Long Condition
Trend Surfers Trailing stop line goes below (Crosses) lowest low
Bullish Candle (red)
Mawreeze Trend Oscilator Indicator is green
Short Condition
Trend Surfers Trailing stop line goes above (Crosses) highest high
Bearish Candle (red)
Mawreeze Trend Oscilator Indicator is red
