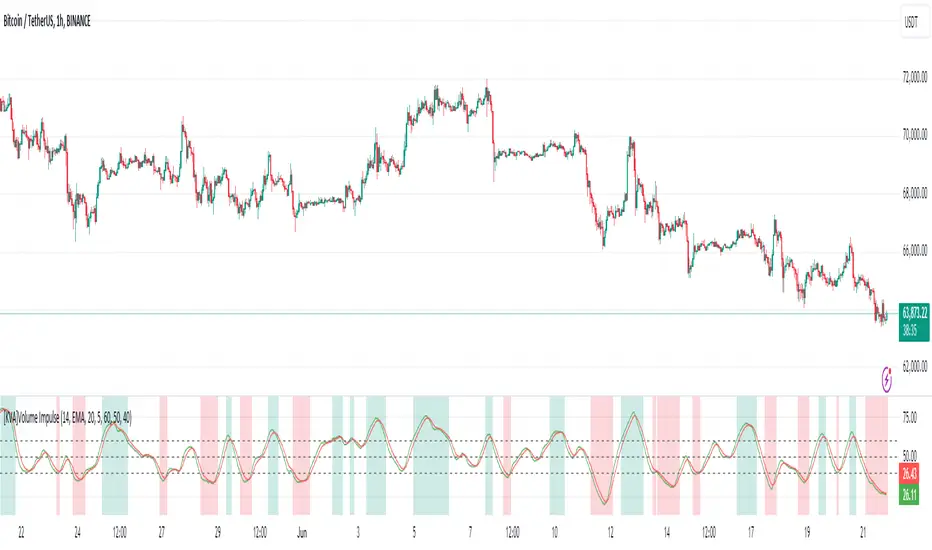
[KVA]Volume ImpulseThe Volume Impulse indicator is designed to provide insights into market momentum by analyzing volume dynamics. It helps traders identify periods of strong buying and selling pressure, which can be crucial for making informed trading decisions.
What does the indicator do?
The Volume Impulse indicator calculates positive and negative volume percentages based on the price range within each bar. It allows traders to visualize the distribution of volume and detect potential shifts in market sentiment.
How does it work?
The indicator uses a customizable lookback period to analyze volume data, smoothing the results with user-defined moving averages. By comparing the positive and negative volume percentages, the indicator highlights overbought and oversold conditions, aiding in trend detection and potential reversal points.
How to use it?
Identify Momentum: Use the positive and negative volume percentages to gauge market momentum within the specified lookback period.
Detect Overbought/Oversold Conditions: Look for the indicator crossing above the overbought level or below the oversold level to identify potential reversal points.
Smooth Trends: Adjust the moving average type and lengths to smooth out the volume data and identify trends more clearly.
Key Features
Volume Analysis: Calculates the positive and negative volume based on the price range within each bar.
Lookback Period: Allows you to define a lookback period over which the indicator calculations are performed, providing flexibility in analyzing different timeframes.
Customizable Moving Averages: Choose from various types of moving averages (EMA, SMA, WMA, Hull) to smooth the volume data.
Overbought/Oversold Levels: Visual markers for overbought, middle, and oversold conditions to help identify potential reversal points.
Color-Coded Areas: Highlights overbought and oversold regions with customizable colors for easy visual interpretation.
Plotting Options: Displays the positive volume and its smoothed version using the selected moving average type and length.
Inputs:
Lookback Period: Define the period over which the volume analysis is performed.
Moving Average Type: Select the type of moving average (EMA, SMA, WMA, Hull) to be applied.
Moving Average Length: Set the length for the primary moving average.
Smooth Length: Define the length for the smoothed moving average.
Overbought Level: Set the threshold for overbought conditions.
Middle Level: Set the threshold for middle conditions.
Oversold Level: Set the threshold for oversold conditions.
Color Settings: Customize the colors for overbought and oversold areas and their respective fill colors.
חפש סקריפטים עבור "averages"
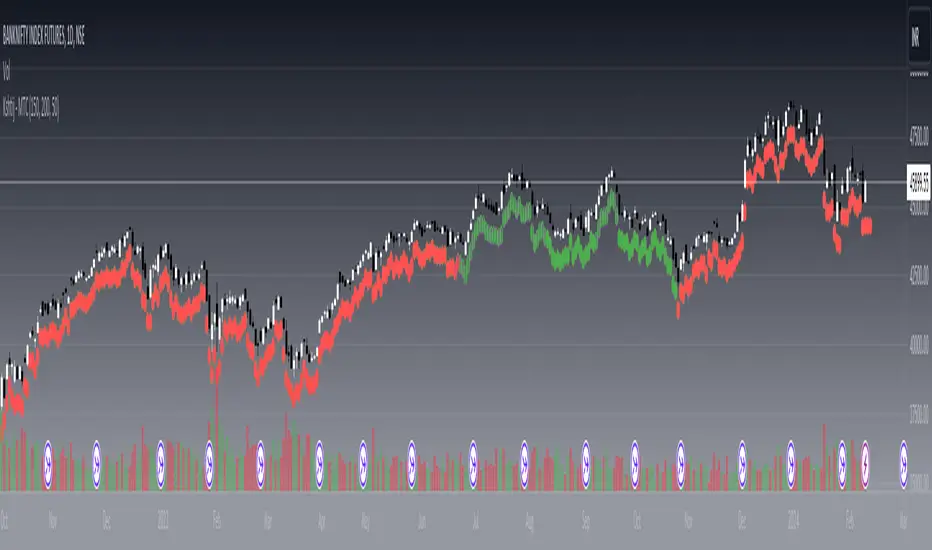
Kshitij Malve - Minervini Trend Criteria (MTC)Purpose:
This indicator is designed to assist traders in identifying stocks that potentially meet the bullish Stage 2 trend criteria outlined by renowned stock trader Mark Minervini. It analyzes price movement in relation to moving averages and calculates certain price thresholds to provide visual signals.
Key Features:
Minervini Stage 2 Focus: Specifically targets trend characteristics highlighted in Minervini's trading methodology.
Adjustable Moving Averages: The script includes inputs for 150-day, 200-day, and 50-day moving average lengths, allowing users to customize their analysis.
Visual Trend Criteria: Each core Stage 2 trend condition is plotted below the chart as green or red dots for quick visual assessment.
Stage 2 Uptrend Signal: When all key trend conditions are met, a purple up-arrow appears beneath the price chart.
Alerts: Customizable alerts can be set up to notify the user when all conditions are met, signaling a potential Stage 2 uptrend.
Conditions Evaluated:
Price Position: Current price is above the 50-day, 150-day, and 200-day simple moving averages.
Moving Average Alignment: 50-day MA is above the 150-day MA, which is above the 200-day MA.
Uptrending 200-day MA: The 200-day MA is demonstrating an upward trend over the specified period.
30% Above 52-Week Low: Current price is at least 30% higher than the 52-week low.
Within 25% of 52-Week High: Current price is no more than 25% below the 52-week high.
Important Notes:
This indicator does not directly plot lines for conditions 4 and 5 (52-week high/low comparisons). Consider incorporating these into your chart in some way for full technical analysis in line with the Minervini method.
For additional depth, study Mark Minervini's books to fully understand the context and strategies built around these criteria.
How to Use:
Add the "Kshitij Malve - Minervini Trend Criteria" indicator to a stock chart.
Observe the placement of colored dots below the chart. A series of green dots suggests the stock is within Minervini's Stage 2 criteria.
Look for the purple up-arrow signal for confirmation that all conditions are met.
Customize alerts if you would like real-time signals of potential Stage 2 uptrends.
FlexiMA Variance Tracker - Strategy [presentTrading]█ Introduction and How It Is Different
The FlexiMA Variance Tracker by PresentTrading introduces a novel approach to technical trading strategies. Unlike traditional methods, it calculates deviations between a chosen indicator source (such as price or average) and a moving average with a variable length. This flexibility is achieved through a unique combination of a starting factor and an increment factor, allowing the moving average to adapt dynamically within a specified range. This strategy provides a more responsive and nuanced view of market trends, setting it apart from standard trading methodologies.
BTC 8h L/S
Local
█ Strategy, How It Works: Detailed Explanation
The FlexiMA Variance Tracker, developed by PresentTrading, stands at the forefront of trading strategies, distinguished by its adaptive and multifaceted approach to market analysis. This strategy intricately weaves various technical elements to construct a comprehensive trading logic. Here's an in-depth professional breakdown:
🔶Foundation on Variable-Length Moving Averages:
Central to this strategy is the concept of variable-length Moving Averages (MAs). Unlike traditional MAs with a fixed period, this strategy dynamically adjusts the length of the MA based on a starting factor and an incremental factor. This approach allows the strategy to adapt to market volatility and trend strength more effectively.
Each MA iteration offers a distinct temporal perspective, capturing short-term price movements to long-term trends. This aggregation of various time frames provides a richer and more nuanced market analysis, essential for making informed trading decisions.
🔶Deviation Analysis and Normalization:
The strategy calculates deviations of the price (or the chosen indicator source) from each of these MAs. These deviations are pivotal in identifying the immediate market direction relative to the average trend captured by each MA.
To standardize these deviations for comparability, they undergo a normalization process. The choice of normalization method (Max-Min or Absolute Sum) can significantly influence the interpretation of market conditions, offering distinct insights into price movements and trend strength.
🔹Normalization: Absolute Sum
🔶Composite Oscillator Construction:
A composite oscillator is derived from the median of these normalized deviations. The median serves as a balanced and robust central trend indicator, minimizing the impact of outliers and market noise.
Additionally, the standard deviation of these deviations is computed, providing a measure of market volatility. This volatility indicator is crucial for assessing market risk and can guide traders in setting appropriate stop-loss and take-profit levels.
🔶Integration with SuperTrend Indicator:
The FlexiMA strategy integrates the SuperTrend indicator, renowned for its effectiveness in identifying trend direction and reversals. The SuperTrend's incorporation enhances the strategy's ability to filter out false signals and confirm genuine market trends.
* The SuperTrend Toolkit is made by @QuantiLuxe
This combination of the variable-length MA oscillator with the SuperTrend indicator forms a potent duo, offering traders a dual-confirmation mechanism for trade signals.
🔹Supertrend's incorporation
🔶Strategic Trade Signal Generation:
Trade signals are generated when there is a confluence between the composite oscillator and the SuperTrend indicator. For example, a long position signal might be considered when the oscillator suggests an uptrend, and the SuperTrend flips to bullish.
The strategy's parameters are fully customizable, enabling traders to tailor the signal generation process to their specific trading style, risk tolerance, and market conditions.
█ Usage
To effectively employ the FlexiMA Variance Tracker strategy:
Traders should set their desired trade direction and fine-tune the starting and increment factors according to their market analysis and risk tolerance.
Indicator Length: 5
Indicator Length: 40
The strategy is suitable for a wide range of markets and can be adapted to different time frames, making it a versatile tool for various trading scenarios.
█ Default Settings Impact on Performance: FlexiMA Variance Tracker
1. Trade Direction (Configurable: Long, Short, Both): Determines trade types. 'Long' for buying, 'Short' for selling, 'Both' adapts to market trends.
2. Indicator Source: HLC3: Balances market sentiment by considering high, low, and close, providing comprehensive period analysis.
4. Indicator Length (Default: 10): Baseline for moving averages. Shorter lengths increase responsiveness but add noise, while longer lengths favor trends.
5. Starting and Increment Factor (Default: 1.0): Adjusts MA lengths range. Higher values capture broad market dynamics, lower values focus analysis.
6. Normalization Method (Options: None, Max-Min, Absolute Sum): Standardizes deviations. 'None' for raw deviations, 'Max-Min' for relative scaling, 'Absolute Sum' emphasizes relative strength.
7. SuperTrend Settings (ATR Length: 10, Multiplier: 15.0): Influences indicator sensitivity. Short ATR or high multiplier for short-term, long ATR or low multiplier for long-term trends.
8. Additional Settings (Mesh Style, Color Customization): Enhances visual clarity. Mesh style for detailed deviation view, colors for quick market condition identification.

Machine Learning Momentum Index (MLMI) [Zeiierman]█ Overview
The Machine Learning Momentum Index (MLMI) represents the next step in oscillator trading. By blending traditional momentum analysis with machine learning, MLMI delivers a potent and dynamic tool that aligns with the complexities of modern financial landscapes. Offering traders an adaptive way to understand and act on market momentum and trends, this oscillator provides real-time insights into market momentum and prevailing trends.
█ How It Works:
Momentum Analysis: MLMI employs a dual-layer analysis, utilizing quick and slow weighted moving averages (WMA) of the Relative Strength Index (RSI) to gauge the market's momentum and direction.
Machine Learning Integration: Through the k-Nearest Neighbors (k-NN) algorithm, MLMI intelligently examines historical data to make more accurate momentum predictions, adapting to the intricate patterns of the market.
MLMI's precise calculation involves:
Weighted Moving Averages: Calculations of quick (5-period) and slow (20-period) WMAs of the RSI to track short-term and long-term momentum.
k-Nearest Neighbors Algorithm: Distances between current parameters and previous data are measured, and the nearest neighbors are used for predictive modeling.
Trend Analysis: Recognition of prevailing trends through the relationship between quick and slow-moving averages.
█ How to use
The Machine Learning Momentum Index (MLMI) can be utilized in much the same way as traditional trend and momentum oscillators, providing key insights into market direction and strength. What sets MLMI apart is its integration of artificial intelligence, allowing it to adapt dynamically to market changes and offer a more nuanced and responsive analysis.
Identifying Trend Direction and Strength: The MLMI serves as a tool to recognize market trends, signaling whether the momentum is upward or downward. It also provides insights into the intensity of the momentum, helping traders understand both the direction and strength of prevailing market trends.
Identifying Consolidation Areas: When the MLMI Prediction line and the WMA of the MLMI Prediction line become flat/oscillate around the mid-level, it's a strong sign that the market is in a consolidation phase. This insight from the MLMI allows traders to recognize periods of market indecision.
Recognizing Overbought or Oversold Conditions: By identifying levels where the market may be overbought or oversold, MLMI offers insights into potential price corrections or reversals.
█ Settings
Prediction Data (k)
This parameter controls the number of neighbors to consider while making a prediction using the k-Nearest Neighbors (k-NN) algorithm. By modifying the value of k, you can change how sensitive the prediction is to local fluctuations in the data.
A smaller value of k will make the prediction more sensitive to local variations and can lead to a more erratic prediction line.
A larger value of k will consider more neighbors, thus making the prediction more stable but potentially less responsive to sudden changes.
Trend length
This parameter controls the length of the trend used in computing the momentum. This length refers to the number of periods over which the momentum is calculated, affecting how quickly the indicator reacts to changes in the underlying price movements.
A shorter trend length (smaller momentumWindow) will make the indicator more responsive to short-term price changes, potentially generating more signals but at the risk of more false alarms.
A longer trend length (larger momentumWindow) will make the indicator smoother and less responsive to short-term noise, but it may lag in reacting to significant price changes.
Please note that the Machine Learning Momentum Index (MLMI) might not be effective on higher timeframes, such as daily or above. This limitation arises because there may not be enough data at these timeframes to provide accurate momentum and trend analysis. To overcome this challenge and make the most of what MLMI has to offer, it's recommended to use the indicator on lower timeframes.
-----------------
Disclaimer
The information contained in my Scripts/Indicators/Ideas/Algos/Systems does not constitute financial advice or a solicitation to buy or sell any securities of any type. I will not accept liability for any loss or damage, including without limitation any loss of profit, which may arise directly or indirectly from the use of or reliance on such information.
All investments involve risk, and the past performance of a security, industry, sector, market, financial product, trading strategy, backtest, or individual's trading does not guarantee future results or returns. Investors are fully responsible for any investment decisions they make. Such decisions should be based solely on an evaluation of their financial circumstances, investment objectives, risk tolerance, and liquidity needs.
My Scripts/Indicators/Ideas/Algos/Systems are only for educational purposes!

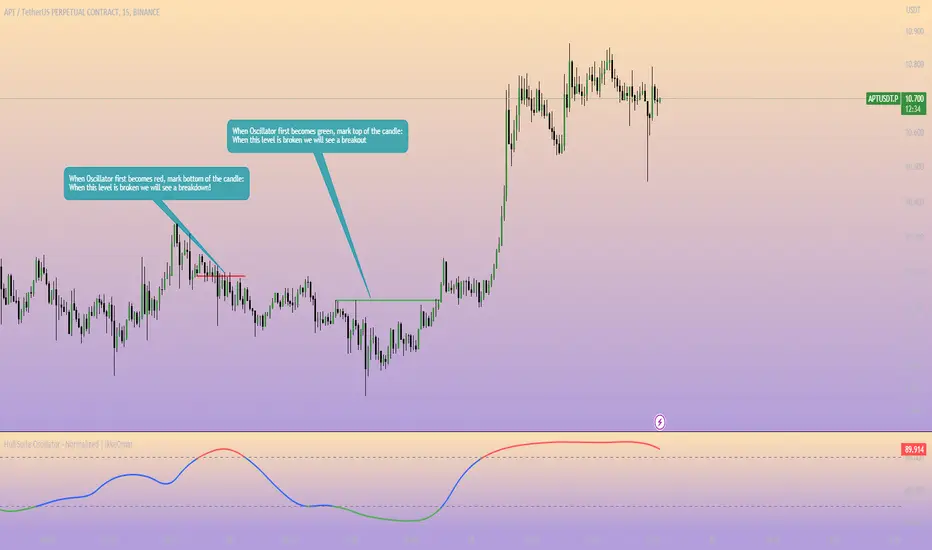
Hull Suite Oscillator - Normalized | IkkeOmarThis script is based off the Hull Suite by @InSilico.
I made this script to provide and calculate the Hull Moving Average (HMA) based on the chosen variation (HMA, TMA, or EMA) and length to then normalize the HMA values to a range of 0 to 100. The normalized values are further smoothed using an exponential moving average (EMA).
The smoothed oscillator is plotted as a line, where values above 80 are colored red, values below 20 are colored green, and values between 20 and 80 are colored blue. Additionally, there are horizontal dashed lines at the levels of 20 and 80 to serve as reference points.
Explanation for the code:
The script uses the close price of the asset as the source for calculations. The modeSwitch parameter allows selecting the type of Hull variation: Hma, Thma, or Ehma. The length parameter determines the calculation period for the Hull moving averages. The lengthMult parameter is used to adjust the length for higher timeframes. The oscSmooth parameter determines the lookback period for smoothing the oscillator.
There are three functions defined for calculating different types of Hull moving averages: HMA, EHMA, and THMA. These functions take the source and length as inputs and return the corresponding Hull moving average.
The Mode function acts as a switch and selects the appropriate Hull variation based on the modeSwitch parameter. It returns the chosen Hull moving average.
The script calculates the Hull moving averages using the selected mode, source, and length. The main Hull moving average is stored in the _hull variable, and aliases are created for the main Hull moving average (HULL), the main Hull value (MHULL), and the secondary Hull value (SHULL).
To create the normalized oscillator values, the script finds the highest and lowest values of the Hull moving average within the specified length. It then normalizes the Hull values to a range of 0 to 100 using a formula. This normalized oscillator represents the strength of the trend.
To smooth out the oscillator values, an exponential moving average is applied using the oscSmooth parameter.
The smoothed oscillator is plotted as a line chart. The line color is determined based on the oscillator value using conditional statements. If the oscillator value is above or equal to 80, the line color is set to red. If it is below or equal to 20, the color is green. Otherwise, it is blue. The linewidth is set to 2.
Additionally, two horizontal reference lines are plotted at levels 20 and 80 for visual reference. They are displayed in gray and dashed style.
T3 Super GuppyA Tillson T3 moving average implemented variation of the CM Super Guppy indicator by @FritzMurphy
The T3 moving average was developed by Tom Tilson which combines multiple EMAs into a single moving average. it is smoother and more responsive compared to traditional moving averages. The disadvantage is that it can overshoot price.
█ Description
T3 Super Guppy consists of 20 T3 moving averages:
• 7 fast T3 MAs
• 13 slow T3 MAs
Visuals:
• Compact view available for chart minimalists
• In compact view only 10 of the fastest T3 moving averages will be displayed
• Compact view will not affect how the colour scales with trend movement
• Ribbon transparency will automatically scale based on the display mode chosen
Colour Gradient
• The more T3 MAs that cross above or below their slower counterparts will result in how deep the chosen upTrend(Blue) or downTrend(Red) colour is displayed
• Helps to spot weakening trends or reversal signals when indicator colour starts converging into the opposite colour
• Single colour mode is available if you find the colour gradient distracting
█ Credits
@ChrisMoody original guppy idea:
@FritzMurphy super guppy format:
█ Examples
compact view:
full view:

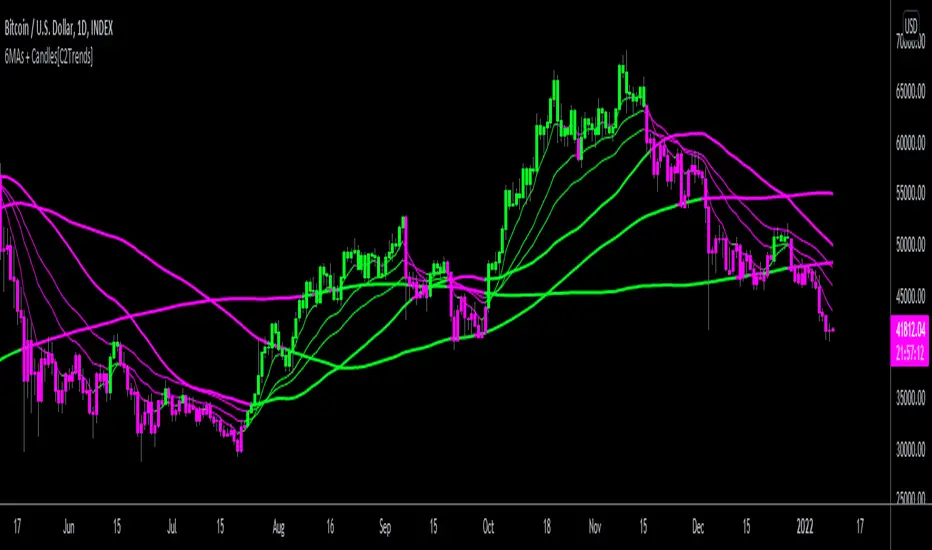
3 EMA/SMA + Colored Candles[C2Trends]// Indicator Features:
// 1) 3 Exponential Moving Averages and 3 Simple Moving Averages.
// 2) Additional EMA input for colored candles(EMA is hidden from chart, input used for coloring of candles only)
// 3) Turn colored candles on/off from main input tab of indicator settings.
// 4) Turn SMA's and EMA's on/off from main input tab of indicator settings.
// 5) Select single color or 2 color EMA and SMA lines from main input tab of indicator settings.
// Indicator Notes:
// 1) 'Candle EMA' input is the trend lookback period for the price candle colors. When price is above desired Candle EMA, price candles will color green. When price is below the Candle EMA, price candles will color fuchsia.
// 2) If you are using another indicator that colors the price candles it may overlap the candle colors applied by this indicator. Trying hiding or removing other indicators to troubleshoot if having candle color issues.
// 3) Using 2-color price moving averages: when price is above an average the average will color green, when price is below an average the average will color fuchsia.
Half Causal EstimatorOverview
The Half Causal Estimator is a specialized filtering method that provides responsive averages of market variables (volume, true range, or price change) with significantly reduced time delay compared to traditional moving averages. It employs a hybrid approach that leverages both historical data and time-of-day patterns to create a timely representation of market activity while maintaining smooth output.
Core Concept
Traditional moving averages suffer from time lag, which can delay signals and reduce their effectiveness for real-time decision making. The Half Causal Estimator addresses this limitation by using a non-causal filtering method that incorporates recent historical data (the causal component) alongside expected future behavior based on time-of-day patterns (the non-causal component).
This dual approach allows the filter to respond more quickly to changing market conditions while maintaining smoothness. The name "Half Causal" refers to this hybrid methodology—half of the data window comes from actual historical observations, while the other half is derived from time-of-day patterns observed over multiple days. By incorporating these "future" values from past patterns, the estimator can reduce the inherent lag present in traditional moving averages.
How It Works
The indicator operates through several coordinated steps. First, it stores and organizes market data by specific times of day (minutes/hours). Then it builds a profile of typical behavior for each time period. For calculations, it creates a filtering window where half consists of recent actual data and half consists of expected future values based on historical time-of-day patterns. Finally, it applies a kernel-based smoothing function to weight the values in this composite window.
This approach is particularly effective because market variables like volume, true range, and price changes tend to follow recognizable intraday patterns (they are positive values without DC components). By leveraging these patterns, the indicator doesn't try to predict future values in the traditional sense, but rather incorporates the average historical behavior at those future times into the current estimate.
The benefit of using this "average future data" approach is that it counteracts the lag inherent in traditional moving averages. In a standard moving average, recent price action is underweighted because older data points hold equal influence. By incorporating time-of-day averages for future periods, the Half Causal Estimator essentially shifts the center of the filter window closer to the current bar, resulting in more timely outputs while maintaining smoothing benefits.
Understanding Kernel Smoothing
At the heart of the Half Causal Estimator is kernel smoothing, a statistical technique that creates weighted averages where points closer to the center receive higher weights. This approach offers several advantages over simple moving averages. Unlike simple moving averages that weight all points equally, kernel smoothing applies a mathematically defined weight distribution. The weighting function helps minimize the impact of outliers and random fluctuations. Additionally, by adjusting the kernel width parameter, users can fine-tune the balance between responsiveness and smoothness.
The indicator supports three kernel types. The Gaussian kernel uses a bell-shaped distribution that weights central points heavily while still considering distant points. The Epanechnikov kernel employs a parabolic function that provides efficient noise reduction with a finite support range. The Triangular kernel applies a linear weighting that decreases uniformly from center to edges. These kernel functions provide the mathematical foundation for how the filter processes the combined window of past and "future" data points.
Applicable Data Sources
The indicator can be applied to three different data sources: volume (the trading volume of the security), true range (expressed as a percentage, measuring volatility), and change (the absolute percentage change from one closing price to the next).
Each of these variables shares the characteristic of being consistently positive and exhibiting cyclical intraday patterns, making them ideal candidates for this filtering approach.
Practical Applications
The Half Causal Estimator excels in scenarios where timely information is crucial. It helps in identifying volume climaxes or diminishing volume trends earlier than conventional indicators. It can detect changes in volatility patterns with reduced lag. The indicator is also useful for recognizing shifts in price momentum before they become obvious in price action, and providing smoother data for algorithmic trading systems that require reduced noise without sacrificing timeliness.
When volatility or volume spikes occur, conventional moving averages typically lag behind, potentially causing missed opportunities or delayed responses. The Half Causal Estimator produces signals that align more closely with actual market turns.
Technical Implementation
The implementation of the Half Causal Estimator involves several technical components working together. Data collection and organization is the first step—the indicator maintains a data structure that organizes market data by specific times of day. This creates a historical record of how volume, true range, or price change typically behaves at each minute/hour of the trading day.
For each calculation, the indicator constructs a composite window consisting of recent actual data points from the current session (the causal half) and historical averages for upcoming time periods from previous sessions (the non-causal half). The selected kernel function is then applied to this composite window, creating a weighted average where points closer to the center receive higher weights according to the mathematical properties of the chosen kernel. Finally, the kernel weights are normalized to ensure the output maintains proper scaling regardless of the kernel type or width parameter.
This framework enables the indicator to leverage the predictable time-of-day components in market data without trying to predict specific future values. Instead, it uses average historical patterns to reduce lag while maintaining the statistical benefits of smoothing techniques.
Configuration Options
The indicator provides several customization options. The data period setting determines the number of days of observations to store (0 uses all available data). Filter length controls the number of historical data points for the filter (total window size is length × 2 - 1). Filter width adjusts the width of the kernel function. Users can also select between Gaussian, Epanechnikov, and Triangular kernel functions, and customize visual settings such as colors and line width.
These parameters allow for fine-tuning the balance between responsiveness and smoothness based on individual trading preferences and the specific characteristics of the traded instrument.
Limitations
The indicator requires minute-based intraday timeframes, securities with volume data (when using volume as the source), and sufficient historical data to establish time-of-day patterns.
Conclusion
The Half Causal Estimator represents an innovative approach to technical analysis that addresses one of the fundamental limitations of traditional indicators: time lag. By incorporating time-of-day patterns into its calculations, it provides a more timely representation of market variables while maintaining the noise-reduction benefits of smoothing. This makes it a valuable tool for traders who need to make decisions based on real-time information about volume, volatility, or price changes.

Uptrick: Time Based ReversionIntroduction
The Uptrick: Time Based Reversion indicator is designed to provide a comprehensive view of market momentum and potential trend shifts by combining multiple moving averages, a streak-based trend analysis system, and adaptive color visualization. It helps traders identify strong trends, spot potential reversals, and make more informed trading decisions.
Purpose
The primary goal of this indicator is to assist traders in distinguishing between sustained market movements and short-lived fluctuations. By evaluating how price behaves relative to its moving averages, and by measuring consecutive streaks above or below these averages, the indicator highlights areas where trends are likely to continue or lose momentum.
Overview
Uptrick: Time Based Reversion calculates one or more moving averages of price data and then tracks the number of consecutive bars (streaks) above or below these averages. This streak-based detection provides insight into whether a trend is gaining strength or nearing a potential reversal point. The indicator offers:
• Multiple moving average types (SMA, EMA, WMA)
• Optional second and third moving average layers for additional smoothing of first moving average
• A streak detection system to quantify trend intensity
• A dynamic color scheme that changes with streak strength
• Optional buy and sell signals for potential trade entries and exits
• A ribbon mode that applies moving averages to Open, High, Low, and Close prices for a more detailed visualization of overall trend alignment
Originality and Uniqueness
Unlike traditional moving average indicators, Uptrick: Time Based Reversion incorporates a streak measurement system to detect trend strength. This approach helps clarify whether a price movement is merely a quick fluctuation or part of a longer-lasting trend. Additionally, the optional ribbon mode extends this logic to Open, High, Low, and Close prices, creating a layered and intuitive visualization that shows complete trend alignment.
Inputs and Features
1. Enable Ribbon Mode
This input lets you activate or deactivate the ribbon display of multiple moving averages. When enabled, the script plots moving averages for the Open, High, Low, and Close prices and uses color fills to show whether these four data points are collectively above or below their respective moving averages.
2. Color Scheme Selection
Users can choose from several predefined color schemes, such as Default, Emerald, Crimson, Sapphire, Gold, Purple, Teal, Orange, Gray, Lime, or Aqua. Each scheme assigns distinct bullish, bearish and neutral colors..
3. Show Buy/Sell Signals
The indicator can display buy or sell signals based on its streak analysis logic. These signals appear as markers on the chart, indicating a “Safe Uptrend” (buy) or “Safe Downtrend” (sell).
4. Moving Average Types and Lengths
• First MA Type and Length: Choose SMA, EMA, or WMA along with a customizable period.
• Second and Third MA Types and Lengths: You can optionally stack additional moving averages for further smoothing, each with its own customizable type and period.
5. Streak Threshold Multiplier
This numeric input determines how strong a streak must be before the script considers it a “safe” trend. A higher multiplier requires a longer or more intense streak for a buy or sell signal.
6. Dynamic Transparency Calculation
The color intensity adapts to the streak’s strength. Longer streaks increase the transparency of the opposing color, making the current dominant color stand out. This feature ensures that a vigorous uptrend or downtrend is visually distinct from short-lived or weaker moves.
7. Ribbon Moving Averages
In ribbon mode, the script calculates moving averages for the Open, High, Low, and Close prices. Each of these is optionally smoothed again if the second and/or third moving average layers are active. The final result is a ribbon of moving averages that helps confirm whether the market is uniformly aligned above or below these key reference points.
Calculation Methodology
1. Initial Moving Average
The script calculates the first moving average (SMA, EMA, or WMA) of the closing price over a user-defined period.
2. Optional Secondary and Tertiary Averages
If selected, the script then applies a second and/or third smoothing step. Each of these steps can be a different type of moving average (SMA, EMA, or WMA) with its own period length.
3. Streak Detection
The indicator counts consecutive bars above or below the smoothed moving average. A running total (streakUp or streakDown) increments with every bar that remains above or below that average.
4. Reversion Intensity
The script compares the current streak value to its own average (calculated over the final chosen period). This ratio determines whether the streak is nearing a likely reversion or is strong enough to continue.
5. Color Assignment and Signals
The indicator calculates color transparency based on streak intensity. Buy and sell signals appear when the streak meets or exceeds the threshold multiplier, indicating a safe uptrend or downtrend.
Color Schemes and Visualization
This indicator offers multiple predefined color sets. Each scheme specifies a unique bullish color, bearish color and neutral color. The script automatically varies transparency to highlight strong trends and fade weaker ones, making it visually clear when a trend is intensifying or losing momentum.
Smoothing Techniques
By allowing up to three layers of moving average smoothing, the indicator accommodates different trading styles. A single layer provides faster reactions to market changes, while more layers reduce noise at the cost of slower responsiveness. Traders can choose the right balance between responsiveness and stability for their strategy, whether it is short-term scalping or long-term trend following.
Why It Combines Specific Smoothing Techniques
The Uptrick: Time Based Reversion indicator strategically combines specific smoothing techniques—SMA, EMA, and WMA—to leverage their complementary strengths. The SMA provides stable and consistent trend identification by equally weighting all data points, while the EMA emphasizes recent price movements, allowing quicker responses to market changes. WMA enhances sensitivity to recent price shifts, which helps in detecting subtle momentum changes early. By integrating these methods in layers, the indicator effectively balances responsiveness with stability, helping traders clearly identify genuine trend changes while filtering out short-term noise and false signals.
Ribbon Mode
If Open, High, Low, and Close prices remain above or below their respective moving averages consistently, the script colors the bars fully bullish or bearish. When the data points are mixed, a neutral color is applied. This mode provides a thorough perspective on whether the entire price range is aligned in one direction or showing conflicting signals.
Summary
Uptrick: Time Based Reversion combines multiple moving averages, streak detection, and dynamic color adjustments to help traders identify significant trends and potential reversal areas. Its flexibility allows it to be used either in a simpler form, with one moving average and streak analysis, or in a more advanced configuration with ribbon mode that charts multiple smoothed averages for a deeper understanding of price alignment. By adapting color intensities based on streak strength and providing optional buy/sell signals, this indicator delivers a clear and flexible tool suited to various trading strategies.
Disclaimer
This indicator is designed as an analysis aid and does not guarantee profitable trades. Past performance does not indicate future success, and market conditions can change unexpectedly. Users are advised to employ proper risk management and thoroughly evaluate trades before taking positions. Use this indicator as part of a broader strategy, not as a sole decision-making tool.

Jobinsabu014This Pine Script code is for an advanced trading indicator that displays enhanced moving averages with buy and sell labels, trend probability, and support/resistance levels. Here’s a detailed description of its components and functionality:
### Description:
1. **Indicator Initialization**:
- The indicator is named "Enhanced Moving Averages with Buy/Sell Labels and Trend Probability" and is set to overlay on the chart.
2. **Input Parameters**:
- **Moving Averages**: Four different moving averages (short and long periods for default and enhanced) with customizable periods.
- **Probability Threshold**: Determines the threshold for trend probability.
- **Support/Resistance Lookback**: Number of bars to look back for calculating support and resistance levels.
- **Signals Valid From**: Timestamp from which the signals are considered valid.
3. **Moving Averages Calculation**:
- **Default Moving Averages**: Calculated using simple moving averages (SMA) for the specified periods.
- **Enhanced Moving Averages**: Calculated using SMAs for different specified periods.
4. **Plotting Moving Averages**:
- Plots the default and enhanced moving averages with different colors for distinction.
5. **Crossover Detection**:
- Detects when the short moving average crosses above or below the long moving average for default moving averages.
6. **Buy/Sell Signal Labels**:
- Adds "BUY" and "SELL" labels on the chart when crossovers are detected after the specified valid timestamp.
- Tracks entry prices for buy/sell signals and adds labels when the price moves +100 points.
7. **Trend Detection for Enhanced Indicator**:
- Detects uptrend or downtrend based on the enhanced moving averages.
- Calculates a simple probability of trend based on price movement and EMA.
- Determines buy and sell signals based on trend conditions and volume-based buy/sell pressure.
8. **Plot Buy/Sell Signals for Enhanced Indicator**:
- Plots buy/sell signals based on the enhanced conditions.
9. **Background Color for Trends**:
- Changes the background color to green for uptrend and red for downtrend.
10. **Trend Lines**:
- Draws imaginary trend lines for uptrend and downtrend based on enhanced moving averages.
11. **Support and Resistance Levels**:
- Calculates and plots support and resistance levels using the specified lookback period.
- Stores and plots previous support and resistance levels with dashed lines.
12. **Expected Trend Labels**:
- Adds labels indicating expected uptrend or downtrend based on buy/sell signals.
13. **Alerts**:
- Sets alert conditions for buy and sell signals, triggering alerts when these conditions are met.
14. **Demand and Supply Zones**:
- Draws and extends horizontal lines for demand (support) and supply (resistance) zones.
### Summary:
This script enhances traditional moving average crossovers by adding trend probability calculations, volume-based pressure, and support/resistance levels. It visualizes expected trends and provides comprehensive buy/sell signals with corresponding labels, background color changes, and alerts to help traders make informed decisions.

Moving Average Filters Add-on w/ Expanded Source Types [Loxx]Moving Average Filters Add-on w/ Expanded Source Types is a conglomeration of specialized and traditional moving averages that will be used in most of indicators that I publish moving forward. There are 39 moving averages included in this indicator as well as expanded source types including traditional Heiken Ashi and Better Heiken Ashi candles. You can read about the expanded source types clicking here . About half of these moving averages are closed source on other trading platforms. This indicator serves as a reference point for future public/private, open/closed source indicators that I publish to TradingView. Information about these moving averages was gleaned from various forex and trading forums and platforms as well as TASC publications and other assorted research publications.
________________________________________________________________
Included moving averages
ADXvma - Average Directional Volatility Moving Average
Linnsoft's ADXvma formula is a volatility-based moving average, with the volatility being determined by the value of the ADX indicator.
The ADXvma has the SMA in Chande's CMO replaced with an EMA, it then uses a few more layers of EMA smoothing before the "Volatility Index" is calculated.
A side effect is, those additional layers slow down the ADXvma when you compare it to Chande's Variable Index Dynamic Average VIDYA.
The ADXVMA provides support during uptrends and resistance during downtrends and will stay flat for longer, but will create some of the most accurate market signals when it decides to move.
Ahrens Moving Average
Richard D. Ahrens's Moving Average promises "Smoother Data" that isn't influenced by the occasional price spike. It works by using the Open and the Close in his formula so that the only time the Ahrens Moving Average will change is when the candlestick is either making new highs or new lows.
Alexander Moving Average - ALXMA
This Moving Average uses an elaborate smoothing formula and utilizes a 7 period Moving Average. It corresponds to fitting a second-order polynomial to seven consecutive observations. This moving average is rarely used in trading but is interesting as this Moving Average has been applied to diffusion indexes that tend to be very volatile.
Double Exponential Moving Average - DEMA
The Double Exponential Moving Average (DEMA) combines a smoothed EMA and a single EMA to provide a low-lag indicator. It's primary purpose is to reduce the amount of "lagging entry" opportunities, and like all Moving Averages, the DEMA confirms uptrends whenever price crosses on top of it and closes above it, and confirms downtrends when the price crosses under it and closes below it - but with significantly less lag.
Double Smoothed Exponential Moving Average - DSEMA
The Double Smoothed Exponential Moving Average is a lot less laggy compared to a traditional EMA. It's also considered a leading indicator compared to the EMA, and is best utilized whenever smoothness and speed of reaction to market changes are required.
Exponential Moving Average - EMA
The EMA places more significance on recent data points and moves closer to price than the SMA (Simple Moving Average). It reacts faster to volatility due to its emphasis on recent data and is known for its ability to give greater weight to recent and more relevant data. The EMA is therefore seen as an enhancement over the SMA.
Fast Exponential Moving Average - FEMA
An Exponential Moving Average with a short look-back period.
Fractal Adaptive Moving Average - FRAMA
The Fractal Adaptive Moving Average by John Ehlers is an intelligent adaptive Moving Average which takes the importance of price changes into account and follows price closely enough to display significant moves whilst remaining flat if price ranges. The FRAMA does this by dynamically adjusting the look-back period based on the market's fractal geometry.
Hull Moving Average - HMA
Alan Hull's HMA makes use of weighted moving averages to prioritize recent values and greatly reduce lag whilst maintaining the smoothness of a traditional Moving Average. For this reason, it's seen as a well-suited Moving Average for identifying entry points.
IE/2 - Early T3 by Tim Tilson
The IE/2 is a Moving Average that uses Linear Regression slope in its calculation to help with smoothing. It's a worthy Moving Average on it's own, even though it is the precursor and very early version of the famous "T3 Indicator".
Integral of Linear Regression Slope - ILRS
A Moving Average where the slope of a linear regression line is simply integrated as it is fitted in a moving window of length N (natural numbers in maths) across the data. The derivative of ILRS is the linear regression slope. ILRS is not the same as a SMA (Simple Moving Average) of length N, which is actually the midpoint of the linear regression line as it moves across the data.
Instantaneous Trendline
The Instantaneous Trendline is created by removing the dominant cycle component from the price information which makes this Moving Average suitable for medium to long-term trading.
Laguerre Filter
The Laguerre Filter is a smoothing filter which is based on Laguerre polynomials. The filter requires the current price, three prior prices, a user defined factor called Alpha to fill its calculation.
Adjusting the Alpha coefficient is used to increase or decrease its lag and it's smoothness.
Leader Exponential Moving Average
The Leader EMA was created by Giorgos E. Siligardos who created a Moving Average which was able to eliminate lag altogether whilst maintaining some smoothness. It was first described during his research paper "MACD Leader" where he applied this to the MACD to improve its signals and remove its lagging issue. This filter uses his leading MACD's "modified EMA" and can be used as a zero lag filter.
Linear Regression Value - LSMA (Least Squares Moving Average)
LSMA as a Moving Average is based on plotting the end point of the linear regression line. It compares the current value to the prior value and a determination is made of a possible trend, eg. the linear regression line is pointing up or down.
Linear Weighted Moving Average - LWMA
LWMA reacts to price quicker than the SMA and EMA. Although it's similar to the Simple Moving Average, the difference is that a weight coefficient is multiplied to the price which means the most recent price has the highest weighting, and each prior price has progressively less weight. The weights drop in a linear fashion.
McGinley Dynamic
John McGinley created this Moving Average to track price better than traditional Moving Averages. It does this by incorporating an automatic adjustment factor into its formula, which speeds (or slows) the indicator in trending, or ranging, markets.
McNicholl EMA
Dennis McNicholl developed this Moving Average to use as his center line for his "Better Bollinger Bands" indicator and was successful because it responded better to volatility changes over the standard SMA and managed to avoid common whipsaws.
Non lag moving average
The Non Lag Moving average follows price closely and gives very quick signals as well as early signals of price change. As a standalone Moving Average, it should not be used on its own, but as an additional confluence tool for early signals.
Parabolic Weighted Moving Average
The Parabolic Weighted Moving Average is a variation of the Linear Weighted Moving Average. The Linear Weighted Moving Average calculates the average by assigning different weight to each element in its calculation. The Parabolic Weighted Moving Average is a variation that allows weights to be changed to form a parabolic curve. It is done simply by using the Power parameter of this indicator.
Recursive Moving Trendline
Dennis Meyers's Recursive Moving Trendline uses a recursive (repeated application of a rule) polynomial fit, a technique that uses a small number of past values estimations of price and today's price to predict tomorrows price.
Simple Moving Average - SMA
The SMA calculates the average of a range of prices by adding recent prices and then dividing that figure by the number of time periods in the calculation average. It is the most basic Moving Average which is seen as a reliable tool for starting off with Moving Average studies. As reliable as it may be, the basic moving average will work better when it's enhanced into an EMA.
Sine Weighted Moving Average
The Sine Weighted Moving Average assigns the most weight at the middle of the data set. It does this by weighting from the first half of a Sine Wave Cycle and the most weighting is given to the data in the middle of that data set. The Sine WMA closely resembles the TMA (Triangular Moving Average).
Smoothed Moving Average - SMMA
The Smoothed Moving Average is similar to the Simple Moving Average (SMA), but aims to reduce noise rather than reduce lag. SMMA takes all prices into account and uses a long lookback period. Due to this, it's seen a an accurate yet laggy Moving Average.
Smoother
The Smoother filter is a faster-reacting smoothing technique which generates considerably less lag than the SMMA (Smoothed Moving Average). It gives earlier signals but can also create false signals due to its earlier reactions. This filter is sometimes wrongly mistaken for the superior Jurik Smoothing algorithm.
Super Smoother
The Super Smoother filter uses John Ehlers’s “Super Smoother” which consists of a a Two pole Butterworth filter combined with a 2-bar SMA (Simple Moving Average) that suppresses the 22050 Hz Nyquist frequency: A characteristic of a sampler, which converts a continuous function or signal into a discrete sequence.
Three pole Ehlers Butterworth
The 3 pole Ehlers Butterworth (as well as the Two pole Butterworth) are both superior alternatives to the EMA and SMA. They aim at producing less lag whilst maintaining accuracy. The 2 pole filter will give you a better approximation for price, whereas the 3 pole filter has superior smoothing.
Three pole Ehlers smoother
The 3 pole Ehlers smoother works almost as close to price as the above mentioned 3 Pole Ehlers Butterworth. It acts as a strong baseline for signals but removes some noise. Side by side, it hardly differs from the Three Pole Ehlers Butterworth but when examined closely, it has better overshoot reduction compared to the 3 pole Ehlers Butterworth.
Triangular Moving Average - TMA
The TMA is similar to the EMA but uses a different weighting scheme. Exponential and weighted Moving Averages will assign weight to the most recent price data. Simple moving averages will assign the weight equally across all the price data. With a TMA (Triangular Moving Average), it is double smoother (averaged twice) so the majority of the weight is assigned to the middle portion of the data.
The TMA and Sine Weighted Moving Average Filter are almost identical at times.
Triple Exponential Moving Average - TEMA
The TEMA uses multiple EMA calculations as well as subtracting lag to create a tool which can be used for scalping pullbacks. As it follows price closely, it's signals are considered very noisy and should only be used in extremely fast-paced trading conditions.
Two pole Ehlers Butterworth
The 2 pole Ehlers Butterworth (as well as the three pole Butterworth mentioned above) is another filter that cuts out the noise and follows the price closely. The 2 pole is seen as a faster, leading filter over the 3 pole and follows price a bit more closely. Analysts will utilize both a 2 pole and a 3 pole Butterworth on the same chart using the same period, but having both on chart allows its crosses to be traded.
Two pole Ehlers smoother
A smoother version of the Two pole Ehlers Butterworth. This filter is the faster version out of the 3 pole Ehlers Butterworth. It does a decent job at cutting out market noise whilst emphasizing a closer following to price over the 3 pole Ehlers.
Volume Weighted EMA - VEMA
Utilizing tick volume in MT4 (or real volume in MT5), this EMA will use the Volume reading in its decision to plot its moves. The more Volume it detects on a move, the more authority (confirmation) it has. And this EMA uses those Volume readings to plot its movements.
Studies show that tick volume and real volume have a very strong correlation, so using this filter in MT4 or MT5 produces very similar results and readings.
Zero Lag DEMA - Zero Lag Double Exponential Moving Average
John Ehlers's Zero Lag DEMA's aim is to eliminate the inherent lag associated with all trend following indicators which average a price over time. Because this is a Double Exponential Moving Average with Zero Lag, it has a tendency to overshoot and create a lot of false signals for swing trading. It can however be used for quick scalping or as a secondary indicator for confluence.
Zero Lag Moving Average
The Zero Lag Moving Average is described by its creator, John Ehlers, as a Moving Average with absolutely no delay. And it's for this reason that this filter will cause a lot of abrupt signals which will not be ideal for medium to long-term traders. This filter is designed to follow price as close as possible whilst de-lagging data instead of basing it on regular data. The way this is done is by attempting to remove the cumulative effect of the Moving Average.
Zero Lag TEMA - Zero Lag Triple Exponential Moving Average
Just like the Zero Lag DEMA, this filter will give you the fastest signals out of all the Zero Lag Moving Averages. This is useful for scalping but dangerous for medium to long-term traders, especially during market Volatility and news events. Having no lag, this filter also has no smoothing in its signals and can cause some very bizarre behavior when applied to certain indicators.
________________________________________________________________
What are Heiken Ashi "better" candles?
The "better formula" was proposed in an article/memo by BNP-Paribas (In Warrants & Zertifikate, No. 8, August 2004 (a monthly German magazine published by BNP Paribas, Frankfurt), there is an article by Sebastian Schmidt about further development (smoothing) of Heikin-Ashi chart.)
They proposed to use the following:
(Open+Close)/2+(((Close-Open)/( High-Low ))*ABS((Close-Open)/2))
instead of using :
haClose = (O+H+L+C)/4
According to that document the HA representation using their proposed formula is better than the traditional formula.
What are traditional Heiken-Ashi candles?
The Heikin-Ashi technique averages price data to create a Japanese candlestick chart that filters out market noise.
Heikin-Ashi charts, developed by Munehisa Homma in the 1700s, share some characteristics with standard candlestick charts but differ based on the values used to create each candle. Instead of using the open, high, low, and close like standard candlestick charts, the Heikin-Ashi technique uses a modified formula based on two-period averages. This gives the chart a smoother appearance, making it easier to spots trends and reversals, but also obscures gaps and some price data.
Expanded generic source types:
Close = close
Open = open
High = high
Low = low
Median = hl2
Typical = hlc3
Weighted = hlcc4
Average = ohlc4
Average Median Body = (open+close)/2
Trend Biased = (see code, too complex to explain here)
Trend Biased (extreme) = (see code, too complex to explain here)
Included:
-Toggle bar color on/off
-Toggle signal line on/off

Signal Hunter Pro - GKDXLSignal Hunter Pro - GKDXL combines four powerful technical indicators with trend strength filtering and volume confirmation to generate reliable BUY/SELL signals. This indicator is perfect for traders who want a systematic approach to market analysis without the noise of conflicting signals.
🔧 Core Features
📈 Multi-Indicator Signal System
Moving Averages: EMA 20, EMA 50, and SMA 200 for trend analysis
Bollinger Bands: Dynamic support/resistance with price momentum detection
RSI: Enhanced RSI logic with smoothing and multi-zone analysis
MACD: Traditional MACD with signal line crossovers and zero-line analysis
🎛️ Advanced Filtering System
ADX Trend Strength Filter: Only signals when trend strength exceeds threshold
Volume Confirmation: Ensures signals occur with adequate volume participation
Multi-Timeframe Logic: Works on any timeframe from 1m to 1D and beyond
🚨 Intelligent Signal Generation
Requires 3 out of 4 indicators to align for signal confirmation
Separate bullish and bearish signal conditions
Real-time signal strength scoring (1/4 to 4/4)
Built-in alert system for automated notifications
⚙️ Customizable Parameters
📊 Technical Settings
Moving Averages: Adjustable EMA and SMA periods
Bollinger Bands: Configurable length and multiplier
RSI: Customizable length, smoothing, and overbought/oversold levels
MACD: Flexible fast, slow, and signal line settings
🎯 Risk Management
Risk Percentage: Set your risk per trade (0.1% to 10%)
Reward Ratio: Configure risk-to-reward ratios (1:1 to 1:5)
ADX Threshold: Control minimum trend strength requirements
🖥️ Display Options
Indicator Visibility: Toggle individual indicators on/off
Information Table: Optional detailed status table (off by default)
Volume Analysis: Real-time volume vs. average comparison
🎨 Visual Elements
📈 Chart Indicators
EMA Lines: Blue (20) and Orange (50) exponential moving averages
SMA 200: Gray long-term trend line
Bollinger Bands: Upper/lower bands with semi-transparent fill
Clean Interface: Minimal visual clutter for clear analysis
📋 Information Table (Optional)
Real-time indicator status with ✓/✗/— symbols
Current signal strength and direction
ADX trend strength measurement
Volume confirmation status
No-signal reasons when conditions aren't met
🔔 Alert System
📢 Three Alert Types
BUY Signal: Triggered when 3+ indicators align bullishly
SELL Signal: Triggered when 3+ indicators align bearishly
General Alert: Any signal detection for broader monitoring
📱 Alert Messages
Clear, actionable alert text
Includes indicator name for easy identification
Compatible with webhook integrations
🎯 How It Works
📊 Signal Logic
Indicator Assessment: Each of the 4 indicators is evaluated as Bullish/Bearish/Neutral
Consensus Building: Counts aligned indicators (minimum 3 required)
Filter Application: Applies trend strength and volume filters
Signal Generation: Generates BUY/SELL when all conditions are met
🔍 Indicator States
Moving Averages: Price position, EMA alignment, and crossovers
Bollinger Bands: Price relative to bands and momentum shifts
RSI: Multi-zone analysis with momentum and crossover detection
MACD: Signal line crossovers and zero-line positioning
🎉 Why Choose Signal Hunter Pro?
✅ Multi-Indicator Confirmation reduces false signals
✅ Trend Strength Filtering improves win rate
✅ Volume Confirmation ensures market participation
✅ Customizable Parameters adapt to any trading style
✅ Clean Visual Design doesn't clutter your charts
✅ Professional Alert System for automated trading
✅ No Repainting - reliable historical signals
✅ Works on All Timeframes from scalping to investing

$TUBR: 7-25-99 Moving Average7, 25, and 99 Period Moving Averages
This indicator plots three moving averages: the 7-period, 25-period, and 99-period Simple Moving Averages (SMA). These moving averages are widely used to smooth out price action and help traders identify trends over different time frames. Let's break down the significance of these specific moving averages from both supply and demand perspectives and a price action perspective.
1. Supply and Demand Perspective:
- 7-period Moving Average (Short-Term) :
The 7-period moving average represents the short-term sentiment in the market. It captures the rapid fluctuations in price and is heavily influenced by recent supply and demand changes. Traders often look to the 7-period SMA for immediate price momentum, with price moving above or below this line signaling short-term strength or weakness.
- Bullish Supply/Demand : When price is above the 7-period SMA, it suggests that buyers are currently in control and demand is higher than supply. Conversely, price falling below this line indicates that supply is overpowering demand, leading to a short-term downtrend.
Is current price > average price in past 7 candles (depending on timeframe)? This will tell you how aggressive buyers are in short term.
- Key Supply/Demand Zones : The 7-period SMA often acts as dynamic support or resistance in a trending market, where traders might use it to enter or exit positions based on how price interacts with this level.
- 25-period Moving Average (Medium-Term) :
The 25-period SMA smooths out more of the noise compared to the 7-period, providing a more stable indication of intermediate trends. This moving average is often used to gauge the market's supply and demand balance over a broader timeframe than the short-term 7-period SMA.
- Supply/Demand Balance : The 25-period SMA reflects the medium-term equilibrium between supply and demand. A crossover between the price and the 25-period SMA may indicate a shift in this balance. When price sustains above the 25-period SMA, it shows that demand is strong enough to maintain an upward trend. Conversely, if the price stays below it, supply is likely exceeding demand.
Is current price > average price in past 25 candles (depending on timeframe)? This will tell you how aggressive buyers are in mid term.
- Momentum Shift : Crossovers between the 7-period and 25-period SMAs can indicate momentum shifts between short-term and medium-term demand. For example, if the 7-period crosses above the 25-period, it often signifies growing short-term demand relative to the medium-term trend, signaling potential buy opportunities. What this crossover means is that if 7MA > 25MA that means in past 7 candles average price is more than past 25 candles.
- 99-period Moving Average (Long-Term):
The 99-period SMA represents the long-term trend and reflects the market's supply and demand over an extended period. This moving average filters out short-term fluctuations and highlights the market's overall trajectory.
- Long-Term Supply/Demand Dynamics : The 99-period SMA is slower to react to changes in supply and demand, providing a more stable view of the market's overall trend. Price staying above this line shows sustained demand dominance, while price consistently staying below reflects ongoing supply pressure.
Is current price > average price in past 99 candles (depending on timeframe)? This will tell you how aggressive buyers are in long term.
- Market Trend Confirmation : When both the 7-period and 25-period SMAs are above the 99-period SMA, it signals a strong bullish trend with demand outweighing supply across all timeframes. If all three SMAs are below the 99-period SMA, it points to a bear market where supply is overpowering demand in both the short and long term.
2. Price Action Perspective :
- 7-period Moving Average (Short-Term Trends):
The 7-period moving average closely tracks price action, making it highly responsive to quick shifts in price. Traders often use it to confirm short-term reversals or continuations in price action. In an uptrend, price typically stays above the 7-period SMA, whereas in a downtrend, price stays below it.
- Short-Term Price Reversals : Crossovers between the price and the 7-period SMA often indicate short-term reversals. When price breaks above the 7-period SMA after staying below it, it suggests a potential bullish reversal. Conversely, a price breakdown below the 7-period SMA could signal a bearish reversal.
- 25-period Moving Average (Medium-Term Trends) :
The 25-period SMA helps identify the medium-term price action trend. It balances short-term volatility and longer-term stability, providing insight into the more persistent trend. Price pullbacks to the 25-period SMA during an uptrend can act as a buying opportunity for trend traders, while pullbacks during a downtrend may offer shorting opportunities.
- Pullback and Continuation: In trending markets, price often retraces to the 25-period SMA before continuing in the direction of the trend. For instance, if the price is in a bullish trend, traders may look for support at the 25-period SMA for potential continuation trades.
- 99-period Moving Average (Long-Term Trend and Market Sentiment ):
The 99-period SMA is the most critical for identifying the overall market trend. Price consistently trading above the 99-period SMA indicates long-term bullish momentum, while price staying below the 99-period SMA suggests bearish sentiment.
- Trend Confirmation : Price action above the 99-period SMA confirms long-term upward momentum, while price action below it confirms a downtrend. The space between the shorter moving averages (7 and 25) and the 99-period SMA gives a sense of the strength or weakness of the trend. Larger gaps between the 7 and 99 SMAs suggest strong bullish momentum, while close proximity indicates consolidation or potential reversals.
- Price Action in Trending Markets : Traders often use the 99-period SMA as a dynamic support/resistance level. In strong trends, price tends to stay on one side of the 99-period SMA for extended periods, with breaks above or below signaling major changes in market sentiment.
Why These Numbers Matter:
7-Period MA : The 7-period moving average is a popular choice among short-term traders who want to capture quick momentum changes. It helps visualize immediate market sentiment and is often used in conjunction with price action to time entries or exits.
- 25-Period MA: The 25-period MA is a key indicator for swing traders. It balances sensitivity and stability, providing a clearer picture of the intermediate trend. It helps traders stay in trades longer by filtering out short-term noise, while still being reactive enough to detect reversals.
- 99-Period MA : The 99-period moving average provides a broad view of the market's direction, filtering out much of the short- and medium-term noise. It is crucial for identifying long-term trends and assessing whether the market is bullish or bearish overall. It acts as a key reference point for longer-term trend followers, helping them stay with the broader market sentiment.
Conclusion:
From a supply and demand perspective, the 7, 25, and 99-period moving averages help traders visualize shifts in the balance between buyers and sellers over different time horizons. The price action interaction with these moving averages provides valuable insight into short-term momentum, intermediate trends, and long-term market sentiment. Using these three MAs together gives a more comprehensive understanding of market conditions, helping traders align their strategies with prevailing trends across various timeframes.
------------- RULE BASED SYSTEM ---------------
Overview of the Rule-Based System:
This system will use the following moving averages:
7-period MA: Represents short-term price action.
25-period MA: Represents medium-term price action.
99-period MA: Represents long-term price action.
1. Trend Identification Rules:
Bullish Trend:
The 7-period MA is above the 25-period MA, and the 25-period MA is above the 99-period MA.
This structure shows that short, medium, and long-term trends are aligned in an upward direction, indicating strong bullish momentum.
Bearish Trend:
The 7-period MA is below the 25-period MA, and the 25-period MA is below the 99-period MA.
This suggests that the market is in a downtrend, with bearish momentum dominating across timeframes.
Neutral/Consolidation:
The 7-period MA and 25-period MA are flat or crossing frequently with the 99-period MA, and they are close to each other.
This indicates a sideways or consolidating market where there’s no strong trend direction.
2. Entry Rules:
Bullish Entry (Buy Signals):
Primary Buy Signal:
The price crosses above the 7-period MA, AND the 7-period MA is above the 25-period MA, AND the 25-period MA is above the 99-period MA.
This indicates the start of a new upward trend, with alignment across the short, medium, and long-term trends.
Pullback Buy Signal (for trend continuation):
The price pulls back to the 25-period MA, and the 7-period MA remains above the 25-period MA.
This indica
tes that the pullback is a temporary correction in an uptrend, and buyers may re-enter the market as price approaches the 25-period MA.
You can further confirm the signal by waiting for price action (e.g., bullish candlestick patterns) at the 25-period MA level.
Breakout Buy Signal:
The price crosses above the 99-period MA, and the 7-period and 25-period MAs are also both above the 99-period MA.
This confirms a strong bullish breakout after consolidation or a long-term downtrend.
Bearish Entry (Sell Signals):
Primary Sell Signal:
The price crosses below the 7-period MA, AND the 7-period MA is below the 25-period MA, AND the 25-period MA is below the 99-period MA.
This indicates the start of a new downtrend with alignment across the short, medium, and long-term trends.
Pullback Sell Signal (for trend continuation):
The price pulls back to the 25-period MA, and the 7-period MA remains below the 25-period MA.
This indicates that the pullback is a temporary retracement in a downtrend, providing an opportunity to sell as price meets resistance at the 25-period MA.
Breakdown Sell Signal:
The price breaks below the 99-period MA, and the 7-period and 25-period MAs are also below the 99-period MA.
This confirms a strong bearish breakdown after consolidation or a long-term uptrend reversal.
3. Exit Rules:
Bullish Exit (for long positions):
Short-Term Exit:
The price closes below the 7-period MA, and the 7-period MA starts crossing below the 25-period MA.
This indicates weakening momentum in the uptrend, suggesting an exit from the long position.
Stop-Loss Trigger:
The price falls below the 99-period MA, signaling the breakdown of the long-term trend.
This can act as a final exit signal to minimize losses if the long-term uptrend is invalidated.
Bearish Exit (for short positions):
Short-Term Exit:
The price closes above the 7-period MA, and the 7-period MA starts crossing above the 25-period MA.
This indicates a potential weakening of the downtrend and signals an exit from the short position.
Stop-Loss Trigger:
The price breaks above the 99-period MA, invalidating the bearish trend.
This signals that the market may be reversing to the upside, and exiting short positions would be prudent.

MAC Investor V3.0 [VK]This indicator combines multiple functionalities to assist traders in making informed decisions. It primarily uses Heikin Ashi candles, Moving Averages, and a Price Action Channel (PAC) to provide signals for entering and exiting trades. Here's a detailed breakdown:
Inputs
MAC Length: Sets the length for the PAC calculation.
Use Heikin Ashi Candles: Option to use Heikin Ashi candles for calculations.
Show Coloured Bars around MAC: Option to color bars based on their relation to the PAC.
Show Long/Short Signals: Options to display long and short signals.
Show MAs? : Option to show moving averages on the chart.
Show MAs Trend at the Bottom?: Option to show trend signals at the bottom of the chart.
MA Lengths: Length settings for three different moving averages.
Change MA Color Based on Direction?: Option to change the color of moving averages based on trend direction.
MA Higher TimeFrame: Allows setting a higher timeframe for moving averages.
Show SL-TP Lines: Option to display Stop Loss and Take Profit lines.
SL/TP Percentages: Set the percentages for Stop Loss and three levels of Take Profit.
Calculations and Features
Heikin Ashi Candles: Calculations are based on Heikin Ashi candle data if selected.
Price Action Channel (PAC): Uses Exponential Moving Averages (EMA) of the high, low, and close to create a channel.
Bar Coloring: Colors the bars based on their position relative to the PAC.
Long and Short Signals: Uses crossovers of the close price and PAC upper/lower bands to generate signals.
Moving Averages (MA): Plots three moving averages and colors them based on their trend direction.
Overall Trend Indicators: Uses triangles at the bottom of the chart to show the overall trend of the MAs.
Stop Loss and Take Profit Levels: Calculates and plots these levels based on user-defined percentages from the entry price.
Alerts: Provides alerts for long and short signals.
Use Cases and How to Use
Identifying Trends: The PAC helps to identify the trend direction. If the closing price is above the PAC upper band, it suggests an uptrend; if below the lower band, it suggests a downtrend.
Entering Trades: Use the long and short signals to enter trades. A long signal is generated when the closing price crosses above the PAC upper band, and a short signal is generated when it crosses below the PAC lower band.
Exit Strategies: Utilize the Stop Loss (SL) and Take Profit (TP) levels to manage risk and lock in profits. These levels are automatically calculated based on the entry price and user-defined percentages.
Trend Confirmation with MAs: The moving averages provide additional confirmation of the trend. When all three MAs are trending in the same direction (e.g., all green for an uptrend), it adds confidence to the trade signal.
Overall Trend Indicators: The triangles at the bottom of the chart show the overall trend direction of the MAs:
Green Triangle: All three MAs are trending upwards, indicating a strong uptrend.
Red Triangle: All three MAs are trending downwards, indicating a strong downtrend.
Yellow Triangle: Mixed signals from the MAs, indicating no clear trend.
Bar Coloring for Quick Analysis: The colored bars give a quick visual cue about the market condition, aiding in faster decision-making.
Alerts: Set up alerts to get notified when a long or short signal is generated, allowing you to act promptly without constantly monitoring the chart.
Maximizing Profit
To maximize profit with this indicator:
Follow the Signals: Use the long and short signals to time your entries. Ensure you follow the trend indicated by the PAC and MAs.
Risk Management: Always set your Stop Loss and Take Profit levels to manage risk. This will help you cut losses early and secure profits.
Confirm with MAs: Look for confirmation from the moving averages. When all MAs align with the signal, it indicates a stronger trend.
Overall Trend Indicators: Pay attention to the triangles at the bottom for overall trend confirmation. Only enter trades when the overall trend is in your favor.
Heikin Ashi for Smoothing: Use Heikin Ashi candles for smoother trends and fewer false signals.
Backtesting: Test the indicator on historical data to understand its performance and adjust settings as necessary.
Adapt to Market Conditions: Adjust the lengths of PAC and MAs based on the market's volatility and timeframe you are trading on.
How to Use the Indicator
Add to Chart: Add the indicator to your TradingView chart.
Configure Settings: Customize the input settings to fit your trading strategy and timeframe.
Monitor Signals: Watch for long and short signals and observe the trend direction with the PAC and MAs.
Check Overall Trend: Look at the triangles at the bottom of the chart to see the overall trend direction of the MAs.
Set Alerts: Configure alerts to get notified of new signals.
Manage Trades: Use the SL and TP levels to manage your trades effectively.

Bar Balance [LucF]Bar Balance extracts the number of up, down and neutral intrabars contained in each chart bar, revealing information on the strength of price movement. It can display stacked columns representing raw up/down/neutral intrabar counts, or an up/down balance line which can be calculated and visualized in many different ways.
WARNING: This is an analysis tool that works on historical bars only. It does not show any realtime information, and thus cannot be used to issue alerts or for automated trading. When realtime bars elapse, the indicator will require a browser refresh, a change to its Inputs or to the chart's timeframe/symbol to recalculate and display information on those elapsed bars. Once a trader understands this, the indicator can be used advantageously to make discretionary trading decisions.
Traders used to work with my Delta Volume Columns Pro will feel right at home in this indicator's Inputs . It has lots of options, allowing it to be used in many different ways. If you value the bar balance information this indicator mines, I hope you will find the time required to master the use of Bar Balance well worth the investment.
█ OVERVIEW
The indicator has two modes: Columns and Line .
Columns
• In Columns mode you can display stacked Up/Down/Neutral columns.
• The "Up" section represents the count of intrabars where `close > open`, "Down" where `close < open` and "Neutral" where `close = open`.
• The Up section always appears above the centerline, the Down section below. The Neutral section overlaps the centerline, split halfway above and below it.
The Up and Down sections start where the Neutral section ends, when there is one.
• The Up and Down sections can be colored independently using 7 different methods.
• The signal line plotted in Line mode can also be displayed in Columns mode.
Line
• Displays a single balance line using a zero centerline.
• A variable number of independent methods can be used to calculate the line (6), determine its color (5), and color the fill (5).
You can thus evaluate the state of 3 different components with this single line.
• A "Divergence Levels" feature will use the line to automatically draw expanding levels on divergence events.
Features available in both modes
• The color of all components can be selected from 15 base colors, with 16 gradient levels used for each base color in the indicator's gradients.
• A zero line can show a 6-state aggregate value of the three main volume balance modes.
• The background can be colored using any of 5 different methods.
• Chart bars can be colored using 5 different methods.
• Divergence and large neutral count ratio events can be shown in either Columns or Line mode, calculated in one of 4 different methods.
• Markers on 6 different conditions can be displayed.
█ CONCEPTS
Intrabar inspection
Intrabar inspection means the indicator looks at lower timeframe bars ( intrabars ) making up a given chart bar to gather its information. If your chart is on a 1-hour timeframe and the intrabar resolution determined by the indicator is 5 minutes, then 12 intrabars will be analyzed for each chart bar and the count of up/down/neutral intrabars among those will be tallied.
Bar Balances and calculation methods
The indicator uses a variety of methods to evaluate bar balance and to derive other calculations from them:
1. Balance on Bar : Uses the relative importance of instant Up and Down counts on the bar.
2. Balance Averages : Uses the difference between the EMAs of Up and Down counts.
3. Balance Momentum : Starts by calculating, separately for both Up and Down counts, the difference between the same EMAs used in Balance Averages and an SMA of double the period used for the EMAs. These differences are then aggregated and finally, a bounded momentum of that aggregate is calculated using RSI.
4. Markers Bias : It sums the bull/bear occurrences of the four previous markers over a user-defined period (the default is 14).
5. Combined Balances : This is the aggregate of the instant bull/bear bias of the three main bar balances.
6. Dual Up/Down Averages : This is a display mode showing the EMA calculated for each of the Up and Down counts.
Interpretation of neutral intrabars
What do neutral intrabars mean? When price does not change during a bar, it can be because there is simply no interest in the market, or because of a perfect balance between buyers and sellers. The latter being more improbable, Bar Balance assumes that neutral bars reveal a lack of interest, which entails uncertainty. That is the reason why the option is provided to interpret ratios of neutral intrabars greater than 50% as divergences. It is also the rationale behind the option to dampen signal lines on the inverse ratio of neutral intrabars, so that zero intrabars do not affect the signal, and progressively larger proportions of neutral intrabars will reduce the signal's amplitude, as the balance calcs using the up/down counts lose significance. The impact of the dampening will vary with markets. Weaker markets such as cryptos will often contain greater numbers of neutral intrabars, so dampening the Line in that sector will have a greater impact than in more liquid markets.
█ FEATURES
1 — Columns
• While the size of the Up/Down columns always represents their respective importance on the bar, their coloring mode is independent. The default setup uses a standard coloring mode where the Up/Down columns over/under the zero line are always in the bull/bear color with a higher intensity for the winning side. Six other coloring modes allow you to pack more information in the columns. When choosing to color the top columns using a bull/bear gradient on Balance Averages, for example, you will end up with bull/bear colored tops. In order for the color of the bottom columns to continue to show the instant bar balance, you can then choose the "Up/Down Ratio on Bar — Dual Solid Colors" coloring mode to make those bars the color of the winning side for that bar.
• Line mode shows only the line, but Columns mode allows displaying the line along with it. If the scale of the line is different than that of the scale of the columns, the line will often appear flat. Traders may find even a flat line useful as its bull/bear colors will be easily distinguishable.
2 — Line
• The default setup for Line mode uses a calculation on "Balance Momentum", with a fill on the longer-term "Balance Averages" and a line color based on the "Markers Bias". With the background set on "Line vs Divergence Levels" and the zero line on the hard-coded "Combined Bar Balances", you have access to five distinct sources of information at a glance, to which you can add divergences, divergences levels and chart bar coloring. This provides powerful potential in displaying bar balance information.
• When no columns are displayed, Line mode can show the full scale of whichever line you choose to calculate because the columns' scale no longer interferes with the line's scale.
• Note that when "Balance on Bar" is selected, the Neutral count is also displayed as a ratio of the balance line. This is the only instance where the Neutral count is displayed in Line mode.
• The "Dual Up/Down Averages" is an exception as it displays two lines: one average for the Up counts and another for the Down counts. This mode will be most useful when Columns are also displayed, as it provides a reference for the top and bottom columns.
3 — Zero Line
The zero line can be colored using two methods, both based on the Combined Balances, i.e., the aggregate of the instant bull/bear bias of the three main bar balances.
• In "Six-state Dual Color Gradient" mode, a dot appears on every bar. Its color reflects the bull/bear state of the Combined Balances, and the dot's brightness reflects the tally of balance biases.
• In "Dual Solid Colors (All Bull/All Bear Only)" a dot only appears when all three balances are either bullish or bearish. The resulting pattern is identical to that of Marker 1.
4 — Divergences
• Divergences are displayed as a small circle at the top of the scale. Four different types of divergence events can be detected. Divergences occur whenever the bull/bear bias of the method used diverges with the bar's price direction.
• An option allows you to include in divergence events instances where the count of neutral intrabars exceeds 50% of the total intrabar count.
• The divergence levels are dynamic levels that automatically build from the line's values on divergence events. On consecutive divergences, the levels will expand, creating a channel. This implementation of the divergence levels corresponds to my view that divergences indicate anomalies, hesitations, points of uncertainty if you will. It excludes any association of a pre-determined bullish/bearish bias to divergences. Accordingly, the levels merely take note of divergence events and mark those points in time with levels. Traders then have a reference point from which they can evaluate further movement. The bull/bear/neutral colors used to plot the levels are also congruent with this view in that they are determined by price's position relative to the levels, which is how I think divergences can be put to the most effective use.
5 — Background
• The background can show a bull/bear gradient on four different calculations. You can adjust its brightness to make its visual importance proportional to how you use it in your analysis.
6 — Chart bars
• Chart bars can be colored using five different methods.
• You have the option of emptying the body of bars where volume does not increase, as does my TLD indicator, the idea behind this being that movement on bars where volume does not increase is less relevant.
7 — Intrabar Resolution
You can choose between three modes. Two of them are automatic and one is manual:
a) Fast, Longer history, Auto-Steps (~12 intrabars) : Optimized for speed and deeper history. Uses an average minimum of 12 intrabars.
b) More Precise, Shorter History Auto-Steps (~24 intrabars) : Uses finer intrabar resolution. It is slower and provides less history. Uses an average minimum of 24 intrabars.
c) Fixed : Uses the fixed resolution of your choice.
Auto-Steps calculations vary for 24/7 and conventional markets in order to achieve the proper target of minimum intrabars.
You can choose to view the intrabar resolution currently used to calculate delta volume. It is the default.
The proper selection of the intrabar resolution is important. It must achieve maximal granularity to produce precise results while not unduly slowing down calculations, or worse, causing runtime errors.
8 — Markers
Six markers are available:
1. Combined Balances Agreement : All three Bar Balances are either bullish or bearish.
2. Up or Down % Agrees With Bar : An up marker will appear when the percentage of up intrabars in an up chart bar is greater than the specified percentage. Conditions mirror to down bars.
3. Divergence confirmations By Price : One of the four types of balance calculations can be used to detect divergences with price. Confirmations occur when the bar following the divergence confirms the balance bias. Note that the divergence events used here do not include neutral intrabar events.
4. Balance Transitions : Bull/bear transitions of the selected balance.
5. Markers Bias Transitions : Bull/bear transitions of the Markers Bias.
6. Divergence Confirmations By Line : Marks points where the line first breaches a divergence level.
Markers appear when the condition is detected, without delay. Since nothing is plotted in realtime, markers do not appear on the realtime bar.
9 — Settings
• Two modes can be selected to dampen the line on the ratio of neutral intrabars.
• A distinct weight can be attributed to the count of the latter half of intrabars, on the assumption that later intrabars may be more important in determining the outcome of chart bars.
• Allows control over the periods of the different moving averages used in calculations.
• The default periods used for the various calculations define the following hierarchy from slow to fast:
Balance Averages: 50,
Balance Momentum: 20,
Dual Up/Down Averages: 20,
Marker Bias: 10.
█ LIMITATIONS
• This script uses a special characteristic of the `security()` function allowing the inspection of intrabars—which is not officially supported by TradingView.
• The method used does not work on the realtime bar—only on historical bars.
• The indicator only works on some chart resolutions: 3, 5, 10, 15 and 30 minutes, 1, 2, 4, 6, and 12 hours, 1 day, 1 week and 1 month. The script’s code can be modified to run on other resolutions, but chart resolutions must be divisible by the lower resolution used for intrabars and the stepping mechanism could require adaptation.
• When using the "Line vs Divergence Levels — Dual Color Gradient" color mode to fill the line, background or chart bars, keep in mind that a line calculation mode must be defined for it to work, as it determines gradients on the movement of the line relative to divergence levels. If the line is hidden, it will not work.
• When the difference between the chart’s resolution and the intrabar resolution is too great, runtime errors will occur. The Auto-Steps selection mechanisms should avoid this.
• Alerts do not work reliably when `security()` is used at intrabar resolutions. Accordingly, no alerts are configured in the indicator.
• The color model used in the indicator provides for fancy visuals that come at a price; when you change values in Inputs , it can take 20 seconds for the changes to materialize. Luckily, once your color setup is complete, the color model does not have a large performance impact, as in normal operation the `security()` calls will become the most important factor in determining response time. Also, once in a while a runtime error will occur when you change inputs. Just making another change will usually bring the indicator back up.
█ RAMBLINGS
Is this thing useful?
I'll let you decide. Bar Balance acts somewhat like an X-Ray on bars. The intrabars it analyzes are no secret; one can simply change the chart's resolution to see the same intrabars the indicator uses. What the indicator brings to traders is the precise count of up/down/neutral intrabars and, more importantly, the calculations it derives from them to present the information in a way that can make it easier to use in trading decisions.
How reliable is Bar Balance information?
By the same token that an up bar does not guarantee that more up bars will follow, future price movements cannot be inferred from the mere count of up/down/neutral intrabars. Price movement during any chart bar for which, let's say, 12 intrabars are analyzed, could be due to only one of those intrabars. One can thus easily see how only relying on bar balance information could be very misleading. The rationale behind Bar Balance is that when the information mined for multiple chart bars is aggregated, it can provide insight into the history behind chart bars, and thus some bias as to the strength of movements. An up chart bar where 11/12 intrabars are also up is assumed to be stronger than the same up bar where only 2/12 intrabars are up. This logic is not bulletproof, and sometimes Bar Balance will stray. Also, keep in mind that balance lines do not represent price momentum as RSI would. Bar Balance calculations have no idea where price is. Their perspective, like that of any historian, is very limited, constrained that it is to the narrow universe of up/down/neutral intrabar counts. You will thus see instances where price is moving up while Balance Momentum, for example, is moving down. When Bar Balance performs as intended, this indicates that the rally is weakening, which does necessarily imply that price will reverse. Occasionally, price will merrily continue to advance on weakening strength.
Divergences
Most of the divergence detection methods used here rely on a difference between the bias of a calculation involving a multi-bar average and a given bar's price direction. When using "Bar Balance on Bar" however, only the bar's balance and price movement are used. This is the default mode.
As usual, divergences are points of interest because they reveal imbalances, which may or may not become turning points. I do not share the overwhelming enthusiasm traders have for the purported ability of bullish/bearish divergences to indicate imminent reversals.
Superfluity
In "The Bed of Procrustes", Nassim Nicholas Taleb writes: To bankrupt a fool, give him information . Bar Balance can display lots of information. While learning to use a new indicator inevitably requires an adaptation period where we put it through its paces and try out all its options, once you have become used to Bar Balance and decide to adopt it, rigorously eliminate the components you don't use and configure the remaining ones so their visual prominence reflects their relative importance in your analysis. I tried to provide flexible options for traders to control this indicator's visuals for that exact reason—not for window dressing.
█ NOTES
For traders
• To avoid misleading traders who don't read script descriptions, the indicator shows nothing in the realtime bar.
• The Data Window shows key values for the indicator.
• All gradients used in this indicator determine their brightness intensities using advances/declines in the signal—not their relative position in a fixed scale.
• Note that because of the way gradients are optimized internally, changing their brightness will sometimes require bringing down the value a few steps before you see an impact.
• Because this indicator does not use volume, it will work on all markets.
For coders
• For those interested in gradients, this script uses an advanced version of the Advance/Decline gradient function from the PineCoders Color Gradient (16 colors) Framework . It allows more precise control over the range, steps and min/max values of the gradients.
• I use the PineCoders Coding Conventions for Pine to write my scripts.
• I used functions modified from the PineCoders MTF Selection Framework for the selection of timeframes.
█ THANKS TO:
— alexgrover who helped me think through the dampening method used to attenuate signal lines on high ratios of neutral intrabars.
— A guy called Kuan who commented on a Backtest Rookies presentation of their Volume Profile indicator . The technique I use to inspect intrabars is derived from Kuan's code.
— theheirophant , my partner in the exploration of the sometimes weird abysses of `security()`’s behavior at intrabar resolutions.
— midtownsk8rguy , my brilliant companion in mining the depths of Pine graphics. He is also the co-author of the PineCoders Color Gradient Frameworks .

Dskyz (DAFE) MAtrix with ATR-Powered Precision Dskyz (DAFE) MAtrix with ATR-Powered Precision
This cutting‐edge futures trading strategy built to thrive in rapidly changing market conditions. Developed for high-frequency futures trading on instruments such as the CME Mini MNQ, this strategy leverages a matrix of sophisticated moving averages combined with ATR-based filters to pinpoint high-probability entries and exits. Its unique combination of adaptable technical indicators and multi-timeframe trend filtering sets it apart from standard strategies, providing enhanced precision and dynamic responsiveness.
imgur.com
Core Functional Components
1. Advanced Moving Averages
A distinguishing feature of the DAFE strategy is its robust, multi-choice moving averages (MAs). Clients can choose from a wide array of MAs—each with specific strengths—in order to fine-tune their trading signals. The code includes user-defined functions for the following MAs:
imgur.com
Hull Moving Average (HMA):
The hma(src, len) function calculates the HMA by using weighted moving averages (WMAs) to reduce lag considerably while smoothing price data. This function computes an intermediate WMA of half the specified length, then a full-length WMA, and finally applies a further WMA over the square root of the length. This design allows for rapid adaptation to price changes without the typical delays of traditional moving averages.
Triple Exponential Moving Average (TEMA):
Implemented via tema(src, len), TEMA uses three consecutive exponential moving averages (EMAs) to effectively cancel out lag and capture price momentum. The final formula—3 * (ema1 - ema2) + ema3—produces a highly responsive indicator that filters out short-term noise.
Double Exponential Moving Average (DEMA):
Through the dema(src, len) function, DEMA calculates an EMA and then a second EMA on top of it. Its simplified formula of 2 * ema1 - ema2 provides a smoother curve than a single EMA while maintaining enhanced responsiveness.
Volume Weighted Moving Average (VWMA):
With vwma(src, len), this MA accounts for trading volume by weighting the price, thereby offering a more contextual picture of market activity. This is crucial when volume spikes indicate significant moves.
Zero Lag EMA (ZLEMA):
The zlema(src, len) function applies a correction to reduce the inherent lag found in EMAs. By subtracting a calculated lag (based on half the moving average window), ZLEMA is exceptionally attuned to recent price movements.
Arnaud Legoux Moving Average (ALMA):
The alma(src, len, offset, sigma) function introduces ALMA—a type of moving average designed to be less affected by outliers. With parameters for offset and sigma, it allows customization of the degree to which the MA reacts to market noise.
Kaufman Adaptive Moving Average (KAMA):
The custom kama(src, len) function is noteworthy for its adaptive nature. It computes an efficiency ratio by comparing price change against volatility, then dynamically adjusts its smoothing constant. This results in an MA that quickly responds during trending periods while remaining smoothed during consolidation.
Each of these functions—integrated into the strategy—is selectable by the trader (via the fastMAType and slowMAType inputs). This flexibility permits the tailored application of the MA most suited to current market dynamics and individual risk management preferences.
2. ATR-Based Filters and Risk Controls
ATR Calculation and Volatility Filter:
The strategy computes the Average True Range (ATR) over a user-defined period (atrPeriod). ATR is then used to derive both:
Volatility Assessment: Expressed as a ratio of ATR to closing price, ensuring that trades are taken only when volatility remains within a safe, predefined threshold (volatilityThreshold).
ATR-Based Entry Filters: Implemented as atrFilterLong and atrFilterShort, these conditions ensure that for long entries the price is sufficiently above the slow MA and vice versa for shorts. This acts as an additional confirmation filter.
Dynamic Exit Management:
The exit logic employs a dual approach:
Fixed Stop and Profit Target: Stops and targets are set at multiples of ATR (fixedStopMultiplier and profitTargetATRMult), helping manage risk in volatile markets.
Trailing Stop Adjustments: A trailing stop is calculated using the ATR multiplied by a user-defined offset (trailOffset), which captures additional profits as the trade moves favorably while protecting against reversals.
3. Multi-Timeframe Trend Filtering
The strategy enhances its signal reliability by leveraging a secondary, higher timeframe analysis:
15-Minute Trend Analysis:
By retrieving 15-minute moving averages (fastMA15m and slowMA15m) via request.security, the strategy determines the broader market trend. This secondary filter (enabled or disabled through useTrendFilter) ensures that entries are aligned with the prevailing market direction, thereby reducing the incidence of false signals.
4. Signal and Execution Logic
Combined MA Alignment:
The entry conditions are based primarily on the alignment of the fast and slow MAs. A long condition is triggered when the current price is above both MAs and the fast MA is above the slow MA—complemented by the ATR filter and volume conditions. The reverse applies for a short condition.
Volume and Time Window Validation:
Trades are permitted only if the current volume exceeds a minimum (minVolume) and the current hour falls within the predefined trading window (tradingStartHour to tradingEndHour). An additional volume spike check (comparing current volume to a moving average of past volumes) further filters for optimal market conditions.
Comprehensive Order Execution:
The strategy utilizes flexible order execution functions that allow pyramiding (up to 10 positions), ensuring that it can scale into positions as favorable conditions persist. The use of both market entries and automated exits (with profit targets, stop-losses, and trailing stops) ensures that risk is managed at every step.
5. Integrated Dashboard and Metrics
For transparency and real-time analysis, the strategy includes:
On-Chart Visualizations:
Both fast and slow MAs are plotted on the chart, making it easy to see the market’s technical foundation.
Dynamic Metrics Dashboard:
A built-in table displays crucial performance statistics—including current profit/loss, equity, ATR (both raw and as a percentage), and the percentage gap between the moving averages. These metrics offer immediate insight into the health and performance of the strategy.
Input Parameters: Detailed Breakdown
Every input is meticulously designed to offer granular control:
Fast & Slow Lengths:
Determine the window size for the fast and slow moving averages. Smaller values yield more sensitivity, while larger values provide a smoother, delayed response.
Fast/Slow MA Types:
Choose the type of moving average for fast and slow signals. The versatility—from basic SMA and EMA to more complex ones like HMA, TEMA, ZLEMA, ALMA, and KAMA—allows customization to fit different market scenarios.
ATR Parameters:
atrPeriod and atrMultiplier shape the volatility assessment, directly affecting entry filters and risk management through stop-loss and profit target levels.
Trend and Volume Filters:
Inputs such as useTrendFilter, minVolume, and the volume spike condition help confirm that a trade occurs in active, trending markets rather than during periods of low liquidity or market noise.
Trading Hours:
Restricting trade execution to specific hours (tradingStartHour and tradingEndHour) helps avoid illiquid or choppy markets outside of prime trading sessions.
Exit Strategies:
Parameters like trailOffset, profitTargetATRMult, and fixedStopMultiplier provide multiple layers of risk management and profit protection by tailoring how exits are generated relative to current market conditions.
Pyramiding and Fixed Trade Quantity:
The strategy supports multiple entries within a trend (up to 10 positions) and sets a predefined trade quantity (fixedQuantity) to maintain consistent exposure and risk per trade.
Dashboard Controls:
The resetDashboard input allows for on-the-fly resetting of performance metrics, keeping the strategy’s performance dashboard accurate and up-to-date.
Why This Strategy is Truly Exceptional
Multi-Faceted Adaptability:
The ability to switch seamlessly between various moving average types—each suited to particular market conditions—enables the strategy to adapt dynamically. This is a testament to the high level of coding sophistication and market insight infused within the system.
Robust Risk Management:
The integration of ATR-based stops, profit targets, and trailing stops ensures that every trade is executed with well-defined risk parameters. The system is designed to mitigate unexpected market swings while optimizing profit capture.
Comprehensive Market Filtering:
By combining moving average crossovers with volume analysis, volatility thresholds, and multi-timeframe trend filters, the strategy only enters trades under the most favorable conditions. This multi-layered filtering reduces noise and enhances signal quality.
-Final Thoughts-
The Dskyz Adaptive Futures Elite (DAFE) MAtrix with ATR-Powered Precision strategy is not just another trading algorithm—it is a multi-dimensional, fully customizable system built on advanced technical principles and sophisticated risk management techniques. Every function and input parameter has been carefully engineered to provide traders with a system that is both powerful and transparent.
For clients seeking a state-of-the-art trading solution that adapts dynamically to market conditions while maintaining strict discipline in risk management, this strategy truly stands in a class of its own.
****Please show support if you enjoyed this strategy. I'll have more coming out in the near future!!
-Dskyz
Caution
DAFE is experimental, not a profit guarantee. Futures trading risks significant losses due to leverage. Backtest, simulate, and monitor actively before live use. All trading decisions are your responsibility.

[blackcat] L1 Banker Move█ OVERVIEW
The Pine Script is an indicator designed to analyze market signals for institutional and short-term investors. It calculates and plots three main signals: Institutional Signal, Institutional Build, and Short-Term Investor Signal. The script uses a combination of price, volume, and moving average data to generate these signals, which can help traders identify potential buying or selling opportunities.
█ LOGICAL FRAMEWORK
The script is structured into several main sections:
1 — Input Parameters
The script does not explicitly define any input parameters, relying on default values for calculations.
2 — Custom Functions
• reference_value(values, length) : Retrieves the first non-NA value from a specified number of past values.
• calculate_institutional_and_short_term_signals(low, close, open, volume) : Calculates the institutional and short-term investor signals based on price, volume, and moving average data.
3 — Calculations
• Price and Volume Metrics: The script calculates various smoothed price changes, lowest and highest values over different periods, and volume-weighted prices.
• Moving Averages: It computes simple moving averages (SMA) and exponential moving averages (EMA) for different periods.
• RSI Calculation: The script calculates a custom RSI for different periods.
• Signal Generation: It generates the institutional and short-term investor signals based on the calculated metrics.
4 — Plotting
The script plots the three main signals on the chart using the plot function.
The flow of data and logic is as follows:
• The reference_value function is used to find reference values for calculations.
• The calculate_institutional_and_short_term_signals function performs the core calculations and returns the institutional and short-term investor signals.
• The main script calls this function and plots the results.
█ CUSTOM FUNCTIONS
1 — reference_value(values, length)
• Purpose : Retrieves the first non-NA value from a specified number of past values.
• Parameters :
• values: An array of values.
• length: The number of past values to consider.
• Return Value : The first non-NA value found or na if no valid value is found.
• Functionality : Iterates through the specified number of past values and returns the first non-NA value.
2 — calculate_institutional_and_short_term_signals(low, close, open, volume)
• Purpose : Calculates the institutional and short-term investor signals based on price, volume, and moving average data.
• Parameters :
• low: Low price series.
• close: Close price series.
• open: Open price series.
• volume: Volume series.
• Return Values :
• institutional_signal: The institutional signal.
• institutional_build: The institutional build signal.
• short_term_investor_signal: The short-term investor signal.
• Functionality :
• Computes various price and volume metrics.
• Calculates moving averages and volume-weighted prices.
• Generates the institutional and short-term investor signals based on these metrics.
█ KEY POINTS AND TECHNIQUES
1 — Advanced Pine Script Features
• Custom Functions: The script defines and uses custom functions to encapsulate complex logic.
• Conditional Statements: Extensive use of iff and if statements to control the flow of calculations.
• Looping Constructs: The for loop in reference_value function to iterate through past values.
• Exponential Moving Averages (EMA): Used to smooth out price and signal changes.
• Volume-Weighted Price (VWP): Calculated to factor in volume in price analysis.
• Custom RSI Calculation: A custom RSI formula is used, which differs from the standard RSI calculation.
2 — Optimization Techniques
• Efficient Data Handling: The reference_value function efficiently finds the first non-NA value without unnecessary computations.
• Smoothed Signals: Using EMAs to smooth out noisy signals for better trend identification.
3 — Unique Approaches
• Combination of Metrics: The script combines multiple metrics (price, volume, moving averages, and custom RSI) to generate comprehensive signals.
• Institutional Build Signal: A unique approach to detect institutional activity by comparing current price levels with historical lows and smoothed price changes.
█ EXTENDED KNOWLEDGE AND APPLICATIONS
1 — Potential Modifications
• Input Parameters: Add input parameters to allow users to customize the lengths and thresholds used in the calculations.
• Strategy Version: Convert the indicator into a strategy by adding buy/sell signals based on the generated signals.
• Additional Indicators: Integrate other technical indicators (e.g., MACD, Bollinger Bands) to enhance the signal generation process.
2 — Similar Trading Scenarios
• Institutional Activity Analysis: Use similar techniques to analyze institutional activity in other markets or assets.
• Volume Analysis: Apply the volume-weighted price and volume analysis to identify significant price movements.
• Multi-Timeframe Analysis: Extend the script to analyze signals across multiple timeframes for a more robust trading strategy.
3 — Related Pine Script Concepts
• Pine Script Functions: Understanding how to define and use custom functions effectively.
• Conditional Logic: Mastering the use of iff and if statements for complex logic.
• Looping Constructs: Familiarity with for loops for iterating through data.
• Moving Averages: Knowledge of different types of moving averages and their applications.
• Volume Analysis: Techniques for incorporating volume data into price analysis.

RSI Difference (Fast and Slow)Introduction
Oscillators like the RSI are fundamental tools for identifying trends in financial markets. Their ability to measure price momentum allows traders to detect overbought, oversold levels, and divergences, anticipating trend changes. Are there ways to improve the use of traditional RSI? How can we obtain more detailed information about current trends? This indicator answers these questions by expanding the functionalities of the traditional RSI and offering an additional tool for analysis.
How does it work?
This indicator provides a framework for trend analysis based on the following setup:
Fast RSI
Slow RSI
SMA of the fast RSI
SMA of the slow RSI
Histogram
Custom Indicator Settings
My preferred configuration is based on the 13 and 55 moving averages. The rest of the setup is as follows:
I typically use the 13 and 55 moving averages to configure both the RSI and short- and long-term moving averages.
Interpretation and Signals: Including a Long-Period RSI
Including a long-period RSI helps identify key patterns in market behavior. Crossovers between the two can be used to establish entry patterns:
If the fast RSI crosses above the slow RSI, this could indicate a long-entry pattern.
If the fast RSI crosses below the slow RSI, this could indicate a short-entry pattern.
Interpretation and Signals: Including Moving Averages
Including moving averages for both the short- and long-period RSI can help identify the base trend of the movement and, consequently:
Avoid false signals.
Trade in favor of the trend.
A simple way to start working with these is to use the crossover of the moving averages to identify the current trend:
If the short-period SMA is above the long-period SMA, the trend is bullish.
If the short-period SMA is below the long-period SMA, the trend is bearish.
Interpretation and Signals: The Histogram
The histogram represents the difference between the moving averages. If the histogram is positive, the short average is above the long average. If the histogram is below zero, the short average is below the long average. Divergences with price provide signals of potential exhaustion in the movement, indicating a possible reversal.
Indicator Details
This indicator builds upon the traditional RSI by integrating additional features that enhance its utility for traders. Here’s how each component is calculated and how they contribute to the originality of the script:
Fast RSI and Slow RSI: The fast RSI is calculated using a shorter lookback period, allowing it to capture rapid changes in momentum. The slow RSI uses a longer period to smooth out fluctuations and provide a broader view of the trend. These two RSIs work together to identify significant momentum shifts.
SMA of RSI values: The simple moving averages (SMA) of the fast and slow RSI help filter out noise and provide clear crossover signals. The SMAs are calculated using standard formulas but applied to the RSI values rather than price data, which adds a layer of insight into momentum trends.
Histogram calculation: The histogram represents the difference between the SMA of the fast RSI and the SMA of the slow RSI. This value gives a visual representation of the convergence or divergence of momentum. When the histogram crosses zero, it signifies a potential shift in the underlying trend.
This indicator combines multiple layers of analysis: fast and slow momentum, trend confirmation through SMAs, and divergence detection via the histogram. This multi-dimensional approach provides traders with a more comprehensive tool for trend analysis and decision-making.
Conclusion
This article has explored how to use this indicator to identify trends, leverage entry patterns, and analyze divergences by combining the fast RSI, slow RSI, their moving averages, and a histogram. Additionally, I’ve detailed how I usually interpret this indicator:
Identifying RSI patterns to anticipate momentum changes.
Using SMAs to confirm base trends.
Leveraging the histogram to detect divergences and potential price reversals.
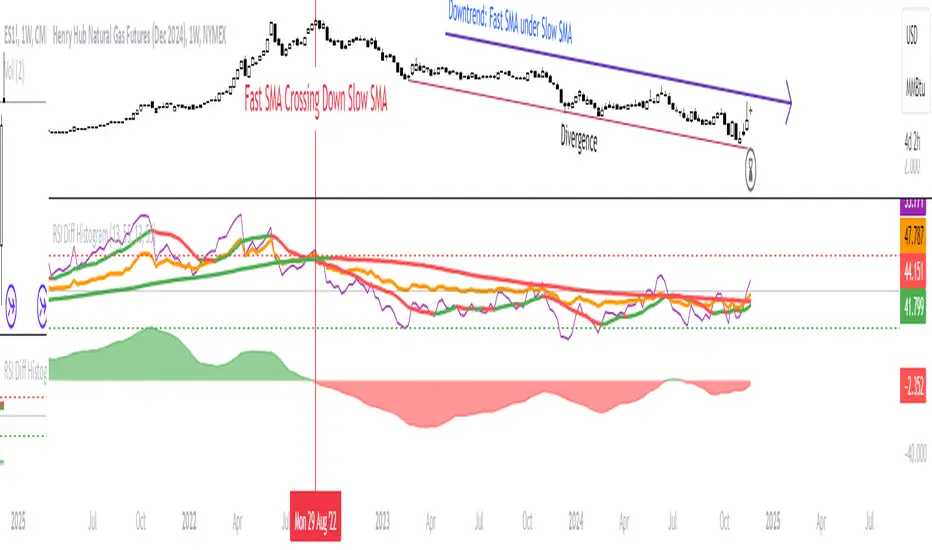
TOMMAR#TOMMAR #MultiMovingAverages #MMAR
Dear fellow traders, this is Tommy, and today I'd like to introduce you to the Multi-Moving Averages Ribbon (MMAR) indicator, which I believe to be one of the best MMAR indicators available on TradingView. Moving Averages is a popular technical analysis tool used to smooth out price data by creating an average of past price data points over a specified time period. They can be used to identify trends and provide a clearer view of price action, as well as generate buy and sell signals by observing crossovers between different moving average lines.
In the MMAR indicator, we have incorporated 12 different types of Moving Averages, including Simple Moving Averages (SMA), Exponential Moving Averages (EMA), Weighted Moving Averages (WMA), Hull Moving Averages (HMA), and Smoothed Moving Averages (SMMA), among others. This allows traders to choose the optimal type for their preferred trading commodities.
One common technique in technical analysis is using multiple Moving Averages with varying lengths, which provides a more comprehensive view of price action. By analyzing multiple Moving Averages with different timeframes, traders can better understand both short- and long-term trends and make more informed trading decisions. Some of the well-known combinations of multiple moving averages used by traders are (5, 9, 14, 21, 45), (6, 11, 16, 22, 51), [8, 13, 21, 55), (50, 100, 200), and (60, 120, 240).
Another way to gauge the strength of the market trend is to look for the arrangement of the Moving Averages. If they are in a sequential order, with the shortest on top and the longest on the bottom, it is most likely a bullish trend. On the other hand, if they are arranged in reverse order, with the shortest on the bottom and the longest on top, it is most likely a bearish trend. The 'Trend Light' in the indicator settings will automatically signal when the Moving Averages are in either an orderly or reverse arrangement.
Lastly, I have added a useful feature to the indicator: the 'MA Projection'. This feature projects and forecasts the Moving Averages in the future, allowing traders to easily identify confluence zones in future candlesticks. Please note that the projection levels may change in the case of extreme price action that significantly affects the Moving Averages.
This is free so any Tradingview users can use this indicator. Just search TOMMAR in the indicator section located on top of the chart.
#TOMMAR #MultiMovingAverages #MMAR
안녕하세요 트레이더 여러분, 토미입니다. 오늘 여러분들에게 소개드릴 지표는 다양한 길이의 이동평균선 조합을 사용할 수 있는 MMAR (Multiple Moving Averages Ribbon)입니다. 아마 제가 만든 MMAR 지표가 트레이딩뷰에서 가장 쓸만할 겁니다. 이동평균선, 줄여서 이평선은 말 그대로 특정 기간 범위 내의 주가들을 평균한 값들로 이루어진 선입니다. 제가 이평선 관련된 강의 자료는 예전에 올려드린 바 있으니 더 자세한 내용이 궁금하신 분들은 아래 링크/이미지 클릭하시길 바랍니다.
본 지표는 Simple Moving Averages (SMA), Exponential Moving Averages (EMA), Weighted Moving Averages (WMA), Hull Moving Averages (HMA), 그리고 Smoothed Moving Averages (SMMA) 등을 포함해 총 12개 종류의 이평선 지표를 사용할 수 있습니다. 또한 각 이평선의 길이들도 하나하나 일일이 설정하실 수 있습니다. 예를 들어 요즘에 자주 보이는 이평선들의 조합이 , , , , 그리고 등등이 존재하는데 여러분의 취향에 맞게 설정하여 사용하시면 됩니다.
몇 가지 주요 기능에 대해서 설명 드리겠습니다. 설정에서 ‘Trend Light’를 키면 이평선들의 정배열 혹은 역배열 여부를 쉽게 볼 수 있습니다. 이평선이 정배열일때는 맨 아래의 이평선에 초록불이, 역배열일때는 맨 위의 이평선에 빨간불이 켜지며 둘 다 아닐 땐 아무 불도 켜지지 않습니다. 또한 ‘MA Projection’을 키면 이평선들의 미래 예측 값들을 확장해줍니다. 당연히 가격 변동이 갑자기 크게 나오면 이평선 예측 확장 레벨들이 확 바뀌겠죠.
지표창에 TOMMAR 검색하시거나 아래 즐겨찾기 인디케이터에 넣기 클릭하시면 누구나 사용하실 수 있습니다~ 여러분의 구독, 좋아요, 댓글은 저에게 큰 힘이 됩니다.

Uptrick: Zero Lag HMA Trend Suite1. Name and Purpose
Uptrick: Zero Lag HMA Trend Suite is a Pine Version 6 script that builds upon the Hull Moving Average (HMA) to offer an advanced trend analysis tool. Its purpose is to help traders identify trend direction, potential reversals, and overall market momentum with reduced lag compared to traditional moving averages. By combining the HMA with Average True Range (ATR) thresholds, slope-dependent coloring, Volume Weighted Average Price (VWAP) ribbons, and optional reversal signals, the script aims to give a detailed view of price activity in various market environments.
2. Overview
This script begins with the calculation of a Hull Moving Average, a method that blends Weighted Moving Averages in a way designed to cut down on lag while still smoothing out price fluctuations. Next, several enhancements are applied. The script compares current HMA values to previous ones for slope-based coloring, which highlights uptrends and downtrends at a glance. It also plots buy and sell signals when price moves beyond or below thresholds determined by the ATR and the user’s chosen signal multiplier. An optional VWAP ribbon can be shown to confirm bullish or bearish conditions relative to a volume-weighted benchmark. Additionally, the script can plot reversal signals (labeled with B) at points where price crosses back toward the HMA from above or below. Taken together, these elements allow traders to visualize both the short-term momentum and the broader context of how price interacts with volatility and overall market direction.
3. Why These Indicators Have Been Linked Together
The reason the Hull Moving Average, the Average True Range, and the VWAP have been integrated into one script is to tackle multiple facets of market analysis in a single tool. The Zero Lag Hull Moving Average provides a responsive trend line, the ATR offers a measure of volatility that helps distinguish significant price shifts from typical fluctuations, and the VWAP acts as a reference for fair value based on traded volume. By layering all three, the script helps traders avoid the need to juggle multiple separate indicators and offers a holistic perspective. The slope-based coloring focuses on trend direction, the ATR-based thresholds refine possible buy and sell zones, and the VWAP ribbons provide insight into how price stands relative to an important volume-weighted level. The inclusion of up and down signals and reversal B labels further refines entries and exits.
4. Why Use Uptrick: Zero Lag HMA Trend Suite
The Hull Moving Average is already known for reacting more quickly to price changes compared to other moving averages while retaining a degree of smoothness. This suite enhances the basic HMA by showing colored gradients that make it easy to spot trend direction changes, highlighting potential entry or exit points based on volatility-driven thresholds, and optionally layering a volume-based measure of bullish or bearish market sentiment. By relying on a zero lag approach and additional data points, the script caters to those wanting a more responsive method of identifying shifts in market dynamics. The added reversal signals and up or down alerts give traders extra confirmation for potential turning points.
5. How This Extension Improves on the Basic HMA
This extension not only plots the Hull Moving Average but also includes data-driven alerts and visual cues that traditional HMA lines do not provide. First, it offers multi-layered slope coloring, making up or down trends quickly apparent. Second, it uses ATR-based thresholds to pinpoint moments when price may be extending beyond normal volatility, thus generating buy or sell signals. Third, the script introduces an optional VWAP ribbon to indicate whether the market is trading above or below this pivotal volume-weighted benchmark, adding a further confirmation step for bullish or bearish conditions. Finally, it incorporates optional reversal signals labeled with B, indicating points where price might swing back toward the main HMA line.
6. Core Components
The script can be broken down into several primary functions and features.
a. Zero Lag HMA Calculation
Uses two Weighted Moving Averages (half-length and full-length) combined through a smoothing step based on the square root of the chosen length. This approach is designed to reduce lag significantly compared to other moving averages.
b. Slope Detection
Compares current and prior HMA values to determine if the trend is up or down. The slope-based coloring changes between turquoise shades for upward movement and magenta shades for downward movement, making trend direction immediately visible.
c. ATR-Based Thresholding for Up and Down Signals
The script calculates an Average True Range over a user-defined period, then multiplies it by a signal factor to form two bands around the HMA. When price crosses below the lower band, an up (buy) signal appears; when it crosses above the upper band, a down (sell) signal is shown.
d. Reversal Signals (B Labels)
Tracks when price transitions back toward the main HMA from an extreme zone. When enabled, these reversal points are labeled with a B and can help traders see potential turning points or mean-reversion setups.
e. VWAP Bands
An optional Volume Weighted Average Price ribbon that plots above or below the HMA, indicating bullish or bearish conditions relative to a volume-weighted price benchmark. This can also act as a kind of support/ resistance.
7. User Inputs
a. HMA Length
Controls how quickly the moving average responds to price changes. Shorter lengths react faster but can lead to more frequent signals, whereas longer lengths produce smoother lines.
b. Source
Specifies the price input, such as close or an alternative source, for the calculation. This can help align the HMA with specific trading strategies.
c. ATR Length and Signal Multiplier
Defines how the script calculates average volatility and sets thresholds for buy or sell alerts. Adjusting these values can help filter out noise or highlight more aggressive signals.
d. Slope Index
Determines how many bars to look back for detecting slope direction, influencing how sensitive the slope coloring is to small fluctuations.
e. Show Buy and Sell Signals, Reversal Signals, and VWAP
Lets users toggle the display of these features. Turning off certain elements can reduce chart clutter if traders prefer a simpler layout.
8. Calculation Process
The script’s calculation follows a step-by-step approach. It first computes two Weighted Moving Averages of the selected price source, one over half the specified length and one over the full length. It then combines these using 2*wma1 minus wma2 to reduce lag, followed by applying another weighted average using the square root of the length. Simultaneously, it computes the ATR for a user-defined period. By multiplying ATR by the signal multiplier, it establishes upper and lower bands around the HMA, where crossovers generate buy (up) or sell (down) signals. The script can also plot reversal signals (B labels) when price crosses back from these bands in the opposite direction. For the optional VWAP feature, Pine Script’s ta.vwap function is used, and differences between the HMA and VWAP levels determine the color and opacity of the ribbon.
9. Signal Generation and Filtering
The ATR-based thresholds reduce the influence of small, inconsequential price swings. When price falls below the lower band, the script issues an up (buy) signal. If price breaks above the upper band, a down (sell) signal appears. These signals are visible through labels placed near the bars. Reversal signals, labeled with B, can be turned on to help detect when price retraces from an extended area back toward the main HMA line. Traders can disable or enable these signals to match their preferred level of chart detail or risk tolerance.
10. Visualization on the Chart
The Zero HMA Lag Trend Suite aims for visual clarity. The HMA line is plotted multiple times with increasing transparency to create a gradient effect. Turquoise gradients indicate upward slopes, and magenta gradients signify downward slopes. Bar coloring can be configured to align with the slope direction, providing quick insight into current momentum. When enabled, buy or sell labels are placed under or above the bars as price crosses the ATR-defined boundaries. If the reversal option is active, B labels appear around areas where price changes direction. The optional VWAP ribbons form background bands, using distinct coloration to signal whether price is above or below the volume-weighted metric.
11. Market Adaptability
Because the script’s parameters (HMA length, ATR length, signal multiplier, and slope index) are user-configurable, it can adapt to a wide range of markets and timeframes. Intraday traders may prefer a shorter HMA length for quick signals, while swing or position traders might use a longer HMA length to filter out short-lived price changes. The source setting can also be adjusted, allowing for specialized data inputs beyond just close or open values.
12. Risk Management Considerations
The script’s signals and labels are based on past price data and volatility readings, and they do not guarantee profitable outcomes. Sharp market reversals or unforeseen fundamental events can produce false signals. Traders should combine this tool with broader risk management strategies, including stop-loss placement, position sizing, and independent market analyses. The Zero HMA Lag Trend Suite can help highlight potential opportunities, but it should not be relied upon as the sole basis for trade decisions.
13. Combining with Other Tools
Many traders choose to verify signals from the Zero HMA Lag Trend Suite using popular indicators like the Relative Strength Index (RSI), Moving Average Convergence Divergence (MACD), or even simple volume-based metrics to confirm whether a price movement has sufficient momentum. Conventional techniques such as support and resistance levels, chart patterns, or candlestick analysis can also supplement signals generated by the script’s up, down, or reversal B labels.
14. Parameter Customization and Examples
a. Short-Term Day Trading
Using a shorter HMA length (for instance, 9 or 14) and a slightly higher ATR multiplier might provide timely buy and sell signals, though it may also produce more whipsaws in choppy markets.
b. Swing or Position Trading
Selecting a longer HMA length (such as 50 or 100) with a moderate ATR multiplier can help users track more significant and sustained market moves, potentially reducing the effect of minor fluctuations.
c. Multiple Timeframe Blends
Some traders load two versions of the indicator on the same chart, one for short-term signals (with frequent B label reversals) and another for the broader trend direction, aligning entry and exit decisions with the bigger picture.
15. Realistic Expectations
Even though the Hull Moving Average helps minimize lag and the script incorporates volatility-based filters and optional VWAP overlays, it cannot predict future market behavior with complete accuracy. Periods of low liquidity or sudden market shocks can still lead to signals that do not reflect longer-term trends. Frequent parameter review and manual confirmation are advised before executing trades based solely on the script’s outputs.
16. Theoretical Background
The Hull Moving Average formula aims to balance smoothness with reactivity, accomplished by combining Weighted Moving Averages at varying lengths. By subtracting a slower average from a faster one and then applying another smoothing step with the square root of the original length, the HMA is designed to respond more promptly to price changes than typical exponential or simple moving averages. The ATR component, introduced by J. Welles Wilder, calculates the average range of price movement over a user-defined period, allowing the script to assess volatility and adapt signals accordingly. VWAP provides a volume-weighted benchmark that many institutional traders track to gauge fair intraday value.
17. Originality and Uniqueness
Although multiple HMA-based indicators can be found, Uptrick: Zero Lag HMA Trend Suite sets itself apart by merging slope-based coloring, ATR thresholds, VWAP ribbons, up or down labels, and optional reversal signals all in one cohesive platform. This synergy aims to reduce chart clutter while still giving traders a comprehensive look at trend direction, volatility, and volume-based sentiment.
18. Summary
Uptrick: Zero Lag HMA Trend Suite is a specialized trading script designed to highlight potential market trends and reversals with minimal delay. It leverages the Hull Moving Average for an adaptive yet smooth price line, pairs ATR-based thresholds for detecting possible breakouts or dips, and provides VWAP-based ribbons for added volume-weighted context. Traders can further refine their entries and exits by enabling up or down signals and reversal labels (B) where price may revert toward the HMA. Suitable for a wide range of timeframes and instrument types, the script encourages a disciplined approach to trade management and risk control.
19. Disclaimer
This script is provided for informational and educational purposes only. Trading and investing involve significant financial risk, and no indicator can guarantee success under all conditions. Users should practice robust risk management, including the placement of stop losses and position sizing, and should confirm signals with additional analysis tools. The developer of this script assumes no liability for any trading decisions or outcomes resulting from its use.

Enhanced Market Analyzer with Adaptive Cognitive LearningThe "Enhanced Market Analyzer with Advanced Features and Adaptive Cognitive Learning" is an advanced, multi-dimensional trading indicator that leverages sophisticated algorithms to analyze market trends and generate predictive trading signals. This indicator is designed to merge traditional technical analysis with modern machine learning techniques, incorporating features such as adaptive learning, Monte Carlo simulations, and probabilistic modeling. It is ideal for traders who seek deeper market insights, adaptive strategies, and reliable buy/sell signals.
Key Features:
Adaptive Cognitive Learning:
Utilizes Monte Carlo simulations, reinforcement learning, and memory feedback to adapt to changing market conditions.
Adjusts the weighting and learning rate of signals dynamically to optimize predictions based on historical and real-time data.
Hybrid Technical Indicators:
Custom RSI Calculation: An RSI that adapts its length based on recursive learning and error adjustments, making it responsive to varying market conditions.
VIDYA with CMO Smoothing: An advanced moving average that incorporates Chander Momentum Oscillator for adaptive smoothing.
Hamming Windowed VWMA: A volume-weighted moving average that applies a Hamming window for smoother calculations.
FRAMA: A fractal adaptive moving average that responds dynamically to price movements.
Advanced Statistical Analysis:
Skewness and Kurtosis: Provides insights into the distribution and potential risk of market trends.
Z-Score Calculations: Identifies extreme market conditions and adjusts trading thresholds dynamically.
Probabilistic Monte Carlo Simulation:
Runs thousands of simulations to assess potential price movements based on momentum, volatility, and volume factors.
Integrates the results into a probabilistic signal that informs trading decisions.
Feature Extraction:
Calculates a variety of market metrics, including price change, momentum, volatility, volume change, and ATR.
Normalizes and adapts these features for use in machine learning algorithms, enhancing signal accuracy.
Ensemble Learning:
Combines signals from different technical indicators, such as RSI, MACD, Bollinger Bands, Stochastic Oscillator, and statistical features.
Weights each signal based on cumulative performance and learning feedback to create a robust ensemble signal.
Recursive Memory and Feedback:
Stores and averages past RSI calculations in a memory array to provide historical context and improve future predictions.
Adaptive memory factor adjusts the influence of past data based on current market conditions.
Multi-Factor Dynamic Length Calculation:
Determines the length of moving averages based on volume, volatility, momentum, and rate of change (ROC).
Adapts to various market conditions, ensuring that the indicator is responsive to both high and low volatility environments.
Adaptive Learning Rate:
The learning rate can be adjusted based on market volatility, allowing the system to adapt its speed of learning and sensitivity to changes.
Enhances the system's ability to react to different market regimes.
Monte Carlo Simulation Engine:
Simulates thousands of random outcomes to model potential future price movements.
Weights and aggregates these simulations to produce a final probabilistic signal, providing a comprehensive risk assessment.
RSI with Dynamic Adjustments:
The initial RSI length is adjusted recursively based on calculated errors between true RSI and predicted RSI.
The adaptive RSI calculation ensures that the indicator remains effective across various market phases.
Hybrid Moving Averages:
Short-Term and Long-Term Averages: Combines FRAMA, VIDYA, and Hamming VWMA with specific weights for a unique hybrid moving average.
Weighted Gradient: Applies a color gradient to indicate trend strength and direction, improving visual clarity.
Signal Generation:
Generates buy and sell signals based on the ensemble model and multi-factor analysis.
Uses percentile-based thresholds to determine overbought and oversold conditions, factoring in historical data for context.
Optional settings to enable adaptation to volume and volatility, ensuring the indicator remains effective under different market conditions.
Monte Carlo and Learning Parameters:
Users can customize the number of Monte Carlo simulations, learning rate, memory factor, and reward decay for tailored performance.
Applications:
Scalping and Day Trading:
The fast response of the adaptive RSI and ensemble learning model makes this indicator suitable for short-term trading strategies.
Swing Trading:
The combination of long-term moving averages and probabilistic models provides reliable signals for medium-term trends.
Volatility Analysis:
The ATR, Bollinger Bands, and adaptive moving averages offer insights into market volatility, helping traders adjust their strategies accordingly.
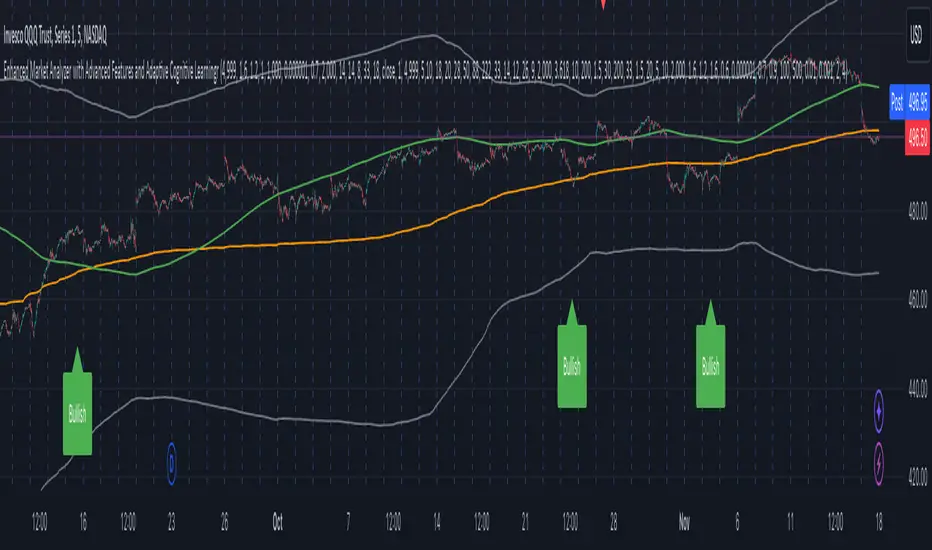
Bull Bear Power With EMA FilterDescription of Indicator:
This Pine Script indicator colors price bars based on the open price in relation to custom moving averages (EMA/SMA), Bull/Bear Power (BBPower), and an optional VWAP filter. The bar colors help identify bullish and bearish conditions with added visual cues for price positioning relative to VWAP.
Key Features:
Customizable Moving Averages (EMA/SMA):
The user can select between EMA or SMA for both short-term and long-term moving averages.
Default moving averages are set to 5 (short-term) and 9 (long-term) but can be adjusted by the user.
Bullish Condition (Blue or Purple Bars):
A bar is colored blue if the following conditions are met:
The open price is above both the short-term and long-term moving averages.
The short-term moving average (MA 1) is above the long-term moving average (MA 2).
BBPower (open price minus the 13-period EMA) is positive, indicating bullish strength.
If the VWAP filter is enabled and the price opens below VWAP, the bullish bars will turn purple.
Bearish Condition (Yellow or Orange Bars):
A bar is colored yellow if the following conditions are met:
The open price is below both the short-term and long-term moving averages.
The short-term moving average (MA 1) is below the long-term moving average (MA 2).
BBPower is negative or zero, indicating bearish market conditions.
If the VWAP filter is enabled and the price opens above VWAP, the bearish bars will turn orange.
VWAP Filter (Optional):
An optional filter allows the user to add VWAP (Volume-Weighted Average Price) to the bar coloring logic.
When the VWAP filter is enabled, it provides additional information about price positioning relative to VWAP, turning bullish bars purple and bearish bars orange depending on whether the price opens above or below VWAP.
Usage:
Bullish Trend: Look for blue or purple bars to identify potential bullish momentum.
Bearish Trend: Look for yellow or orange bars to spot bearish conditions in the market.
The indicator allows users to customize the length and type of moving averages (EMA or SMA), as well as decide whether to apply the VWAP filter.
This indicator provides traders with clear visual signals to quickly assess the strength of bullish or bearish conditions based on the price's position relative to custom moving averages, BBPower, and VWAP, helping with trend identification and potential trade setups.
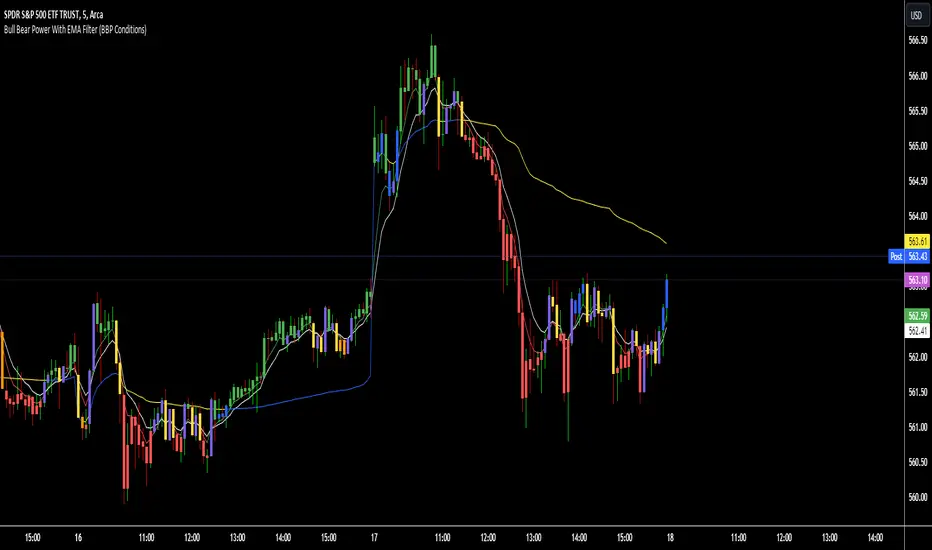
MTF HalfTrendIntroduction
A half-trend indicator is a technical analysis tool that uses moving averages and price data to find potential trend reversal and entry points in the form of graphical arrows showing market turning points.
The salient features of this indicator are:
- It uses the phenomenon of moving averages.
- It is a momentum indicator.
- It can indicate a trend change.
- It is capable of detecting a bullish or bearish trend reversal.
- It can signal to sell/buy.
- It is a real-time indicator.
Multi-Timeframe Application
A standout feature is its flexibility across timeframes. Traders have the liberty to choose any timeframe on the chart, enhancing the tool's versatility and making it suitable for both short-term and long-term analyses.
Principle of the Half Trend indicator
This indicator is based on the moving averages. The moving average is the average of the fluctuation or change in the price of an asset. These averages are taken for a time interval.
So, a half-trend indicator takes the moving averages phenomenon as its principle for working. The most commonly used moving averages in a half trend indicator are:
- Relative strength index (RSI)
- EMA (estimated moving average)
Components of a Half Trend indicator
There are two main components of a half trend indicator:
- Half trend line
- Arrows
- ATR lines
Half trend line
Half trend line represents this indicator on a candlestick chart. This line shows the trend of a chart in real-time. A half-trend line is based on the moving averages.
There are two further components of a half-trend line:
- Redline
- Blue line
A red line represents a bearish trend. When the half-trend line turns red, a trend is facing a dip. It is time for the bears to take control of the market. A bearish control of the market represents the domination of sellers in the market.
On the other hand, the blue line represents the bullish nature of the market. It tells a trader that the bullish sentiment of the market is prevailing. A bullish market means the number of buyers is significantly greater than the number of sellers.
Moreover, a trader can change these colors to his choice by customization.
Arrows
There are two types of arrows in this indicator which help a trader with the entry and exit points. These arrows are,
- Blue arrow
- Red arrow
A blue arrow signals a buying trade; on the other hand, a red arrow tells a trader about the selling of the assets. These arrows work with the moving average line to formulate a trading strategy.
The color of these arrows is changed if a trader desires so.
ATR lines
The ATR blue and red lines represent the Average True Range of the Half trend line. They may be used as stop loss or take profit levels.
Pros and Cons
Pros
- It is a very easy to eyes indicator.
- This is a very useful friendly indicator.
- It provides sufficient information to beginner traders.
- It provides sufficient information for entry points in a trade.
- A half-trend indicator provides a good exit strategy for a trader.
- It provides information about market reversals.
- It helps a trader to find a bullish and bearish sentiment in the market.
Cons
- It is a real-time indicator. So, it can lag.
- The lagging of this indicator can lead to miss opportunities.
- The most advanced and professional traders may not rely on this indicator for crucial trading decisions.
- The lagging of this indicator can predict false reversals of the market.
- It can create false signals.
- It requires the confluence of the other technical tools for a better success ratio.
Settings for Half Trend indicator
The default settings for half trend indicator are:
Amplitude = 2
Channel deviation = 2
Different markets or financial instruments may require different settings for optimal execution.
Amplitude: The degree that the Half trend line takes the internal variables into consideration. The higher the number, the fewer trades. The default value is 2.
Channel deviation: The ATR value calculation from the Half trend line. The default value is 2.
Trading strategy
It is an effective indicator in terms of strategy formation for a trading setup. The new and beginner trades can take benefit from this indicator for the formulation of a good trading setup. This indicator also helps seasoned and professional traders formulate a good trading setup with other technical tools.
The trading strategy involving a half-trend indicator is divided into three parts:
- Entry and exit
- Risk management
- Take profit
Entry and exit
It is an effective indicator that provides sufficient information about the entry and exit points in a trading setup. The profit of a trader is directly proportional to the appropriate entry and exit points. So, it is a crucial step in any trading setup.
The blue and red arrows provide information about the entry and exit points in a trading setup. Furthermore, the entry and exit for the bullish and bearish setups are as follows.
Entry and exit for a bullish setup
If a blue arrow appears under the half-trend line, it means the bullish sentiment of the market is getting stronger in the future. So, it is a signal for entry in a bullish setup.
As the red arrow appears on the chart, it is a signal to exit your trade. The red arrow represents a reversal in the market, so it is a good opportunity to close your trade in a bullish setup.
Entry and exit for a bearish setup
Suppose a red arrow appears above the red moving average line. It is a good opportunity to enter a trade in a bearish setup. The red line represents that sooner the sellers are going to take control and the value of the asset is about to face a dip. So it is the best time to make your move.
As the opposite arrow appears in the chart, it is time to exit from a bearish trade setup.
Re-entering a position
Bullish setup
- The half-trend line is blue.
- At least one candle closes below the blue half-trend line.
- Enter on the candle that closes above the blue half-trend line.
Bearish setup
- The half-trend line is red.
- At least one candle closes above the red half-trend line.
- Enter on the candle that closes below the red half-trend line.
Risk management
Risk management is an integral part of a trading setup. It is an important step to protect your potential profits and losses.
When trading in a bullish market, place the stop loss at the prior swing low. It will help you to cut your losses in case the prices move to the lower end.
In the case of a bearish market, place your stop loss above the prior swing high.
A trader may trail the stop loss using the ATR lines.
The new trader often makes mistakes in the placement of the stop loss. If you don’t place the stop loss at an appropriate point. It can drain your bank account and ruin your trading experience. Is is recommended not to risk more than 2% of your trading account, per trade.
Take profit
The blue ATR line may be used as one take profit level on a bullish setup followed by the previous swing high. The signal reversal would indicate the final take profit and closing of any position.
The red ATR line may be used as one take profit level on a bearish setup followed by the previous swing low. The signal reversal would indicate the final take profit and closing of any position.
Conclusion
A half trend indicator is a decent indicator that can transform your trading experience. It is a dual indicator that is based on the moving averages as well as helps you to form a trading strategy. If you are a new trader, this indicator can help you to learn and flourish in the trading universe. If you are a seasoned trader, I recommend you use this indicator with other technical analysis tools to enhance your success ratio.
All credits go to:
- @everget the original creator of this indicator (I just added the MTF capability).
- Ali Muhammad original author of much of the description used.
