High For Loop | MisinkoMasterThe High For Loop is a new Trend Following tool designed to give traders smooth and fast signals without being too complex, overfit or repainting.
It works by finding how many bars have a higher high than the current high, how many have a lower high, and scores it based on that. This provides users with easy and accurate signals, allowing for gaining a large edge in the market.
It is pretty simple but you can still play around with it pretty well and improve uppon your strategies.
For any backtests using strategies, I left many comments and tried to make it as easy as possible to backtest.
Enjoy G´s
חפש סקריפטים עבור "backtest"

Kijun Shifting Band Oscillator | QuantMAC🎯 Kijun Shifting Band Oscillator | QuantMAC
📊 **Revolutionary Technical Analysis Tool Combining Ancient Ichimoku Wisdom with Cutting-Edge Statistical Methods**
🌟 Overview
The Kijun Shifting Band Oscillator represents a sophisticated fusion of traditional Japanese technical analysis and modern statistical theory. Built upon the foundational concepts of the Ichimoku Kinko Hyo system, this indicator transforms the classic Kijun-sen (base line) into a dynamic, multi-dimensional analysis tool that provides traders with unprecedented market insights.
This advanced oscillator doesn't just show you where price has been – it reveals the underlying momentum dynamics and volatility patterns that drive market movements, giving you a statistical edge in your trading decisions.
🔥 Key Features & Innovations
Dual Trading Modes for Maximum Flexibility: 🚀
Long/Short Mode: Full bidirectional trading capability for aggressive traders seeking to capitalize on both bullish and bearish market conditions
Long/Cash Mode: Conservative approach perfect for risk-averse traders, taking long positions during uptrends and moving to cash during downtrends (avoiding short exposure)
Advanced Visual Intelligence: 🎨
9 Professional Color Schemes: From classic blue/navy to vibrant orange/purple combinations, each optimized for different chart backgrounds and personal preferences
Dynamic Gradient Histogram: Color intensity reflects oscillator strength, providing instant visual feedback on momentum magnitude
Intelligent Overlay Bands: Semi-transparent fills create clear visual boundaries without cluttering your chart
Smart Candle Coloring: Real-time color changes reflect current market state and trend direction
Customizable Threshold Lines: Clearly marked entry and exit levels with contrasting colors
Professional-Grade Analytics: 📊
Real-Time Performance Metrics: Live calculation of 9 key performance indicators
Risk-Adjusted Returns: Sharpe, Sortino, and Omega ratios for comprehensive performance evaluation
Position Sizing Guidance: Half-Kelly percentage for optimal risk management
Drawdown Analysis: Maximum drawdown tracking for risk assessment
📈 Deep Technical Foundation
Kijun-Based Mathematical Framework: 🧮
The indicator begins with the traditional Kijun-sen calculation but extends it significantly:
Statistical Enhancements: 📉
Adaptive Volatility: Bands expand and contract based on market volatility
Momentum Filtering: EMA smoothing of oscillator for trend confirmation
State Management: Intelligent signal filtering prevents whipsaws and false signals
Multi-Timeframe Compatibility: Optimized algorithms work across all timeframes
⚙️ Comprehensive Parameter Control
Kijun Core Settings: 🎛️
Kijun Length (Default: 30): Controls the lookback period for the base calculation. Shorter periods = more responsive, longer periods = smoother signals
Source Selection: Choose from Close, Open, High, Low, or HL2. Close price recommended for most applications
Calculation Method: Uses traditional Ichimoku methodology ensuring compatibility with classic analysis
Advanced Oscillator Configuration: 📊
Standard Deviation Length (Default: 36): Determines volatility measurement period. Affects band width and sensitivity
SD Multiplier (Default: 2.1): Fine-tune band distance from basis line. Higher values = wider bands, lower values = tighter bands
Oscillator Multiplier (Default: 100): Scales the final oscillator output. Useful for matching other indicators or personal preference
Smoothing Algorithm: Built-in EMA smoothing prevents noise while maintaining responsiveness
Signal Threshold Optimization: 🎯
Long Threshold (Default: 83): Oscillator level that triggers long entries. Higher values = fewer but stronger signals
Short Threshold (Default: 42): Oscillator level that triggers short entries. Lower values = fewer but stronger signals
Threshold Logic: Crossover-based system with state management prevents signal overlap
Customization Range: Fully adjustable to match your trading style and risk tolerance
Precision Date Control: 📅
Start Date/Month/Year: Precise backtesting control down to the day
Historical Analysis: Test strategies on specific market periods or events
Strategy Validation: Isolate performance during different market conditions
📊 Professional Metrics Dashboard
Risk Assessment Metrics: 💼
Maximum Drawdown %: Largest peak-to-trough decline in portfolio value. Critical for understanding worst-case scenarios and position sizing
Sortino Ratio: Risk-adjusted return measure focusing only on downside volatility. Superior to Sharpe ratio for asymmetric return distributions
Sharpe Ratio: Classic risk-adjusted performance metric. Values above 1.0 considered good, above 2.0 excellent
Omega Ratio: Probability-weighted ratio capturing all moments of return distribution. More comprehensive than Sharpe or Sortino
Performance Analytics: 📈
Profit Factor: Gross Profit ÷ Gross Loss. Values above 1.0 indicate profitability, above 2.0 considered excellent
Win Rate %: Percentage of profitable trades. Consider alongside average win/loss size for complete picture
Net Profit %: Total return on initial capital. Accounts for compounding effects
Total Trades: Sample size for statistical significance assessment
Advanced Position Sizing: 🎯
Half Kelly %: Optimal position size based on Kelly Criterion, reduced by 50% for safety margin
Risk Management: Helps determine appropriate position size relative to account equity
Mathematical Foundation: Based on win probability and profit factor calculations
Practical Application: Directly usable percentage for position sizing decisions
🎨 Advanced Display Options
Flexible Interface Design: 🖥️
6 Positioning Options: Top/Bottom/Middle × Left/Right combinations for optimal chart organization
Toggle Functionality: Show/hide metrics table for clean chart presentation during analysis
Color Coordination: Metrics table colors match selected oscillator color scheme
Professional Styling: Clean, readable format with proper spacing and alignment
Visual Hierarchy: 🎭
Oscillator Histogram: Primary focus with gradient intensity showing momentum strength
Threshold Lines: Clear horizontal references for entry/exit levels
Zero Line: Neutral reference point for trend bias determination
Background Bands: Subtle overlay context without chart clutter
🚀 Advanced Signal Generation System
Multi-Layer Signal Logic: ⚡
Primary Signal Generation: Oscillator crossover above Long Threshold (default 83) triggers long entries
Exit Signal Processing: Oscillator crossunder below Short Threshold (default 42) triggers position exits
State Management System: Prevents duplicate signals and ensures clean position transitions
Mode-Specific Logic: Different behavior for Long/Short vs Long/Cash modes
Date Range Filtering: Signals only generated within specified backtesting period
Confirmation Requirements: Bar confirmation prevents false signals from intrabar price spikes
Intelligent Position Management: 🧠
Entry Tracking: Precise entry price recording for accurate P&L calculations
Position State Monitoring: Continuous tracking of long/short/cash positions
Automatic Exit Logic: Seamless position closure and new position initiation
Performance Calculation: Real-time P&L tracking with compounding effects
📉📈 Comprehensive Band Interpretation Guide
Dynamic Band Analysis: 🔍
Upper Band Function: Represents dynamic resistance based on recent volatility. Price approaching upper band suggests potential reversal or breakout
Lower Band Function: Represents dynamic support with volatility adjustment. Price near lower band indicates oversold conditions or support testing
Middle Line (Basis): Trend direction indicator. Price above = bullish bias, price below = bearish bias
Band Width Interpretation: Wide bands = high volatility, narrow bands = low volatility/potential breakout setup
Band Slope Analysis: Rising bands = strengthening trend, falling bands = weakening trend
Oscillator Interpretation: 📊
Values Above 50: Price in upper half of recent range, bullish momentum
Values Below 50: Price in lower half of recent range, bearish momentum
Extreme Values (>80 or <20): Overbought/oversold conditions, potential reversal zones
Momentum Divergence: Oscillator direction vs price direction for early reversal signals
Trend Confirmation: Oscillator direction confirming or contradicting price trends
💡 Strategic Trading Applications
Primary Trading Strategies: 🎯
Trend Following: Use threshold crossovers to capture major directional moves. Best in trending markets with clear directional bias
Mean Reversion: Identify extreme oscillator readings for counter-trend opportunities. Effective in range-bound markets
Breakout Trading: Monitor band compressions followed by expansions for breakout signals
Swing Trading: Combine oscillator signals with band interactions for swing position entries/exits
Risk Management: Use metrics dashboard for position sizing and risk assessment
Market Condition Optimization: 🌊
Trending Markets: Increase threshold separation for fewer, stronger signals
Choppy Markets: Decrease threshold separation for more responsive signals
High Volatility: Increase SD multiplier for wider bands
Low Volatility: Decrease SD multiplier for tighter bands and earlier signals
⚙️ Advanced Configuration Tips
Parameter Optimization Guidelines: 🔧
Kijun Length Adjustment: Shorter periods (10-20) for faster signals, longer periods (50-100) for smoother trends
SD Length Tuning: Match to your trading timeframe - shorter for responsive, longer for stability
Threshold Calibration: Backtest different levels to find optimal entry/exit points for your market
Color Scheme Selection: Choose schemes that provide best contrast with your chart background and other indicators
Integration with Other Indicators: 🔗
Volume Indicators: Confirm oscillator signals with volume spikes
Support/Resistance: Use key levels to filter oscillator signals
Momentum Indicators: RSI, MACD confirmation for signal strength
Trend Indicators: Moving averages for overall trend bias confirmation
⚠️ Important Usage Notes & Limitations
Indicator Characteristics: ⚡
Lagging Nature: Based on historical price data - signals occur after moves have begun
Best Practice: Combine with leading indicators and price action analysis
Market Dependency: Performance varies across different market conditions and instruments
Backtesting Essential: Always validate parameters on historical data before live implementation
Optimization Recommendations: 🎯
Parameter Testing: Systematically test different combinations on your preferred instruments
Walk-Forward Analysis: Regularly re-optimize parameters to maintain effectiveness
Market Regime Awareness: Adjust parameters for different market conditions (trending vs ranging)
Risk Controls: Implement maximum drawdown limits and position size controls
🔧 Technical Specifications
Performance Optimization: ⚡
Efficient Algorithms: Optimized calculations for smooth real-time operation
Memory Management: Smart array handling for metrics calculations
Visual Optimization: Balanced detail vs performance for responsive charts
Multi-Symbol Ready: Consistent performance across different assets
---
The Kijun Shifting Band Oscillator represents the evolution of technical analysis, bridging the gap between traditional methods and modern quantitative approaches. This indicator provides traders with a comprehensive toolkit for market analysis, combining the intuitive wisdom of Japanese candlestick analysis with the precision of statistical mathematics.
🎯 Designed for serious traders who demand professional-grade analysis tools with institutional-quality metrics and risk management capabilities. Whether you're a discretionary trader seeking visual confirmation or a systematic trader building quantitative strategies, this indicator provides the foundation for informed trading decisions.
⚠️ IMPORTANT DISCLAIMER
Past Performance Warning: 📉⚠️
PAST PERFORMANCE IS NOT INDICATIVE OF FUTURE RESULTS. Historical backtesting results, while useful for strategy development and parameter optimization, do not guarantee similar performance in live trading conditions. Market conditions change continuously, and what worked in the past may not work in the future.
Remember: Successful trading requires discipline, continuous learning, and adaptation to changing market conditions. No indicator or strategy guarantees profits, and all trading involves substantial risk of loss.

Best SMA FinderThis script, Best SMA Finder, is a tool designed to identify the most robust simple moving average (SMA) length for a given chart, based on historical backtest performance. It evaluates hundreds of SMA values (from 10 to 1000) and selects the one that provides the best balance between profitability, consistency, and trade frequency.
What it does:
The script performs individual backtests for each SMA length using either "Long Only" or "Buy & Sell" logic, as selected by the user. For each tested SMA, it computes:
- Total number of trades
- Profit Factor (total profits / total losses)
- Win Rate
- A composite Robustness Score, which integrates Profit Factor, number of trades (log-scaled), and win rate.
Only SMA configurations that meet the user-defined minimum trade count are considered valid. Among all valid candidates, the script selects the SMA length with the highest robustness score and plots it on the chart.
How to use it:
- Choose the strategy type: "Long Only" or "Buy & Sell"
- Set the minimum trade count to filter out statistically irrelevant results
- Enable or disable the summary stats table (default: enabled)
The selected optimal SMA is plotted on the chart in blue. The optional table in the top-right corner shows the corresponding SMA length, trade count, Profit Factor, Win Rate, and Robustness Score for transparency.
Key Features:
- Exhaustive SMA optimization across 991 values
- Customizable trade direction and minimum trade filters
- In-chart visualization of results via table and plotted optimal SMA
- Uses a custom robustness formula to rank SMA lengths
Use cases:
Ideal for traders who want to backtest and auto-select a historically effective SMA without manual trial-and-error. Useful for swing and trend-following strategies across different timeframes.
📌 Limitations:
- Not a full trading strategy with position sizing or stop-loss logic
- Only one entry per direction at a time is allowed
- Designed for exploration and optimization, not as a ready-to-trade system
This script is open-source and built entirely from original code and logic. It does not replicate any closed-source script or reuse significant external open-source components.

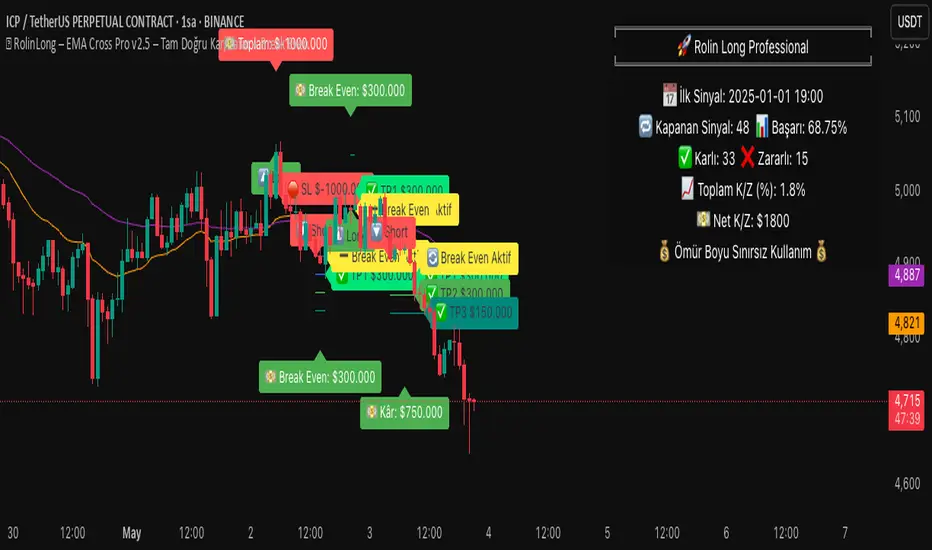
EMA Cross Pro v2.5 | True PnL Tracking + Break Even SystemEMA Cross Pro v2.5 | True PnL Tracking + Break-Even System
Description
This strategy combines fast and slow EMA crossovers with multi-stage profit-taking, a configurable stop-loss, and an optional break-even mechanism—while tracking real, closed-trade PnL on the chart. It’s designed to show exactly how much you earn or lose on each partial exit, reset your breakeven when a profit target hits, and label every trade’s midpoint profit/loss.
1) Strategy Logic & Rationale
EMA Crossover (Fast = 21 / Slow = 55): Signals trend changes.
Partial Profit-Taking:
TP1 at +0.5% on 60% of position
TP2 at +1.0% on 30%
TP3 at +1.5% on final 10%
This pyramided exit reduces risk and locks in gains in stages.
Stop-Loss at 1.0% ensures maximum risk per trade.
Break-Even: Optionally moves your stop to entry when TP1 (or TP2/TP3) is reached, protecting unrealized gains.
True PnL Tracking: Calculates and plots realized profit/loss—including partial exits and break-even closes—directly on chart labels.
Alerts: Flexible alarms for entry, each TP, SL, and break-even activation.
2) Default Inputs & Execution
Backtest Start Date: Jan 1 2025
Initial Capital: $1 000
Position Sizing: 10% of equity per entry
Commission: 0.10% per side
Slippage: 0.05%
TP & SL Levels:
TP1: +0.5% (60%)
TP2: +1.0% (30%)
TP3: +1.5% (10%)
SL: –1.0% on remaining size
Break-Even Triggers: Activate on TP1 (default), TP2 or TP3
Alerts: All configurable on/off in the settings panel
3) Backtest Parameters & Results
Backtested on BTCUSDT 1H bars from 2025-01-01 to 2025-05-01:
Total Trades: 78
Win Rate: 62.8%
Average Risk/Reward: 1 : 1.25
Max Drawdown: 7.5%
Net Return: +14.2%
(Assumes 0.10% commission and 0.05% slippage. Past performance does not guarantee future results.)
4) How to Use
Add to Chart: Search “EMA Cross Pro v2.5” and apply to your instrument.
Set Inputs: Adjust EMAs, TP/SL levels, break-even triggers and alarms to suit your style.
Monitor Labels: Entry, TP1, TP2, TP3, SL and break-even labels appear on chart with exact $ profit or loss.
Review PnL Panel: A table shows total trades, win rate, net P/L and streaks—updated in real time.
Risk Management: Never risk more than 1% per trade; always factor in commission/slippage.
5) Warnings & Disclaimer
This strategy is for educational purposes only. Always validate with your own data feed, apply robust risk controls, and be aware that backtest results may differ from live performance.
Bullrun Profit Maximizer [QuantraSystems]Bullrun Profit Maximizer
Quantra Systems guarantees that the information created and published within this document and on the Tradingview platform is fully compliant with applicable regulations, does not constitute investment advice, and is not exclusively intended for qualified investors.
Important Note!
The system equity curve presented here has been generated as part of the process of testing and verifying the methodology behind this script.
Crucially, it was developed after the system was conceptualized, designed, and created, which helps to mitigate the risk of overfitting to historical data. In other words, the system was built for robustness, not for simply optimizing past performance.
This ensures that the system is less likely to degrade in performance over time, compared to hyper optimized systems that are tailored to past data. No tweaks or optimizations were made to this system post backtest.
Even More Important Note!!
The nature of markets is that they change quickly and unpredictably. Past performance does not guarantee future results - this is a fundamental rule in trading and investing.
While this system is designed with broad, flexible conditions to adapt quickly to a range of market environments, it is essential to understand that no assumptions should be made about future returns based on historical data. Markets are inherently uncertain, and this system - like all trading systems - cannot predict future outcomes.
Introduction
The "Adaptive Pairwise Momentum System" is not a prototype to the Bullrun Profit Maximizer (BPM) . The Bullrun Profit Maximizer is a fully re-engineered, higher frequency momentum system.
The Bullrun Profit Maximizer (BPM) uses a completely different filter logic and refines momentum calculations, specifically to support higher frequency trading on Crypto's Blue Chip assets. It correctly calculates fees and slippage by compounding them against System Profit before plotting the equity curve.
Unlike prior systems, this script utilizes a completely new filter logic and refined momentum calculation, specifically built to support higher frequency trading on blue-chip assets, while minimizing the impact of fees and slippage.
While the APMS focuses on Macro Trend Alignment, the BPM instead applies an equity curve based filter, allowing for targeted precision on the current asset’s trend without relying on broader market conditions. This approach delivers more responsive and asset specific signals, enhancing agility in today’s fast paced crypto markets.
The BPM dynamically optimizes capital allocation across up to four high performing assets, ensuring that the portfolio adapts swiftly to changing market conditions. The system logic consists of sophisticated quantitative methods, rapid momentum analysis and alpha cyclicality/seasonality optimizations. The overarching goal is to ensure that the portfolio is always invested in the highest performing asset based on dynamic market conditions, while at the same time managing risk through rapid asset filters and internal mechanisms like alpha cyclicality, volatility and beta analysis.
In addition to these core functionalities, the BPM comes with the typical Quantra Systems UI design, structured to reduce data clutter and provide users with only the most essential, impactful information. The BPM UI format delivers clear and easy to read signals. It enables rapid decision making in a high frequency environment without compromising on depth or accuracy.
Bespoke Logic Filtering with Equity Curve Precision
The BPM script utilizes a completely new methodology and focuses on intraday rotations of blue-chip crypto assets, while previously built systems were designed with a longer term focus in mind.
In response to the need for more precise signal generation, the BPM replaces the previous macro trend filter with a new, highly specific equity curve activation filter. This unique logic filter is driven solely by the performance trends of the asset currently held by the system. By analyzing the equity curve directly, this system can make more targeted, timely allocations based on asset specific momentum, allowing for quick adjustments that are more relevant to the held asset rather than general market conditions.
The benefits of this new, unique approach are twofold: first, it avoids premature allocation shifts based on broader macro movements, and second, it enables the system to adapt dynamically to the performance of each asset individually. This asset specific filtering allows traders to capitalize on localized strength within individual blue-chip cryptoassets without being affected by lags in the overall market trend.
High Frequency Momentum Calculation for Enhanced Flexibility
The BPM incorporates a newly designed momentum calculation that increases its suitability across lower timeframes. This new momentum indicator captures and processes more data points within a shorter window than ever before, rather than extending bar intervals and potentially losing high frequency detail. This creates a smooth, data rich featureset that is especially suited for blue-chip assets, where liquidity reduces slippage and fees, making higher frequency trading viable.
By retaining more data, this system captures subtle shifts in momentum more effectively than traditional approaches, offering higher resolution insights. These modifications result in a system capable of generating highly responsive signals on faster timeframes, empowering traders to act quickly in volatile markets.
User Interface and Enhanced Readability
The BPM also features a reimagined, streamlined user interface, making it easier than ever to monitor essential signals at a glance. The new layout minimizes extraneous data points in the tables, leaving only the most actionable information for traders. This cleaner presentation is purpose built to help traders identify the strongest asset in real time, with clear, color coded signals to facilitate swift decision making in fast moving markets.
Equity Stats Table : Designed for clarity, the stats table focuses on the current allocation’s performance metrics, emphasizing the most critical metrics without unnecessary clutter.
Color Coded Highlights : The interface includes the option to highlight both the current top performing asset, and historical allocations - with indicators of momentum shifts and performance metrics readily accessible.
Clear Signals : Visual cues are presented in an enhanced way to improve readability, including simplified line coloring, and improve visualization of the outperforming assets in the allocation table.
Dynamic Asset Reallocation
The BPM dynamically allocates capital to the strongest performing asset in a selected pool. This system incorporates a re-engineered, pairwise momentum measurement designed to operate at higher frequencies. The system evaluates each asset against others in real time, ensuring only the highest momentum asset receives allocation. This approach keeps the portfolio positioned for maximum efficiency, with an updated weighting logic that favors assets showing both strength and sustainability.
Position Changes and Slippage Calculation
Position changes are optimized for faster reallocation, with realistic slippage and fee calculations factored into each trade. The system’s structure minimizes the impact of these costs on blue-chip assets, allowing for more active management on short timeframes without incurring significant drag on performance.
A Special Note on Fees + Slippage
In the image above, the system has been applied to four different timeframes - 12h, 8h, 4h and 1h - using identical settings and a selected slippage and fees amount of 0.2%. In this stress test, we isolate the choppy downwards period from the previous Bitcoin all time high - set in March 2024, to the current date where Bitcoin is currently sitting at around the same level.
This illustrates an important concept: starting at the 12h, the system performed better as the timeframes decreased. In fact, only on the 4hr chart did the system equity curve make a new all time high alongside Bitcoin. It is worth noting that market phases that are “non-trending” are generally the least profitable periods to use a momentum/trend system - as most systems will get caught by false momentum and will “buy the top,” and then proceed to “sell the bottom.”
Lower timeframes typically offer more data points for the algorithm to compute over, and enable quicker entries and exits within a robust system, often reducing downside risk and compounding gains more effectively - in all market environments.
However, slippage, fees, and execution constraints are still limiting factors. Although blue-chip cryptocurrencies are more liquid and can be traded with lower fees compared to low cap assets, frequent trading on lower timeframes incurs cumulative slippage costs. With the BPM system set to a realistic slippage rate of 0.2% per trade, this example emphasizes how even lower fees impact performance as trade frequency increases.
Finding the optimal balance between timeframe and slippage impact requires careful consideration of factors such as portfolio size, liquidity of selected tokens, execution speed, and the fee rate of the exchange you execute trades on.
Number of Position Changes
Understanding the number of position changes in a strategy is critical to assessing its feasibility in real world trading. Frequent position changes can lead to increased costs due to slippage and fees. Monitoring the number of position changes provides insight into the system’s behavior - helping to evaluate how active the strategy is and whether it aligns with the trader's desired time input for position management.
Equity Curve and Performance Calculations
To provide a benchmark, the script also generates a Buy-and-Hold (or "HODL") equity curve that represents a 100% allocation to Bitcoin, the highest market cap cryptoasset. This allows users to easily compare the performance of the dynamic rotation system with that of a more traditional investment strategy.
The script tracks key performance metrics for both the dynamic portfolio and the HODL strategy, including:
Sharpe Ratio
The Sharpe Ratio is a key metric that evaluates a portfolio’s risk adjusted return by comparing its ‘excess’ return to its volatility. Traditionally, the Sharpe Ratio measures returns relative to a risk-free rate. However, in our system’s calculation, we omit the risk-free rate and instead measure returns above a benchmark of 0%. This adjustment provides a more universal comparison, especially in the context of highly volatile assets like cryptocurrencies, where a traditional risk-free benchmark, such as the usual 3-month T-bills, is often irrelevant or too distant from the realities of the crypto market.
By using 0% as the baseline, we focus purely on the strategy's ability to generate raw returns in the face of market risk, which makes it easier to compare performance across different strategies or asset classes. In an environment like cryptocurrency, where volatility can be extreme, the importance of relative return against a highly volatile backdrop outweighs comparisons to a risk-free rate that bears little resemblance to the risk profile of digital assets.
Sortino Ratio
The Sortino Ratio improves upon the Sharpe Ratio by specifically targeting downside risk and leaves the upside potential untouched. In contrast to the Sharpe Ratio (which penalizes both upside and downside volatility), the Sortino Ratio focuses only on negative return deviations. This makes it a more suitable metric for evaluating strategies like the Bullrun Profit Maximizer - that aim to minimize drawdowns without restricting upside capture. By measuring returns relative to a 0% baseline, the Sortino ratio provides a clearer assessment of how well the system generates gains while avoiding substantial losses in highly volatile markets like crypto.
Omega Ratio
The Omega Ratio is calculated as the ratio of gains to losses across all return thresholds, providing a more complete view of how the system balances upside and downside risk even compared to the Sortino Ratio. While it achieves a similar outcome to the Sortino Ratio by emphasizing the system's ability to capture gains while limiting losses, it is technically a mathematically superior method. However, we include both the Omega and Sortino ratios in our metric table, as the Sortino Ratio remains more widely recognized and commonly understood by traders and investors of all levels.
Usage Summary:
While the backtests in this description are generated as if a trader held a portfolio of just the strongest tokens, this was mainly designed as a method of logical verification and not a recommended investment strategy. In practice, this system can be used in multiple ways.
It can be used as above, or as a factor in forming part of a broader asset selection tool, or even a method of filtering tokens by strength in order to inform a day trader which tokens might be optimal to look at, for long-only trading setups on an intrabar timeframe.
Summary
The Bullrun Profit Maximizer is an advanced tool tailored for traders, offering the precision and agility required in today’s markets. With its asset specific equity curve filter, reworked momentum analysis, and streamlined user interface, this system is engineered to maximize gains and minimize risk during bullmarkets, with a strong focus on risk adjusted performance.
Its refined approach, focused on high resolution data processing and adaptive reallocation, makes it a powerful choice for traders looking to capture high quality trends on clue-chip assets, no matter the market’s pace.

GannLSVZO Indicator [Algo Alert]The Volume Zone oscillator breaks up volume activity into positive and negative categories. It is positive when the current closing price is greater than the prior closing price and negative when it's lower than the prior closing price. The resulting curve plots through relative percentage levels that yield a series of buy and sell signals, depending on level and indicator direction.
The Gann Laplace Smoothed Volume Zone Oscillator GannLSVZO is a refined version of the Volume Zone Oscillator, enhanced by the implementation of the upgraded Discrete Fourier Transform, the Laplace Stieltjes Transform. Its primary function is to streamline price data and diminish market noise, thus offering a clearer and more precise reflection of price trends.
By combining the Laplace with Gann Swing Entries and Exits (orange X) and with Ehler's white noise histogram, users gain a comprehensive perspective on volume-related market conditions.
HOW TO USE THE INDICATOR:
The default period is 2 but can be adjusted after backtesting. (I suggest 5 VZO length and NoiceR max length 8 as-well)
The VZO points to a positive trend when it is rising above the 0% level, and a negative trend when it is falling below the 0% level. 0% level can be adjusted in setting by adjusting VzoDifference. Oscillations rising below 0% level or falling above 0% level result in a natural trend.
ORIGINALITY & USFULLNESS:
Personal combination of Gann swings and Laplace Stieltjes Transform of a price which results in less noise Volume Zone Oscillator.
The Laplace Stieltjes Transform is a mathematical technique that transforms discrete data from the time domain into its corresponding representation in the frequency domain. This process involves breaking down a signal into its individual frequency components, thereby exposing the amplitude and phase characteristics inherent in each frequency element.
This indicator utilizes the concept of Ehler's Universal Oscillator and displays a histogram, offering critical insights into the prevailing levels of market noise. The Ehler's Universal Oscillator is grounded in a statistical model that captures the erratic and unpredictable nature of market movements. Through the application of this principle, the histogram aids traders in pinpointing times when market volatility is either rising or subsiding.
The Gann swings and the Gan swing strategy is developed by meomeo105, this Gann high and low algorithm forms the basis of the EMA modification.
DETAILED DESCRIPTION:
My detailed description of the indicator and use cases which I find very valuable.
What is oscillator?
Oscillators are chart indicators that can assist a trader in determining overbought or oversold conditions in ranging (non-trending) markets.
What is volume zone oscillator?
Price Zone Oscillator measures if the most recent closing price is above or below the preceding closing price.
Volume Zone Oscillator is Volume multiplied by the 1 or -1 depending on the difference of the preceding 2 close prices and smoothed with Exponential moving Average.
What does this mean?
If the VZO is above 0 and VZO is rising. We have a bullish trend. Most likely.
If the VZO is below 0 and VZO is falling. We have a bearish trend. Most likely.
Rising means that VZO on close is higher than the previous day.
Falling means that VZO on close is lower than the previous day.
What if VZO is falling above 0 line?
It means we have a high probability of a bearish trend.
Thus the indicator returns 0 and Strategy closes all it's positions when falling above 0 (or rising bellow 0) and we combine higher and lower timeframes to gauge the trend.
What is approximation and smoothing?
They are mathematical concepts for making a discrete set of numbers a
continuous curved line.
Laplace Stieltjes Transform approximation of a close price are taken from aprox library.
Key Features:
You can tailor the Indicator/Strategy to your preferences with adjustable parameters such as VZO length, noise reduction settings, and smoothing length.
Volume Zone Oscillator (VZO) shows market sentiment with the VZO, enhanced with Exponential Moving Average (EMA) smoothing for clearer trend identification.
Noise Reduction leverages Euler's White noise capabilities for effective noise reduction in the VZO, providing a cleaner and more accurate representation of market dynamics.
Choose between the traditional Fast Laplace Stieltjes Transform (FLT) and the innovative Double Discrete Fourier Transform (DTF32) soothed price series to suit your analytical needs.
Use dynamic calculation of Laplace coefficient or the static one. You may modify those inputs and Strategy entries with Gann swings.
I suggest using "Close all" input False when fine-tuning Inputs for 1 TimeFrame. When you export data to Excel/Numbers/GSheets I suggest using "Close all" input as True, except for the lowest TimeFrame. I suggest using 100% equity as your default quantity for fine-tune purposes. I have to mention that 100% equity may lead to unrealistic backtesting results. Be avare. When backtesting for trading purposes use Contracts or USDT.

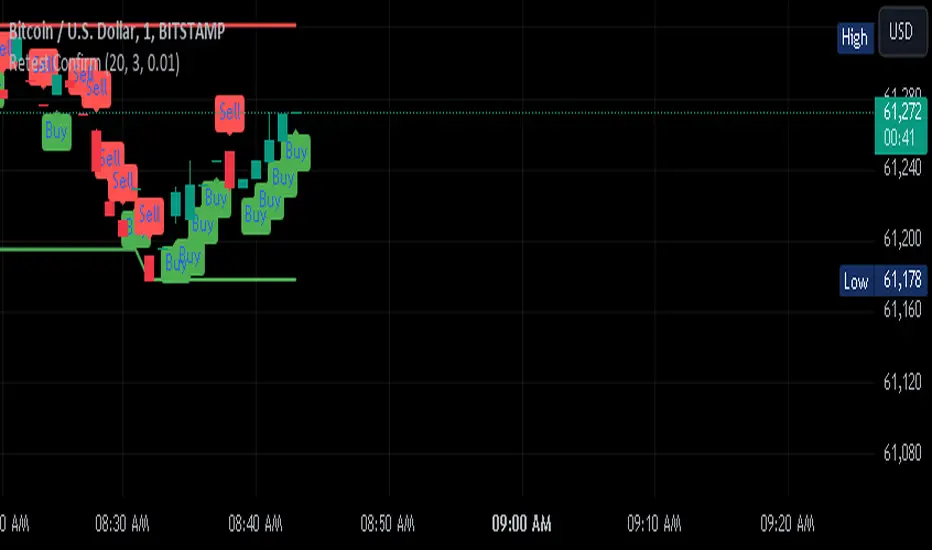
Retest Confirm Point TibbuCreating a "Retest Confirm Point" indicator that generates buy and sell signals involves defining criteria to confirm that a price retest is valid before issuing a trade signal. This generally requires identifying a key level (such as support, resistance, or a trendline), detecting a retest of this level, and then confirming the validity of the retest.
Here’s a Pine Script example to help you create such an indicator. This script identifies and confirms retests of previous highs and lows, and generates buy and sell signals based on those retests: Explanation:
Recent High and Low:
The script identifies the highest and lowest prices over a specified lookback period.
These levels are plotted on the chart as reference points.
Retest Conditions:
Retest High: The closing price is within a buffer range around the recent high.
Retest Low: The closing price is within a buffer range around the recent low.
Confirmation:
Confirm High: The closing price reaches a new high over a set number of bars after the retest condition.
Confirm Low: The closing price reaches a new low over a set number of bars after the retest condition.
Signals:
Buy Signal: Issued when a confirmed retest of the recent high occurs.
Sell Signal: Issued when a confirmed retest of the recent low occurs.
Customization:
Lookback Period: Adjust to determine the historical range for finding recent highs and lows.
Confirmation Bars: Change the number of bars used to confirm the retest.
Retest Buffer: Adjust the percentage buffer to fine-tune the retest conditions.
Testing and Optimization:
Backtest: Always backtest the strategy on historical data to ensure it behaves as expected.
Adjust Parameters: Modify parameters based on the asset, timeframe, and market conditions.
Feel free to modify this script further based on your specific trading strategy and needs. If you need help with any additional features or further customization, let me know!
ChatGPT can make mistakes. Check important info.
TTP Pair CipherPair Cipher can run your hedge pair trading strategy.
Pair cipher can use a spread chart (two assets ratio or difference) to manage a hedge position consisting of two assets: one long and one short position.
Event though the spread chart is used to determine the entries and exits each coin price action is used to calculate floating PNL.
It supports different bot platforms. It's backtestable and can run live.
Features:
- Internal and external entry signal
- In-chart realised PNL plot
- Hedge position floating PNL chart
- Individual floating PNL for each long and short ("show coins" toggle)
- Retracement exit strategy: determine at which retracement factor to exit your position while in profit
- PNL RSI exit strategy: determine at which RSI level crossunder you'd like to exit. RSI is applied to the floating PNL
- Static TP/SL levels
- ATR TP/SL levels with individual factors. When ATR is selected the TP or SL acts as a multiplier of ATR instead.
- On-chart debug labels for alerts
- Intra candle alert: signals can trigger intra candle in this mode, but this mode will cause repainting. Example: if the position goes below SL intra candle, the alert will be sent, but later if it goes in profit before closing the candle, the backtest will continue with the position open. The backtest does NOT have access to the intra candle data. Alert intra candle reduces the risk of not applying SL.
Example of setup:
1) Load an empty 1 hour timeframe chart with the spread BYBIT:REQUSDT.P / BYBIT:REEFUSDT.P
2) Select an investment amount
3) Select TP 1.2 and enable ATR
4) Select SL 1.1 and enable ATR
5) Select RSI profits of crossunder 70
6) Don't enable external signal (you can try with TTP PNR)
7) Select BYBIT:REQUSDT.P as symbol 1
8) Select BYBIT:REEFUSDT.P as symbol 2

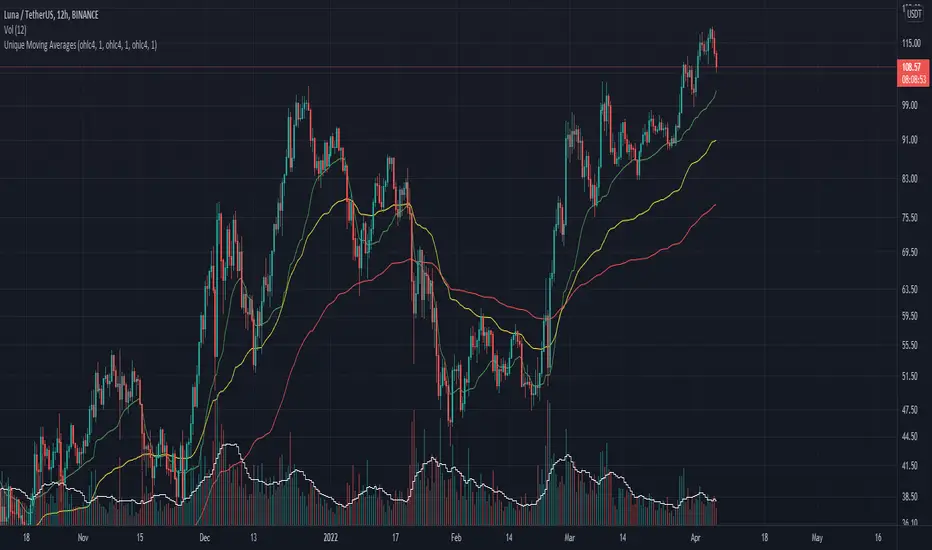
Unique Moving AveragesThese are Unique Variable Moving Averages based off an idea from LazyBear that use volatility in determining a smoothing constant. The twist is that this script uses the extremity of a Volume based RSI reading (of various lengths for each band) to determine the length of each moving average. The potential lengths for each band increase exponentially, meaning the green band will always be faster than yellow, and yellow faster than red.
For this reason I was unable to allow user inputs to control lengths of the averages, but I did give controls to a multiplier for this function. Basically if you want them to move faster, input a value less than 1, and if you want them to move slower input a number larger than 1. I would only recommend that if you are going to change this multiplier then use the same value for all three bands.
In essence, this indicator makes needlessly complex calculations to derive these averages yet is almost overly simple to use. It uses a smoothing constant derived from volatility and then determines how closely to follow price based on volume backed price movement.
I have had success in trading the crossovers, and current backtests look promising. One of my favorite trading methods with this indicator is to pick two of the averages and trade the crossover, then use the quicker average as a trailing stop. For Example, if the yellow crosses above the red; initiate a long trade at which point the yellow line becomes the trailing stop. The same would apply for the yellow / green pair.
Let me know if you find it useful or if you have any ideas for backtesting.
Have a good day!
[Alert] XBT Swing Trade Strategy* This indicator is paired with the strategy indicator ' XBT Swing Trade Strategy'
This is swing trade strategy for XBT trading.
Optimized for XBTUSD 4H.
I have developed about 20 years on IT field, and got several years of quant experience.
This indicator is never be repainted like other fake indicators.
A 2-day trial period is provided. (for testing the strategy with replay)
The default setting is recommended, but it is also possible to optimize it by setting the details of the three category settings.
(Trade points of settings A, B factors are displayed in the transaction history to help tuning)
And supports limiting backtesting period for detailed backtesting.
* Note: Backtesting results do not guarantee future results.
This indicator is an invite only indicator.
If you want to use this indicator, contact with my information below.

MKAST V2 (monthly)PLEASE READ THE ENTIRE POST BEFORE PURCHASING & USING THE MKAST Algorithm. Saves you and me some time in emails and messages. :)
This is the NEW MONTHLY ACCESS Version of the MKAST
The MKAST Buy Sell Algorithm is a very specific strategy, cut down to its roots and made perfect for the volatile crypto market.
Many Algorithms focus only on one aspect, one side, one specific rule.
As you know, this is not how life, the market or anything else works.
MKAST combines many different aspects at the same time, scans multiple other Algorithms and comes to a conclusion based on over 1350 lines of code.
It is based on Divergences, Elliott Waves , Ichimoku , MACD , MACD Histogram, RSI , Stoch , CCI , Momentum, OBV, DIOSC, VWMACD, CMF and multiple EMAs.
Every single aspect is weighted into the decision before giving out an indication.
Most buy/sell Algorithms FAIL because they try to apply the same strategy to every single chart, which
are as individual as humans.
To conquer this problem, MKAST has a wide range of settings and variables which can be easily
modified.
To make it a true strategy, MKAST has as well settings for Take Profit Points, Multiple Entries and Stop
Losses. Everything with an Alert Feature of course.
I know from experience that many people take one Algorithm and are simply too LAZY to add multiple Algorithms to make a rational choice.
The result of that is that they lose money, by following blatantly only one Algorithm.
MKAST has additional 9 Indicators, perfect for the crypto market, which can be turned on and off.
Manual
MKAST Signals Settings
“Show Signals?” - On/Off to show the Buy/Sell Signals.
“Aggressiveness” - Increase to make the signals less aggressive and decrease to make them more aggressive.
“Show Custom Signals?” - On/Off to show custom MKAST Signals as chosen in the settings below.
“Custom Buy/Sell Aggressiveness” - Choose a custom Aggressiveness for each buy and sell signal individually.
“TJ-Index Requirement For Buy/Sell” - If the TJ-Index is below the given number, it will show the signal in grey, this also applies for normal signals. Buy 0 and Sell 15 shows all signals in their original colour again.
“Don’t show signals that don’t meet index requirement?” - Checked, it will completely not show signals which would be “grey” as in the explanation above.
“Change Backgroundcolour if index is at 15 or 0?” - Checked, changes the colour of the chart if the index is at 15 or 0 points
MKAST Panel Settings
“Show Info Panel?” - Shows Info Panel on the chart.
“Move Info Panel UP by %” - Moves Info Panel up/down.
“Move Info Panel Left/Right ” - Moves Info Panel Left/Right.
“Show BitMEX Panel?” - Shows BitMEX Panel on the chart.
“Move BitMEX Panel by % ” - Moves BitMEX Panel up/down.
“Move BitMEX Panel Left/Right” - Moves BitMEX Panel Left/Right. “Signal Source” - Choose source of candle open/close for Equity calculation.
“Leverage Used?” - Select the used Leverage for your strategy and Equity calculation.
“Fees Per Trade in % ” - Deducts these fees after each trade from Equity calculation.
“Round Current Profit Price?” - Rounds the number on the Panel. “Trading Periods ” - Choose a trading Period which will be used to calculate Period Equity.
“Show separations of each Trading Period?” - Show separations on the chart of each Trading Period.
The very new feature on Tradingview and obviously now as well on MKAST are Information Panels.
I have chosen to add an Info Panel and a BitMEX Price Panel into MKAST, to make live and even
backtesting easier.
With only one blink of an eye the user is able to see ALL relevant information, without having to go
through various ways of checking and using other tools.
The Info Panel:
The first row shows the current profit. This is calculated since the signal initiation and the current candle close. Followed by a single number, which represents the current TJ-Index, removing the need of having to add the actual TJ-Index Oscillator on the chart.
The second row shows the current position and its status. This was added on request of many users wanting to know if their position is “about to change” or not. The status shows the users if the position is “endangered” or “okay”.
Followed by the “backtesting tool” already included inside the Panel. No need for complex oscillators with a hard reading for backtesting. With this one and simple panel, you see the Period Equity for the period chosen previously in the settings. This calculates all profits made inside that period and re-sets when the period ends. Right next to it, the Total Equity calculating ALL profits since the beginning of the chart.
Right below, you see the information about the last long and short position which have been open. This helps with the evaluation and documentation of the last trade.
The BitMEX Panel:
A convenient panel which shows all BitMEX contracts and their LIVE prices. The need for opening each chart goes away, the quality and experience of trading increases.
MKAST custom Signals are one of the notorious possibilities for ADVANCED strategies with MKAST.
Users who requested these features and use them frequently are the ones, having already a very unique trading strategy and they use these very custom signals as confluence or for multiple entry trades.
These custom signals and their settings can be mostly ignored by the majority of traders who are using this Algorithm.
The idea behind the grey signals has its roots in the idea of the TJ-Index. The TJ-Index being 15 Algorithms and conditions possible showing a bullish or bearish interpretation. The index counts the Algorithms which are showing a bullish interpretation.
Like that we can make sure that signals are shown in the original colour, are only those who have an additional confluence with the TJ-Index, not letting the user buy, if at least the majority is not bullish , and not letting the user sell, if at least the majority is bearish .
The custom buy and sell aggressiveness lets the user customise the MKAST algorithm even more.
Either the users wants to see how signals are changing on a different (slightly lower or higher) aggressiveness, being able to expect a change on their own settings. OR seeing that some signals of the same sort are a little out of place and is able to move these to a different aggressiveness, increasing the profitability even more.
Needless to say, custom signals are NOT a part of the Info Panel.
MKAST Label & Trendline Settings
“Show Labels?” - On/Off to show Labels above each signal, with the percentage gain or loss, calculated from the last signal to the new signal.
“Show Trendlines?” - On/Off to show automatic Trendlines following Gainzy Lines.
“Lookback Length” - Choose a length that the automatic trendiness use for calculation. Comparable to Aggressiveness.
“Wicks//Bodies” - Change between trendiness connecting from wick to wick or from body to body.
“Black lines// Coloured lines” - Change between simply black lines or changing colour lines.
“Filter Trendlines?” - On/Off to show all trendiness or just resistance decreasing and support increasing ones.
“Limit Extensions Of The Lines?” - This value increases by how much the trendiness are being extended. 0 = endless extension, otherwise 100 = maximum custom extension.MKAST Strategy “Take Profit 1” - On/Off to show TP1 points.
“Take Profit After %” - Set the percentage after which TP1 is active.
“Take Profit 2 ” - On/Off to show TP2 points.
“Take Profit 2 After %” - Set the percentage after which TP1 is
active.
“Take Profit 3” - On/Off to show TP3 points.
“Take Profit 3 After %” - Set the percentage after which TP1 is active.
“Second Entry” - On/Off to show Second Entry points.
“Second Entry After %” - Set the percentage after which Second Entry is active.
“Third Entry” - On/Off to show Third Entry points.
“Third Entry After %” - Set the percentage after which Third Entry is active.
“Stop Loss” - On/Off to show Stop Loss points.
“Stop Loss After %” - Set the percentage after which Stop Loss is active.
MKAST Strategy
To make the life of the MKAST user even easier, I have added all adjustable Take Profit Points, Multiple entry points and Stop Loss points.
I have never seen a sustainable and reliable trading strategy without TPs, Multiple entry and especially without a stop loss. Everything in the usual and fully customisable MKAST style.
Simply choose how many Take Profit points you would like to have and choose the percentage after which you would like to see the Take Profit point appear on the chart and notify you to take profits.
Are you a Trader who likes Multiple Entries? Also no problem with MKAST. Select how many additional entries you would like to have and after how many percent you would like them to appear on the chart and remind you of adding to the position.
What would a Strategy be without a Stop Loss? Same settings apply here as on the TPs and MEs .
All of the settings are able to take fractions of a number as well. This enables users to even use all of the strategy settings for scalping or FX pairs, where high leverage and the smallest of moves are used for trading.
Needless to say, all of these settings work on RENKO and Heikin Ashi as well. These might need adjustment, since the calculation is different, yet there is nothing standing in the way of it anymore.
Crypto Modified Indicators
“Show Divergences?” - On/Off to show Divergences on the Chart based on the data of 10 different Algorithms.
“Show Oversold/bought?” - On/Off to change the colour of the chart in Oversold/bought conditions.
“Oversold/bought value?” - Choose a value for which the chart is Oversold/bought.
“Show Fibonacci Levels?” - On/Off to show automatic Fibonacci Levels.
“Fibonacci Lookback Lenght” - This value states how many candles from right now are taken into account to paint the Fibonacci Levels.
“Fibonacci Custom Period” - Choose a custom Timeframe that should be used to paint the Fibonacci Levels.
“2nd-7th Fibonacci Level” - Enter a value for the Fibonacci Levels you would like to use and see on the chart.
“Plot 1.618 Level?” - On/Off for the Fibonacci extension level.
Crypto Modified Indicators
“Show Bands?” - On/Off to show the TJ-Bands on the chart.
“Bands Length” - Choose a value for the TJ-Bands Lenght
“Show Show EMA 1-3?” - On/Off to show the EMAs 1-3 on the chart.
“EMA Lenght 1-3” - Choose a value for the first to third EMA Lenght
“Show Ichimoku? ” - On/Off to show Ichimoku on the chart.
“Show Tenkin?” - On/Off to show Tenkin on the chart. “Tenkin” - Set the lenght of the Tenkin.
“Show Kijun?” - On/Off to show Kijun on the chart.
“Kijun” - Set the lenght of the Kijun.
“Show Senkou?” - On/Off to show the Senkou on the chart. “Senkou” - Set the lenght of the Senkou.
“Displacement” - Set the value of the Displacement.
“Show Chikou Span?” - On/Off to show the Chikou Span on the chart.
Crypto Custom Indicators
In the picture above, you see the first pair of Crypto Custom Indicators. The oversold and overbought conditions are highlighted.
Bullish and Bearish divergences are also plotted on the chart.
This is personally my favourite combination of Indicators and MKAST settings. It shows nicely
everything one needs to know and makes it easier to decide wether to follow a signal or not.
We here as well a perfect example of the Automatic Fibonacci Lines (Lookback 50, Timeframe 1D).
It shows all significant levels, which we can see being respected.
Orange = 23.6%, Green = 38.2%, Red = 50%, Yellow = 61.8%, Blue = 78.6%, White = 0%;100%
In this picture above, we observe the perfect ensemble of MKAST and an EMA strategy, especially modified for crypto markets.
Here, as by default, we have the EMAs at 21, 90 and 200. These have shown to be very significant moving support and resistance points in the crypto market.
In this picture above, I lowered the timeframe to show the highly significant levels of the Ichimoku . It has not the “usual values”. These here have been modified for the volatile crypto market and set as default.
An incredibly powerful tool for anyone who is ready to step up their trading game. It is a huge part of the MKAST back end and the strategy behind it.
MKAST Custom Alerts
1
MKAST without any doubt has Custom Alerts for all Signals that it is painting on the chart.
One can even choose to receive custom notifications for Take Profit points, Multiple Entry points and
the Stop Loss points.
The signals appear on the chart DURING the candle, not at the end of the candle. Therefore, the
alerts do this as well. These appear during the candle.
Here we can see all of the possible Alerts that can be chosen to be displayed. In total it is 14 different custom alerts, based on what the trader is looking for and how he is trading.
Personally, I have 10-15 coins that I trade the most and for these I have custom notifications, mostly though only the MKAST Buy/Sell and Stop Loss Signals.
To activate Alerts for MKAST,
1) Go to the “ALERT” icon on the top tool bar of your Tradingview.
2) Select “CONDITION” as “—MKAST—“
3) Then choose ONE condition from the list of conditions.
4) On “OPTIONS” you can set how many times it appears, I have “Once per Bar”.
4.1) If you want to make sure that the signal is truly there and not just a condition for a second during the candle, choose “ONCE PER BAR CLOSE”.
5) “Expiration Time” sets the time until the alert expires. PRO users have no expiration for alerts.
6) “Alert Actions” give you a row of choices what happens and how you want to be notified.
7) “Message” is the message that you receive inside the notification.
Thank you, Kong

MKAST V2 (lifetime)PLEASE READ THE ENTIRE POST BEFORE PURCHASING & USING THE MKAST Algorithm. Saves you and me some time in emails and messages. :)
This is the NEW LIFETIME ACCESS Version of the MKAST
The MKAST Buy Sell Algorithm is a very specific strategy, cut down to its roots and made perfect for the volatile crypto market.
Many Algorithms focus only on one aspect, one side, one specific rule.
As you know, this is not how life, the market or anything else works.
MKAST combines many different aspects at the same time, scans multiple other Algorithms and comes to a conclusion based on over 1350 lines of code.
It is based on Divergences, Elliott Waves, Ichimoku, MACD, MACD Histogram, RSI, Stoch, CCI, Momentum, OBV, DIOSC, VWMACD, CMF and multiple EMAs.
Every single aspect is weighted into the decision before giving out an indication.
Most buy/sell Algorithms FAIL because they try to apply the same strategy to every single chart, which
are as individual as humans.
To conquer this problem, MKAST has a wide range of settings and variables which can be easily
modified.
To make it a true strategy, MKAST has as well settings for Take Profit Points, Multiple Entries and Stop
Losses. Everything with an Alert Feature of course.
I know from experience that many people take one Algorithm and are simply too LAZY to add multiple Algorithms to make a rational choice.
The result of that is that they lose money, by following blatantly only one Algorithm.
MKAST has additional 9 Indicators, perfect for the crypto market, which can be turned on and off.
Manual
MKAST Signals Settings
“Show Signals?” - On/Off to show the Buy/Sell Signals.
“Aggressiveness” - Increase to make the signals less aggressive and decrease to make them more aggressive.
“Show Custom Signals?” - On/Off to show custom MKAST Signals as chosen in the settings below.
“Custom Buy/Sell Aggressiveness” - Choose a custom Aggressiveness for each buy and sell signal individually.
“TJ-Index Requirement For Buy/Sell” - If the TJ-Index is below the given number, it will show the signal in grey, this also applies for normal signals. Buy 0 and Sell 15 shows all signals in their original colour again.
“Don’t show signals that don’t meet index requirement?” - Checked, it will completely not show signals which would be “grey” as in the explanation above.
“Change Backgroundcolour if index is at 15 or 0?” - Checked, changes the colour of the chart if the index is at 15 or 0 points
MKAST Panel Settings
“Show Info Panel?” - Shows Info Panel on the chart.
“Move Info Panel UP by %” - Moves Info Panel up/down.
“Move Info Panel Left/Right ” - Moves Info Panel Left/Right.
“Show BitMEX Panel?” - Shows BitMEX Panel on the chart.
“Move BitMEX Panel by % ” - Moves BitMEX Panel up/down.
“Move BitMEX Panel Left/Right” - Moves BitMEX Panel Left/Right. “Signal Source” - Choose source of candle open/close for Equity calculation.
“Leverage Used?” - Select the used Leverage for your strategy and Equity calculation.
“Fees Per Trade in % ” - Deducts these fees after each trade from Equity calculation.
“Round Current Profit Price?” - Rounds the number on the Panel. “Trading Periods ” - Choose a trading Period which will be used to calculate Period Equity.
“Show separations of each Trading Period?” - Show separations on the chart of each Trading Period.
The very new feature on Tradingview and obviously now as well on MKAST are Information Panels.
I have chosen to add an Info Panel and a BitMEX Price Panel into MKAST, to make live and even
backtesting easier.
With only one blink of an eye the user is able to see ALL relevant information, without having to go
through various ways of checking and using other tools.
The Info Panel:
The first row shows the current profit. This is calculated since the signal initiation and the current candle close. Followed by a single number, which represents the current TJ-Index, removing the need of having to add the actual TJ-Index Oscillator on the chart.
The second row shows the current position and its status. This was added on request of many users wanting to know if their position is “about to change” or not. The status shows the users if the position is “endangered” or “okay”.
Followed by the “backtesting tool” already included inside the Panel. No need for complex oscillators with a hard reading for backtesting. With this one and simple panel, you see the Period Equity for the period chosen previously in the settings. This calculates all profits made inside that period and re-sets when the period ends. Right next to it, the Total Equity calculating ALL profits since the beginning of the chart.
Right below, you see the information about the last long and short position which have been open. This helps with the evaluation and documentation of the last trade.
The BitMEX Panel:
A convenient panel which shows all BitMEX contracts and their LIVE prices. The need for opening each chart goes away, the quality and experience of trading increases.
MKAST custom Signals are one of the notorious possibilities for ADVANCED strategies with MKAST.
Users who requested these features and use them frequently are the ones, having already a very unique trading strategy and they use these very custom signals as confluence or for multiple entry trades.
These custom signals and their settings can be mostly ignored by the majority of traders who are using this Algorithm.
The idea behind the grey signals has its roots in the idea of the TJ-Index. The TJ-Index being 15 Algorithms and conditions possible showing a bullish or bearish interpretation. The index counts the Algorithms which are showing a bullish interpretation.
Like that we can make sure that signals are shown in the original colour, are only those who have an additional confluence with the TJ-Index, not letting the user buy, if at least the majority is not bullish, and not letting the user sell, if at least the majority is bearish.
The custom buy and sell aggressiveness lets the user customise the MKAST algorithm even more.
Either the users wants to see how signals are changing on a different (slightly lower or higher) aggressiveness, being able to expect a change on their own settings. OR seeing that some signals of the same sort are a little out of place and is able to move these to a different aggressiveness, increasing the profitability even more.
Needless to say, custom signals are NOT a part of the Info Panel.
MKAST Label & Trendline Settings
“Show Labels?” - On/Off to show Labels above each signal, with the percentage gain or loss, calculated from the last signal to the new signal.
“Show Trendlines?” - On/Off to show automatic Trendlines following Gainzy Lines.
“Lookback Length” - Choose a length that the automatic trendiness use for calculation. Comparable to Aggressiveness.
“Wicks//Bodies” - Change between trendiness connecting from wick to wick or from body to body.
“Black lines// Coloured lines” - Change between simply black lines or changing colour lines.
“Filter Trendlines?” - On/Off to show all trendiness or just resistance decreasing and support increasing ones.
“Limit Extensions Of The Lines?” - This value increases by how much the trendiness are being extended. 0 = endless extension, otherwise 100 = maximum custom extension.MKAST Strategy “Take Profit 1” - On/Off to show TP1 points.
“Take Profit After %” - Set the percentage after which TP1 is active.
“Take Profit 2 ” - On/Off to show TP2 points.
“Take Profit 2 After %” - Set the percentage after which TP1 is
active.
“Take Profit 3” - On/Off to show TP3 points.
“Take Profit 3 After %” - Set the percentage after which TP1 is active.
“Second Entry” - On/Off to show Second Entry points.
“Second Entry After %” - Set the percentage after which Second Entry is active.
“Third Entry” - On/Off to show Third Entry points.
“Third Entry After %” - Set the percentage after which Third Entry is active.
“Stop Loss” - On/Off to show Stop Loss points.
“Stop Loss After %” - Set the percentage after which Stop Loss is active.
MKAST Strategy
To make the life of the MKAST user even easier, I have added all adjustable Take Profit Points, Multiple entry points and Stop Loss points.
I have never seen a sustainable and reliable trading strategy without TPs, Multiple entry and especially without a stop loss. Everything in the usual and fully customisable MKAST style.
Simply choose how many Take Profit points you would like to have and choose the percentage after which you would like to see the Take Profit point appear on the chart and notify you to take profits.
Are you a Trader who likes Multiple Entries? Also no problem with MKAST. Select how many additional entries you would like to have and after how many percent you would like them to appear on the chart and remind you of adding to the position.
What would a Strategy be without a Stop Loss? Same settings apply here as on the TPs and MEs.
All of the settings are able to take fractions of a number as well. This enables users to even use all of the strategy settings for scalping or FX pairs, where high leverage and the smallest of moves are used for trading.
Needless to say, all of these settings work on RENKO and Heikin Ashi as well. These might need adjustment, since the calculation is different, yet there is nothing standing in the way of it anymore.
Crypto Modified Indicators
“Show Divergences?” - On/Off to show Divergences on the Chart based on the data of 10 different Algorithms.
“Show Oversold/bought?” - On/Off to change the colour of the chart in Oversold/bought conditions.
“Oversold/bought value?” - Choose a value for which the chart is Oversold/bought.
“Show Fibonacci Levels?” - On/Off to show automatic Fibonacci Levels.
“Fibonacci Lookback Lenght” - This value states how many candles from right now are taken into account to paint the Fibonacci Levels.
“Fibonacci Custom Period” - Choose a custom Timeframe that should be used to paint the Fibonacci Levels.
“2nd-7th Fibonacci Level” - Enter a value for the Fibonacci Levels you would like to use and see on the chart.
“Plot 1.618 Level?” - On/Off for the Fibonacci extension level.
Crypto Modified Indicators
“Show Bands?” - On/Off to show the TJ-Bands on the chart.
“Bands Length” - Choose a value for the TJ-Bands Lenght
“Show Show EMA 1-3?” - On/Off to show the EMAs 1-3 on the chart.
“EMA Lenght 1-3” - Choose a value for the first to third EMA Lenght
“Show Ichimoku? ” - On/Off to show Ichimoku on the chart.
“Show Tenkin?” - On/Off to show Tenkin on the chart. “Tenkin” - Set the lenght of the Tenkin.
“Show Kijun?” - On/Off to show Kijun on the chart.
“Kijun” - Set the lenght of the Kijun.
“Show Senkou?” - On/Off to show the Senkou on the chart. “Senkou” - Set the lenght of the Senkou.
“Displacement” - Set the value of the Displacement.
“Show Chikou Span?” - On/Off to show the Chikou Span on the chart.
Crypto Custom Indicators
In the picture above, you see the first pair of Crypto Custom Indicators. The oversold and overbought conditions are highlighted.
Bullish and Bearish divergences are also plotted on the chart.
This is personally my favourite combination of Indicators and MKAST settings. It shows nicely
everything one needs to know and makes it easier to decide wether to follow a signal or not.
We here as well a perfect example of the Automatic Fibonacci Lines (Lookback 50, Timeframe 1D).
It shows all significant levels, which we can see being respected.
Orange = 23.6%, Green = 38.2%, Red = 50%, Yellow = 61.8%, Blue = 78.6%, White = 0%;100%
In this picture above, we observe the perfect ensemble of MKAST and an EMA strategy, especially modified for crypto markets.
Here, as by default, we have the EMAs at 21, 90 and 200. These have shown to be very significant moving support and resistance points in the crypto market.
In this picture above, I lowered the timeframe to show the highly significant levels of the Ichimoku. It has not the “usual values”. These here have been modified for the volatile crypto market and set as default.
An incredibly powerful tool for anyone who is ready to step up their trading game. It is a huge part of the MKAST back end and the strategy behind it.
MKAST Custom Alerts
1
MKAST without any doubt has Custom Alerts for all Signals that it is painting on the chart.
One can even choose to receive custom notifications for Take Profit points, Multiple Entry points and
the Stop Loss points.
The signals appear on the chart DURING the candle, not at the end of the candle. Therefore, the
alerts do this as well. These appear during the candle.
Here we can see all of the possible Alerts that can be chosen to be displayed. In total it is 14 different custom alerts, based on what the trader is looking for and how he is trading.
Personally, I have 10-15 coins that I trade the most and for these I have custom notifications, mostly though only the MKAST Buy/Sell and Stop Loss Signals.
To activate Alerts for MKAST,
1) Go to the “ALERT” icon on the top tool bar of your Tradingview.
2) Select “CONDITION” as “—MKAST—“
3) Then choose ONE condition from the list of conditions.
4) On “OPTIONS” you can set how many times it appears, I have “Once per Bar”.
4.1) If you want to make sure that the signal is truly there and not just a condition for a second during the candle, choose “ONCE PER BAR CLOSE”.
5) “Expiration Time” sets the time until the alert expires. PRO users have no expiration for alerts.
6) “Alert Actions” give you a row of choices what happens and how you want to be notified.
7) “Message” is the message that you receive inside the notification.
Thank you, Kong

Algorithm Builder - INDICESHello traders
I. 💎 SCRIPTS ACCESS AND TRIALS 💎
1. For the trial request access, they have to be done through my website .
2. My website URL is in this script signature at the very bottom (you'll have to scroll down a bit and going past the long description) and in my profile status available here : Daveatt
Due to the new scripts publishing house rules, I won't mention the URL here directly. As I value my partnership with TradingView very much, I prefer showing you the way for finding them :)
3. Many video tutorials explaining clearly how all our indicators work are available on your website > guides section.
4. You may also contact me directly for more information
II. 🔎 Algorithm Builder INDEX 🔎
2.1 INDEX trading
Let's start with a quick definition.
Index Trading is a type of trading of a group of stocks that make up the index. An Index is a measurement of the value of a section of the stock market. It is computed from the prices of selected stocks. It may also be referred to as a group of stock market publicly-listed uppermost businesses within a region. There are numerous Stock Market Indices within the world such as Dow Jones/SPX500 (USA), DAX (Germany), S&P/ASX 200 (Australia), FTSE100 (London), CAC 40 (France), AEX index (Amsterdam), IBEX 35 and more.
2.2 🔗 Which brokers are compatible? 🔗
⚠️⚠️Please note we mostly tested those signals with FXCM broker.
You may use a different broker but you have to make sure your broker has a similar price quote with at most 2/3 pips difference with FXCM.
We chose a broker where the spreads are among the lowest across the board.
Disclaimer : we're not affiliated in any way with them.
2.3 Concept
This indicator is born because we identified 2 types of traders :
1) Those who want to play with the indicators and discover a sound system by themselves.
That's why we made the Algorithm Builders (Singles/Multiples) + Backtest suites
2) Those who want to be guided way more and get signals that actually are very coherent AND without too much configuration on their end.
We're very aware that this point is a big claim and to prove how confident we are with our Algorithm Builder (INDEX), we're sharing on TradingView the signals given by the tool at the end of each day.
Our new PREMIUM customers automatically get a 3 weeks trial to try out all of our indicators and see themselves how they perform.
We could show you all the track records/backtests in the world (which could easily be faked with very optimistic setups or photoshop) - instead, we'd like YOU to try our products yourselves during your Trial - as this would be the best proof you could ever get that our indicators could help your trading.
III. 🔅 The INDEX Framework 🔅
ALL signals are displayed because they have to be taken (unless invalidated or risk too big) because we cannot know before what signal will lead to big profits versus get invalidated.
Those signals were made such as :
- in case of a risk of losing capital, we would lose a small amount thanks to the invalidations/hard exits.
- give only signals where the Risk-to-reward is decent enough and the risk is not disproportioned compared to the potential reward.
- NOT a guarantee at all but we made those signals such as they'll reward the traders with about 30/50 pips gains per trade.
Assuming the Algo INDEX gives 5 trades a day and you applied it on 3 indexes and 1 trade per index is a loss (= likely invalidated with a small loss - a Stop Loss could always happen but we designed it to prevent those from happening), then we're not aware of any other trading method/system beating that on index trading. Period.
And we're actively monitoring what the competition is doing on a daily basis always to stay ahead.
I'll explain below which market condition is riskier and how to act (which is better than usually reacting in trading or in life in general).
IV. 📜 The 10 Commandments 📜
1️⃣ You shall read our guide on our website and look at the video tutorial .
URL available on this script signature (you'll have to scroll down a bit and going past the long description) and in my profile status.
I give way more details there and won't give too much info here because it will make this script description way too long.
2️⃣ You shall follow the method religiously and trade like a “MACHINE” .
All graphical elements displayed on the chart by our indicator is useful (= to be used) and has been thought of, tested and traded with for years.
We know that adopting someone else's method is a huge leap of faith but it's required sometimes to ask our clients to trust us.
3️⃣ You must always consider the supports and resistances.
We know it could be surprising to see so many S/R displayed by the indicator but you'll have to trust us on the following claim: They're all important and must be considered before entering a trade or not
4️⃣ You must Not change the recommended chart timeframe.
Even if the chart timeframe is 1 minute, the sub-indicators used are very smoothed and based on indicators in 15/30/1h timeframes.
Entering in a 1 min chart allows to enter sooner and this combined with multi timeframes indicators allows to enter when a trend is confirmed.
5️⃣ You Must NOT trade anything else than indexes with this indicator.
As said before, we're working really hard on releasing a similar assisted trading framework for cryptocurrencies and other asset classes (FOREX, COMMODITIES, ...) and we aim to release the Algo Builder CRYPTO before the end of this year.
We started with the ALGO INDEX because it's our specialty, there is a ton of liquidity in that market and a lot of traders asked for it - we would say almost as close as the number of traders asking us for an ALGO CRYPTO framework.
6️⃣ You shall know the Leading Trend displayed on your chart
- Signal in the same direction of the leading trend: i.e. green signal on a green chart background and red signal on a red chart background.
- Signal given regardless of the leading trend direction.
In other words, green/red signal may be displayed on either background color (green/red)
In that scenario, we recommend waiting for a pullback near the EMA(20) and set your SL to breakeven quickly.
⚠️ To be clear; ALL signals should be taken but those against the trend could require a pullback as explained above.
7️⃣ You shall know your trading profile
Trend confirmation when entering against the leading trend: You'll also notice that the leading trend is real and strong.
Let's assume a trader enters in a LONG position/RED background and then the chart background turns GREEN at some point later on.
You'll often see that this "event" will confirm even more the trend direction and that's when the trend could very likely accelerate.
8️⃣ You will embrace the Hard Exits philosophy.
The framework won't work as well as expected without them.
It's even the most important "commandment" and it requires to be rigorous and throw away to the bin whatever we might think and feel.
Not exiting a signal when invalidated because you feel differently will not work.
9️⃣ You must know the Risk and Money Management basis.
Each market is unique and cannot possibly be traded the same way.
We're happy to provide a few guidelines for the INDEX market just below.
- Know your macro events with the daily economic calendar.
- Stay consistent with your position sizing
- Stay consistent with your trade management
🔟 You Shall Test and Make your Own Conclusions.
You have a FREE TRIAL period to test because we know that many traders aren't full-time traders and have a family/job/life outside trading.
So take your time to visually backtest the signals, trade with small positions, follow our rules and learn from your own experience.
While we keep saying "do this, do that", we're not dogmatic at all and we welcome any feedback you might have that could benefit the community and we'll likely integrate it if we see a good value in your idea.
You can submit an idea/feedback/comment by contacting me directly.
V. 🧰 Features 🧰
5.1 Supports and Resistances
The indicator displays the main algorithmic supports and resistances according to our trading method for INDEX.
5.2 Choose your favorite risk management algorithm
1/ Pre-defined and recommended mode for this INDEX framework - Algo S/R method using:
- the nearest algorithmic resistances for the take profit levels.
2/ Define your own Stop-loss and Take-profits level in real-time
Stop-Loss Management
For what's following, let's assume that 2 is the stop-loss value you inserted in the indicator, and the Algorithm Builder gives a BUY signal.
This is NOT a recommendation at all, only an example to explain how this feature works.
- %Trailing: The Stop-Loss starts 2% away from the entry price - and will move up (because we're on a BUY trade as per our example) every time your trade will gain 2% profit
- Percentage: The Stop-Loss stays static 2% away from the entry price. There is no trailing here
- TP Trailing: This is a very awesome feature. The stop-loss is set 2% away when the trades start.
When the TP1 is hit, the stop-loss will be moved to the Entry price (also called breakeven).
When the TP2 is hit, the SL is moved to the previous TP1 position
- Fixed: Set the Stop-Loss at a fixed position (value should be in currency/units)
Take Profits Management
You can manage up to 2 take profit levels defined as a percentage or price value.
The expected input is in percentage value (for instance, setting the % target of TP1 to 2% will set the TP1 level 2% away from the entry price
5.3 Built-in Trade Manager
This is very likely the most loved utility script that we shared on TradingView.
It's included in your Algorithm Builder - Single Trend+, and will certainly help you immensely to analyze your charts and your trades.
We made sure that all the graphical elements on the chart will be updated in real-time whenever our user change anything on the indicator configuration.
You'll also be able to change the Trade Manager labels positions as you wish :)
5.4 Built-in Risk-to-Reward Panel
The good stuff doesn't stop here.
You'll notice that this sometimes green (when in a LONG), sometimes red (when in a SHORT) panel at the right of your chart.
It displays for the selected trading algorithmic (see 2.3.2 above), a ton of useful real-time analytics.
- Entry Price: the price when the Algorithm Builder will give a signal.
- The Trade PnL in percentage.
- Entry Stop Loss: Distance (in currency/units) between the selected stop-loss algorithm (percent, trailing, TP trailing, etc.) and the entry price.
- Entry TP1: Distance (in currency/units) between the entry price and the first take profit
- Entry TP2: Distance (in currency/units) between the entry price and the second take profit
- Risk/Reward TP1: Using the Stop-loss distance at entry, and Take Profit 1 at entry to compute the risk-to-reward ratio.
- Risk/Reward TP2: Using the Stop-loss distance at entry, and Take Profit 2 at entry to compute the risk-to-reward ratio.
For more details, please check the guides section of my website. Links are in my signature and profile status.
5.5 Built-in PnL real-time calculations
YES!!!! you read it correctly
The panel displays the risk-to-reward ratios but also the PnL (Profit and Loss in percentage value) of the current and last trade
VI. 🔔 Alerts 🔔
We enabled the alerts on the:
1. Main BUY/SELL entries
3. Exit Signals such as stop-loss, take-profit, hard-exits
VII. 🧬 Compatible with trading bots?🧬
I'm very aware of all existing solutions out there allowing us to capture the TradingView alerts (Instabot, ProfitView, ...) and forwarding them to the brokers to automatize your trading.
You'll find a more detailed answer on our website.

Assisted framework with the Algorithm Builder - INDEXHello traders
I. 💎 SCRIPTS ACCESS AND TRIALS 💎
1. For the trial request access, they have to be done through my website .
2. My website URL is in this script signature at the very bottom (you'll have to scroll down a bit and going past the long description) and in my profile status available here : Daveatt
Due to the new scripts publishing house rules, I won't mention the URL here directly. As I value my partnership with TradingView very much, I prefer showing you the way for finding them :)
3. Many video tutorials explaining clearly how all our indicators work are available on your website > guides section.
4. You may also contact me directly for more information
II. 🔎 Algorithm Builder INDEX 🔎
2.1 INDEX trading
Let's start with a quick definition.
Index Trading is a type of trading of a group of stocks that make up the index. An Index is a measurement of the value of a section of the stock market. It is computed from the prices of selected stocks. It may also be referred to as a group of stock market publicly-listed uppermost businesses within a region. There are numerous Stock Market Indices within the world such as Dow Jones/SPX500 (USA), DAX (Germany), S&P/ASX 200 (Australia), FTSE100 (London), CAC 40 (France), AEX index (Amsterdam), IBEX 35 and more.
2.2 🔗 Which brokers are compatible? 🔗
⚠️⚠️Please note we mostly tested those signals with FXCM broker.
You may use a different broker but you have to make sure your broker has a similar price quote with at most 2/3 pips difference with FXCM.
We chose a broker where the spreads are among the lowest across the board.
Disclaimer : we're not affiliated in any way with them.
2.3 Concept
This indicator is born because we identified 2 types of traders :
1) Those who want to play with the indicators and discover a sound system by themselves.
That's why we made the Algorithm Builders (Singles/Multiples) + Backtest suites
2) Those who want to be guided way more and get signals that actually are very coherent AND without too much configuration on their end.
We're very aware that this point is a big claim and to prove how confident we are with our Algorithm Builder (INDEX), we're sharing on TradingView the signals given by the tool at the end of each day.
Our new PREMIUM customers automatically get a 3 weeks trial to try out all of our indicators and see themselves how they perform.
We could show you all the track records/backtests in the world (which could easily be faked with very optimistic setups or photoshop) - instead, we'd like YOU to try our products yourselves during your Trial - as this would be the best proof you could ever get that our indicators could help your trading.
III. 🔅 The INDEX Framework 🔅
ALL signals are displayed because they have to be taken (unless invalidated or risk too big) because we cannot know before what signal will lead to big profits versus get invalidated.
Those signals were made such as :
- in case of a risk of losing capital, we would lose a small amount thanks to the invalidations/hard exits.
- give only signals where the Risk-to-reward is decent enough and the risk is not disproportioned compared to the potential reward.
- NOT a guarantee at all but we made those signals such as they'll reward the traders with about 30/50 pips gains per trade.
Assuming the Algo INDEX gives 5 trades a day and you applied it on 3 indexes and 1 trade per index is a loss (= likely invalidated with a small loss - a Stop Loss could always happen but we designed it to prevent those from happening), then we're not aware of any other trading method/system beating that on index trading. Period.
And we're actively monitoring what the competition is doing on a daily basis always to stay ahead.
I'll explain below which market condition is riskier and how to act (which is better than usually reacting in trading or in life in general).
IV. 📜 The 10 Commandments 📜
1️⃣ You shall read our guide on our website and look at the video tutorial .
URL available on this script signature (you'll have to scroll down a bit and going past the long description) and in my profile status.
I give way more details there and won't give too much info here because it will make this script description way too long.
2️⃣ You shall follow the method religiously and trade like a “MACHINE” .
All graphical elements displayed on the chart by our indicator is useful (= to be used) and has been thought of, tested and traded with for years.
We know that adopting someone else's method is a huge leap of faith but it's required sometimes to ask our clients to trust us.
3️⃣ You must always consider the supports and resistances.
We know it could be surprising to see so many S/R displayed by the indicator but you'll have to trust us on the following claim: They're all important and must be considered before entering a trade or not
4️⃣ You must Not change the recommended chart timeframe.
Even if the chart timeframe is 1 minute, the sub-indicators used are very smoothed and based on indicators in 15/30/1h timeframes.
Entering in a 1 min chart allows to enter sooner and this combined with multi timeframes indicators allows to enter when a trend is confirmed.
5️⃣ You Must NOT trade anything else than indexes with this indicator.
As said before, we're working really hard on releasing a similar assisted trading framework for cryptocurrencies and other asset classes (FOREX, COMMODITIES, ...) and we aim to release the Algo Builder CRYPTO before the end of this year.
We started with the ALGO INDEX because it's our specialty, there is a ton of liquidity in that market and a lot of traders asked for it - we would say almost as close as the number of traders asking us for an ALGO CRYPTO framework.
6️⃣ You shall know the Leading Trend displayed on your chart
- Signal in the same direction of the leading trend: i.e. green signal on a green chart background and red signal on a red chart background.
- Signal given regardless of the leading trend direction.
In other words, green/red signal may be displayed on either background color (green/red)
In that scenario, we recommend waiting for a pullback near the EMA(20) and set your SL to breakeven quickly.
⚠️ To be clear; ALL signals should be taken but those against the trend could require a pullback as explained above.
7️⃣ You shall know your trading profile
Trend confirmation when entering against the leading trend: You'll also notice that the leading trend is real and strong.
Let's assume a trader enters in a LONG position/RED background and then the chart background turns GREEN at some point later on.
You'll often see that this "event" will confirm even more the trend direction and that's when the trend could very likely accelerate.
8️⃣ You will embrace the Hard Exits philosophy.
The framework won't work as well as expected without them.
It's even the most important "commandment" and it requires to be rigorous and throw away to the bin whatever we might think and feel.
Not exiting a signal when invalidated because you feel differently will not work.
9️⃣ You must know the Risk and Money Management basis.
Each market is unique and cannot possibly be traded the same way.
We're happy to provide a few guidelines for the INDEX market just below.
- Know your macro events with the daily economic calendar.
- Stay consistent with your position sizing
- Stay consistent with your trade management
🔟 You Shall Test and Make your Own Conclusions.
You have a FREE TRIAL period to test because we know that many traders aren't full-time traders and have a family/job/life outside trading.
So take your time to visually backtest the signals, trade with small positions, follow our rules and learn from your own experience.
While we keep saying "do this, do that", we're not dogmatic at all and we welcome any feedback you might have that could benefit the community and we'll likely integrate it if we see a good value in your idea.
You can submit an idea/feedback/comment by contacting me directly.
V. 🧰 Features 🧰
5.1 Supports and Resistances
The indicator displays the main algorithmic supports and resistances according to our trading method for INDEX.
5.2 Choose your favorite risk management algorithm
1/ Pre-defined and recommended mode for this INDEX framework - Algo S/R method using:
- the nearest algorithmic resistances for the take profit levels.
2/ Define your own Stop-loss and Take-profits level in real-time
Stop-Loss Management
For what's following, let's assume that 2 is the stop-loss value you inserted in the indicator, and the Algorithm Builder gives a BUY signal.
This is NOT a recommendation at all, only an example to explain how this feature works.
- %Trailing: The Stop-Loss starts 2% away from the entry price - and will move up (because we're on a BUY trade as per our example) every time your trade will gain 2% profit
- Percentage: The Stop-Loss stays static 2% away from the entry price. There is no trailing here
- TP Trailing: This is a very awesome feature. The stop-loss is set 2% away when the trades start.
When the TP1 is hit, the stop-loss will be moved to the Entry price (also called breakeven).
When the TP2 is hit, the SL is moved to the previous TP1 position
- Fixed: Set the Stop-Loss at a fixed position (value should be in currency/units)
Take Profits Management
You can manage up to 2 take profit levels defined as a percentage or price value.
The expected input is in percentage value (for instance, setting the % target of TP1 to 2% will set the TP1 level 2% away from the entry price
5.3 Built-in Trade Manager
This is very likely the most loved utility script that we shared on TradingView.
It's included in your Algorithm Builder - Single Trend+, and will certainly help you immensely to analyze your charts and your trades.
We made sure that all the graphical elements on the chart will be updated in real-time whenever our user change anything on the indicator configuration.
You'll also be able to change the Trade Manager labels positions as you wish :)
5.4 Built-in Risk-to-Reward Panel
The good stuff doesn't stop here.
You'll notice that this sometimes green (when in a LONG), sometimes red (when in a SHORT) panel at the right of your chart.
It displays for the selected trading algorithmic (see 2.3.2 above), a ton of useful real-time analytics.
- Entry Price: the price when the Algorithm Builder will give a signal.
- The Trade PnL in percentage.
- Entry Stop Loss: Distance (in currency/units) between the selected stop-loss algorithm (percent, trailing, TP trailing, etc.) and the entry price.
- Entry TP1: Distance (in currency/units) between the entry price and the first take profit
- Entry TP2: Distance (in currency/units) between the entry price and the second take profit
- Risk/Reward TP1: Using the Stop-loss distance at entry, and Take Profit 1 at entry to compute the risk-to-reward ratio.
- Risk/Reward TP2: Using the Stop-loss distance at entry, and Take Profit 2 at entry to compute the risk-to-reward ratio.
For more details, please check the guides section of my website. Links are in my signature and profile status.
5.5 Built-in PnL real-time calculations
YES!!!! you read it correctly
The panel displays the risk-to-reward ratios but also the PnL (Profit and Loss in percentage value) of the current and last trade
VI. 🔔 Alerts 🔔
We enabled the alerts on the:
1. Main BUY/SELL entries
3. Exit Signals such as stop-loss, take-profit, hard-exits
VII. 🤖 Compatible with trading bots? 🤖
I'm very aware of all existing solutions out there allowing us to capture the TradingView alerts (Instabot, ProfitView, ...) and forwarding them to the brokers to automatize your trading.
You'll find a more detailed answer on our website.
If you have any doubt or question, please hit me up directly or ask in the comments section of this script.
I'll never claim I have the best trading methodology or the best indicators.
You only will judge and I'll appreciate all the questions and feedback you're sending my way.
They help me a ton to develop indicators based on all the requests I received.
Kind regards,
Dave

CryptoVN - Automated Trading System with Buy/Sell signalsTrading System:
Heiken Ashi candle
CCI
Double MA for HA Smoothed
An improved version for
Here's an backtest:
Who's paid and joined to beta testing for that version will be free update to this version.
If you like and want to try this, tips and donations are always welcome. :)
Bitcoin: 3BMEXfdqNNmVmtHYvZ1HqMyXchAGLUrbqF
(*) My Advice to You:
- The Trend Is Your Friend. TRADE WHAT YOU SEE, NOT WHAT YOU THINK.
Happy Trading Life ^^!
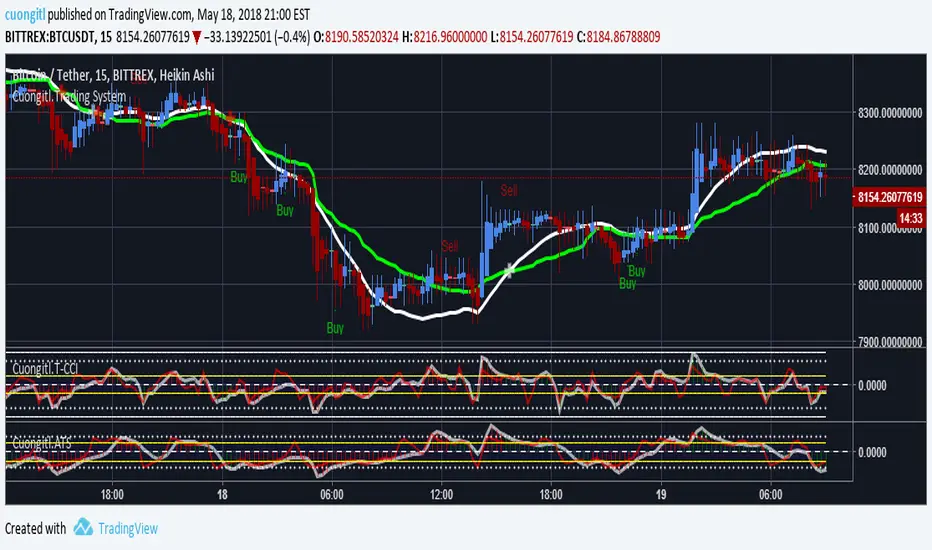
Structure Break ModelMAIN FEATURES
Supported Assets & Timeframe
This indicator is specifically designed and calibrated for 30 USDT trading pairs on the H4 timeframe, all of which have been actively traded for over 1,000 days, including:
BTCUSDT, ETHUSDT, XRPUSDT, BNBUSDT, SOLUSDT, TRXUSDT, DOGEUSDT, ADAUSDT, XLMUSDT, BCHUSDT,
ZECUSDT, LINKUSDT, HBARUSDT, UNIUSDT, LTCUSDT, AVAXUSDT, SHIBUSDT, DOTUSDT, AAVEUSDT, NEARUSDT,
ETCUSDT, ICPUSDT, FILUSDT, APTUSDT, ENSUSDT, ATOMUSDT, VETUSDT, QNTUSDT, CRVUSDT, INJUSDT
Using the script on other pairs or timeframes will trigger an automatic warning to prevent incorrect usage.
1. Structural Weakening Model (Core Logic)
At the heart of the system lies the Structural Weakening Model (SWM) — a multi-layered market-structure engine that identifies momentum exhaustion and confirms genuine reversals using pivot-based swing architecture.
Pivot Structure Mapping
The indicator continuously analyzes Pivot Highs and Pivot Lows (length = 5) to establish clean, stable swing structure.
Weakening Pattern Detection
The model evaluates directional fatigue by detecting pivot sequences:
2–6 Higher Lows → Weakening buyers → Potential SELL setup
2–6 Lower Highs → Weakening sellers → Potential BUY setup
This mechanism identifies “compression zones” where market pressure fades before a structural shift.
Breakout Confirmation Layer
A signal is only triggered when price breaks the final structural anchor of the pivot chain.
This ensures:
Optional Trend Filter (MA Alignment)
Users may select EMA, SMA, WMA, HMA and more.
Price above MA → BUY-only mode
Price below MA → SELL-only mode
This keeps signals aligned with broader market flow.
Visual Example – SELL Signal (TP Hit)
2. Signal Conditions (How the System Works)
SELL Setups
Triggered when:
Price forms 2–6 higher lows, signaling weakening buyers
Price breaks below the structural pivot anchor
(Optional) Price is below the MA filter
BUY Setups
Triggered when:
Price forms 2–6 lower highs, signaling weakening sellers
Price breaks above the structural pivot anchor
(Optional) Price is above the MA filter
Visual Example – SELL Signal (SL Hit)
3. Automatic Capital Management
The script integrates full risk-management utilities:
Starting capital (default 10,000 USDT)
Risk % per trade
Leverage (x10 → x100)
Automatic position sizing
Margin requirements
Real-time TP/SL calculations
This turns the indicator into not just a signal tool, but a complete trading assistant.
4. Flexible Stop-Loss System
Users may choose:
Swing-based SL (nearest structural pivot)
Fixed SL %
Custom TP based on R:R (1:1.5 → 1:5)
Default R:R = 1:2
SL/TP levels update instantly whenever settings change.
Input Settings Menu
5. Visual Interface
The chart displays:
Entry, TP, SL (extended 20 candles)
BUY/SELL labels
Real-time TP/SL hit status
Full info panel:
Latest signal
Entry price
TP/SL
Leverage
Risk %
Required margin
Win/loss & R statistics
Days on chart: The total number of trading days calculated from your chart’s visible data
All signals follow the exact same logic in historical and real-time charts.
Zero repainting.
6. Internal Backtest Engine (Not Official TradingView Backtesting)
The script includes an internal backtest calculator that evaluates:
SL methods
TP R:R settings
Signal quality
Aggregate R performance
⚠ This is an internal calculation tool, not the official TradingView Strategy Tester.
Its purpose is to help users understand how different settings behave when applied to past data.
7. 1-Day Free Trial
Users may message the author on TradingView to request:
1-day trial access
Ability to test signals in real-time
Compare different SL/RR settings
Verify that the indicator does not repaint
Inspect how the engine behaves on the supported 30-coin dataset
This allows users to evaluate the tool transparently before subscribing.
8. Market Coverage & Deep Backtest Basis This indicator is calibrated on the 30 largest USDT pairs, providing a deep historical dataset with stable liquidity and clearer structural swings. The long backtest range and high signal density help reduce noise and ensure more consistent behavior across different market conditions.
⚠ Disclaimer
This indicator is a quantitative analysis tool created for educational purposes only.
All “optimal settings” are derived from historical market behavior and do not guarantee future performance.
Market conditions change, and every trader must apply independent risk management.
Trading involves risk.
Use responsibly.

EMD Trend [InvestorUnknown]EMD Trend is a dynamic trend-following indicator that utilizes Exponential Moving Deviation (EMD) to build adaptive channels around a selected moving average. Designed for traders who value responsive trend signals with built-in volatility sensitivity, this tool highlights directional bias, market regime shifts, and potential breakout opportunities.
How It Works
Instead of using standard deviation, EMD Trend employs the exponential moving average of the absolute deviation from a moving average—producing smoother, faster-reacting upper and lower bounds:
Bullish (Risk-ON Long): Price crosses above the upper EMD band
Bearish (Risk-ON Short): Price crosses below the lower EMD band
Neutral: Price stays within the channel, indicating potential mean reversion or low momentum
Trend direction is defined by price interaction with these bands, and visual cues (color-coded bars and fills) help quickly identify market conditions.
Features
7 Moving Average Types: SMA, EMA, HMA, DEMA, TEMA, RMA, FRAMA
Custom Price Source: Choose close, hl2, ohlc4, or others
EMD Multiplier: Controls the width of the deviation envelope
Bar Coloring: Candles change color based on current trend
Intra-bar Signal Option: Enables faster updates (with optional repainting)
Speculative Zones: Fills highlight aggressive momentum moves beyond EMD bounds
Backtest Mode
Switch to Backtest Mode for performance evaluation over historical data:
Equity Curve Plot: Compare EMD Trend strategy vs. Buy & Hold
Trade Metrics Table: View number of trades, win/loss stats, profits
Performance Metrics Table: Includes CAGR, Sharpe, max drawdown, and more
Custom Start Date: Select from which date the backtest should begin
Trade Sizing: Configure capital and trade percentage per entry
Signal Filters: Choose from Long Only, Short Only, or Both
Alerts
Built-in alerts let you automate entries, exits, and trend transitions:
LONG (EMD Trend) - Trend flips to Long
SHORT (EMD Trend) - Trend flips to Short
RISK-ON LONG - Price crosses above upper EMD band
RISK-OFF LONG - Price crosses back below upper EMD band
RISK-ON SHORT - Price crosses below lower EMD band
RISK-OFF SHORT - Price crosses back above lower EMD band
Use Cases
Trend Confirmation with volatility-sensitive boundaries
Momentum Entry Filtering via breakout zones
Mean Reversion Avoidance in sideways markets
Backtesting & Strategy Building with real-time metrics
Disclaimer
This indicator is intended for informational and educational purposes only. It does not constitute investment advice. Historical performance does not guarantee future results. Always backtest and use in simulation before live trading.

Hyperbolic Tangent SuperTrend [InvestorUnknown]The Hyperbolic Tangent SuperTrend (HTST) is designed for technical analysis, particularly in markets with assets that have lower prices or price ratios. This indicator leverages the Hyperbolic Tangent Moving Average (HTMA), a custom moving average calculated using the hyperbolic tangent function, to smooth price data and reduce the impact of short-term volatility.
Hyperbolic Tangent Moving Average (HTMA):
The indicator's core uses a hyperbolic tangent function to calculate a smoothed average of the price. The HTMA provides enhanced trend-following capabilities by dampening the impact of sharp price swings and maintaining a focus on long-term market movements.
The hyperbolic tangent function (tanh) is commonly used in mathematical fields like calculus, machine learning and signal processing due to its properties of “squashing” inputs into a range between -1 and 1. The function provides a non-linear transformation that can reduce the impact of extreme values while retaining a certain level of smoothness.
tanh(x) =>
e_x = math.exp(x)
e_neg_x = math.exp(-x)
(e_x - e_neg_x) / (e_x + e_neg_x)
The HTMA is calculated by taking the difference between the price and its simple moving average (SMA), applying a multiplier to control sensitivity, and then transforming it using the hyperbolic tangent function.
htma(src, len, mul) =>
tanh_src = tanh((src - ta.sma(src, len)) * mul) * ta.stdev(src, len) + ta.sma(src, len)
htma = ta.sma(tanh_src, len)
Important Note: The Hyperbolic Tangent function becomes less accurate with very high prices. For assets priced above 100,000, the results may deteriorate, and for prices exceeding 1 million, the function may stop functioning properly. Therefore, this indicator is better suited for assets with lower prices or lower price ratios.
SuperTrend Calculation:
In addition to the HTMA, the indicator includes an Average True Range (ATR)-based SuperTrend calculation, which helps identify uptrends and downtrends in the market. The SuperTrend is adjusted dynamically using the HTMA to avoid false signals in fast-moving markets.
The ATR period and multiplier are customizable, allowing users to fine-tune the sensitivity of the trend signals.
pine_supertrend(src, calc_price, atrPeriod, factor) =>
atr = ta.atr(atrPeriod)
upperBand = src + factor * atr
lowerBand = src - factor * atr
prevLowerBand = nz(lowerBand )
prevUpperBand = nz(upperBand )
lowerBand := lowerBand > prevLowerBand or calc_price < prevLowerBand ? lowerBand : prevLowerBand
upperBand := upperBand < prevUpperBand or calc_price > prevUpperBand ? upperBand : prevUpperBand
int _direction = na
float superTrend = na
prevSuperTrend = superTrend
if na(atr )
_direction := 1
else if prevSuperTrend == prevUpperBand
_direction := calc_price > upperBand ? -1 : 1
else
_direction := calc_price < lowerBand ? 1 : -1
superTrend := _direction == -1 ? lowerBand : upperBand
Inbuilt Backtest Mode:
The HTST includes an inbuilt backtest mode that enables users to test the indicator's performance against historical data, similar to TradingView strategies.
The backtest mode allows you to compare the performance of different indicator settings with a simple buy and hold strategy to assess its effectiveness in different market conditions.
Hint Table for Display Modes:
The indicator includes a Hint Table that recommends the best pane to use for different display modes. For example, it suggests using the "Overlay" mode in the same pane as the price action, while the "Backtest Mode" is better suited for a separate pane. This ensures a more organized and clear visual experience.
The Hint Table appears as a small table at the bottom of the chart with easy-to-follow recommendations, ensuring the best setup for both visual clarity and indicator functionality.
With these features, the Hyperbolic Tangent SuperTrend Indicator offers traders a versatile and customizable tool for analyzing price trends while providing additional functionalities like backtesting and display mode hints for optimal usability.
[TTI] Lifecycle Trade: Sell Rules v2––––HISTORY & CREDITS 🏦
This script is based on the IPO Trading Lifecycle Trade Methodology by Kathy Donnelly and her team. It provides an implementation of their research on effective buy and sell rules for IPOs and Super Growth Stocks. The goal of this script is to help traders identify the best-performing sell rules, such as Ascender, Midterm, 40-Week, and Everest after they buy from IPO base. Henceforth these rules are used for IPO trading.
––––WHAT IT DOES 💡
1. Based on the methodology from the Lifecycle trade book, the script implements the best-performing sell rules (Ascender, Midterm, 40-Week, and Everest) based on profits, drawdowns, and time-in-market.
More details about the rules in section .
• Everest Rule = comprises of 9 conditions for triggering and 3 conditions for exiting
• Ascender Rule = comprises of 3 exit Rules for 3 different exit points
• Midterm Rules = uses 2 different scenarios (rules for trades less than 1 year and those after 1 year)
• 40 week Rules = use price action around the 40 week to determine exit rules
2. There is a table with the performance of these rules (backtested). The table can be positioned where the user wants in the chart and can view the performance of the Sell Rules either by horizontally by Rule or vertically by IPO Chart Pattern (Rocket Ship, Late Boomer, One Hit Wonder, Pump and Dump or Stair Stepper).
––––HOW TO USE IT 🔧
1. Apply the script to your chart and choose your trade start date.
2. Watch for highlighted the sell rules (Ascender, Midterm, 40-Week, and Everest) to exit trades in a disciplined and systematic manner. If an exit rule triggeres it will be displayed on the chart. Buy points are not included in the script!
3. Adjust for your trading style, timeframe, and risk tolerance according to your preferences and the script's output. The rules utilize Short term, Mid Term and Long Term investors.
• Short Term Rules = Everest Rule, Ascender Rule
• Mid Term Rules = Midterm Rule
• Long Term Rules = Everest, 40 Week Rule
––––DETAILS ON THE RULES 📚
These rules use two main criteria to trigger- Price and Volume. Price is interpreted by how much the stock gains or loses in a given time period, wether it is printing consecutive up days or if it is has large gap ups that have not been unclosed.
Some of the techniques implement backtested thresholds like number of unfilled gap up in the last 10 days or when have largest volume or largest dollar gain happened relative to the IPO price. The rules also implement things like how many days have the stock been up for the last 10 days or if there are any large gaps +5% that have not been unfilled. Another signal that is being used is if we have had the largest $ gain since the stocks history in a given period. Volume is used to determine if there has been a significant volume influx since the IPO date of the history if so, this triggers a rule. Some rules are time based and look for specific price action during the history of the stock for instance certain rules are required in the first 252 days of the trading history and certain rules are required after the first 252 days of the price history. We are also employing closing under important moving averages as a guide wether or not a stock should be sold. Another technique is to see how much total gain has the stock moved. THis is important for RocketShip patterns. If it has made +500% moves this would trigger certain sell rules. Price analysis is also being used on higher timeframes. For instance if a stock moves below certain important levels in 2 consecutive weeks then this would trigger a violation of the setup.
The Table of results that can be turned on and off shows the backtesting results of the performance of the different 4 rules across the 5 main IPO trading patterns from the Lifecycle trade mechanism (Rocket Ship, Late Boomer, One Hit Wonder, Pump and Dump or Stair Stepper). The Table shows across the 600 IPOs that have been studies what has been the average Gain (%) for each exit rule for each IPO Pattern and what has been the $ DrawDown for the same rule per IPO Pattern. This information is very useful to have on chart in order to decide which exit rules best match the given IPO pattern that you are looking at.
!!Always use proper risk management and position sizing!!
Please note that this script is intended for educational purposes and should not be considered as financial advice. Past performance is not indicative of future results, and every trader should carefully consider their trading strategy and risk tolerance before entering any trade.

Drip's 11am rule breakout/breakdown (OG)This indicator is based on Drippy2hard's 11:30 am (EST) rule.
In simple terms the rule states that:
If a trending stock makes a new high after 11:15-11:30am EST, there is a 75% chance of closing within 1% of High of day (HOD). Same applies for downtrend.
Please note:
Not all stocks will abide by this, this is backtested on stocks with avg daily volume > 2M and mostly mega cap stocks which have liquid option chains. The backtesting results show very promising results on $SPY/ $SPX so it is advised to trade $SPY/ $SPX using this indicator over any other stocks.
Although the name suggests 11 AM rule, the backtesting shows higher win rate for 11:30 AM so please select that option in the settings.
As always, no indicator is perfect and please follow your risk management and understand that indicators are tools to aid your trading and by no means they are supposed to work as intended in all scenarios
How the script works
1. A HOD/LOD zone is identified based on regular session (9:30am-11:30am) EST. Users can select cut off time to 11AM in the settings. These will be indicated on chart after 11/11:30pm depending on what user selected
2. If the stock breaks above the HOD and the ADX is showing strong momentum to upside then the candlesticks will start showing neon color, if the trend based on moving averages and candle closing is also bullish then the indicator will show trend arrows under the candle indicating to stay in the trade. Same applies for break below LOD, only the colors will change to represent downtrend.
3. An optional cloud is also shown if the trend is developed. The cloud can be used as trail stop or re entry point as long as it is displayed on chart
How to use the indicator in trading
In general, there are three scenarios which are trade worthy
1. If the stocks breaks out above the HOD zone and up trend develops or the stocks breaks below the LOD zone and downtrend develops. See images below
2. You can also use the LOD/HOD zone as demand/ supply if the Price action is range bound like this example below
Thanks for reading, please give thumbs up if you like using it! Please post comments on how to use it.

R:R Trading System FrameworkFirst off, huge thanks to @fikira! He was able to adapt what I built to work much more efficiently, allowing for more strategies to be used simultaneously. Simply put, I could not have gotten to this point without you. Thanks for what you do for the TV community. Second, I am fairly new to pinescript writing, so I welcome criticism, thoughtful input and improvement suggestions. I would love to grow this concept into something even better, if possible. So please let me know if you have any ideas for improvement. However I do juggle a lot of different things outside of TV, so implementations may be delayed.
I have decided, at this time, not to add alerts. First, because I feel most people looking to adapt this framework can add their own pretty easily. Also, given how customized the framework is currently, while also attempting to account for all the possible ways in which people may want alerts to function after they customize it, it seems best to leave them out as it doesn't exactly fit the idea of a framework.
For best viewing, I recommend hovering over the script's name > ... > Visual order > Bring to front. Also I found hollow candles with mono-toned colors (like pictured) are more visually appealing for me personally. I HIGHLY RECOMMEND USING WITH BAR REPLAY TO BETTER UNDERSTAND THE FRAMEWORK'S FUNCTIONALITY.
▶️ WHAT THIS FRAMEWORK IS
- A huge collection of concepts and capabilities for those trying to better understand, learn, or teach pinescript.
- A system designed to showcase Risk:Reward concepts more holistically by providing all of the most popular components of retail trading to include backtesting, trade visual plotting, position tracking, market condition shifts, and useful info while positioned to help highlight changes in your risk:reward based decision-making processes.
- A system that can showcase individual strategies regardless of trade direction, allowing you to develop hedging strategies without having multiple indicators that do not correlate with each other.
- Designed around the idea that you trade less numbers of assets but manage your positions and risk based on multiple concurrently running strategies to manage your risk exposure and reward potential.
- An attempt to combine all the things you need to execute with an active trading management style.
- A framework that uses backtested results (in this case the number of averaged bars it takes to hit key levels) in real-time to inform your risk:reward decision-making while in-trade (in this case in your Trade Tracking Table using dynamic color to show how you might be early, on-time, or late compared to the average amount of backtested time it normally takes to hit that specific key level).
▶️ WHAT THIS FRAMEWORK IS NOT
- A complete trading product. DO NOT USE as-is. It is a FRAMEWORK for you to generate ideas of your own and fairly easily implement your own triggering conditions in the appropriate sections of the script.
▶️ USE CASES
- If you decide you like the Stop, Target, Trailing Stop, and Risk:Reward components as-is, then just understanding how to plug in your Entry and Bullish / Bearish conditions (Triangles) and adjust the input texts to match your custom naming will be all you need to make it your own!
- If you want to adapt certain components, then this system gives you a great starting point to adapt your different concepts and ideas from.
▶️ SYSTEM COMPONENTS
- Each of the system's components are described via tooltips both in the input menu and in the tables' cells.
- Each label on the chart displays the corresponding price at those triggered conditions on hover with tooltips.
- The Trailing Stop only becomes active once it is above the Entry Price for that trade, and brightens to show it is active. The STOP line (right of price) moves once it takes over for the Entry Stop representing the level of the Trailing Stop at that time for that trade.
- The Lines / Labels to the right of price will brighten once price is above for Longs or below for Shorts. The Trade Tracking Table cells will add ☑️ once price is above for Longs or below for Shorts.
- The brighter boxes on the chart show the trades that occurred based on your criteria and are color coded for all components of each trade type to ensure your references are consistent. (Defaults are TV built-in strategies)
- The lighter boxes on the chart show the highest and lowest price levels reached during those trades, to highlight areas where improvements can be made or additional considerations can be accounted for by either adjusting Entry triggers or Bullish / Bearish triggers.
- Default Green and Red Triangles (Bullish / Bearish) default to having the same triggering condition as the Entry it corresponds to. This is to highlight either a pyramiding concept, early exit, or you can change to account for other things occurring during your trades which could help you with Stop and Target management/considerations.
TradingView and many of its community members have done a lot for me, so this is my attempt to give back.

`security()` revisited [PineCoders]NOTE
The non-repainting technique in this publication that relies on bar states is now deprecated, as we have identified inconsistencies that undermine its credibility as a universal solution. The outputs that use the technique are still available for reference in this publication. However, we do not endorse its usage. See this publication for more information about the current best practices for requesting HTF data and why they work.
█ OVERVIEW
This script presents a new function to help coders use security() in both repainting and non-repainting modes. We revisit this often misunderstood and misused function, and explain its behavior in different contexts, in the hope of dispelling some of the coder lure surrounding it. The function is incredibly powerful, yet misused, it can become a dangerous WMD and an instrument of deception, for both coders and traders.
We will discuss:
• How to use our new `f_security()` function.
• The behavior of Pine code and security() on the three very different types of bars that make up any chart.
• Why what you see on a chart is a simulation, and should be taken with a grain of salt.
• Why we are presenting a new version of a function handling security() calls.
• Other topics of interest to coders using higher timeframe (HTF) data.
█ WARNING
We have tried to deliver a function that is simple to use and will, in non-repainting mode, produce reliable results for both experienced and novice coders. If you are a novice coder, stick to our recommendations to avoid getting into trouble, and DO NOT change our `f_security()` function when using it. Use `false` as the function's last argument and refrain from using your script at smaller timeframes than the chart's. To call our function to fetch a non-repainting value of close from the 1D timeframe, use:
f_security(_sym, _res, _src, _rep) => security(_sym, _res, _src )
previousDayClose = f_security(syminfo.tickerid, "D", close, false)
If that's all you're interested in, you are done.
If you choose to ignore our recommendation and use the function in repainting mode by changing the `false` in there for `true`, we sincerely hope you read the rest of our ramblings before you do so, to understand the consequences of your choice.
Let's now have a look at what security() is showing you. There is a lot to cover, so buckle up! But before we dig in, one last thing.
What is a chart?
A chart is a graphic representation of events that occur in markets. As any representation, it is not reality, but rather a model of reality. As Scott Page eloquently states in The Model Thinker : "All models are wrong; many are useful". Having in mind that both chart bars and plots on our charts are imperfect and incomplete renderings of what actually occurred in realtime markets puts us coders in a place from where we can better understand the nature of, and the causes underlying the inevitable compromises necessary to build the data series our code uses, and print chart bars.
Traders or coders complaining that charts do not reflect reality act like someone who would complain that the word "dog" is not a real dog. Let's recognize that we are dealing with models here, and try to understand them the best we can. Sure, models can be improved; TradingView is constantly improving the quality of the information displayed on charts, but charts nevertheless remain mere translations. Plots of data fetched through security() being modelized renderings of what occurs at higher timeframes, coders will build more useful and reliable tools for both themselves and traders if they endeavor to perfect their understanding of the abstractions they are working with. We hope this publication helps you in this pursuit.
█ FEATURES
This script's "Inputs" tab has four settings:
• Repaint : Determines whether the functions will use their repainting or non-repainting mode.
Note that the setting will not affect the behavior of the yellow plot, as it always repaints.
• Source : The source fetched by the security() calls.
• Timeframe : The timeframe used for the security() calls. If it is lower than the chart's timeframe, a warning appears.
• Show timeframe reminder : Displays a reminder of the timeframe after the last bar.
█ THE CHART
The chart shows two different pieces of information and we want to discuss other topics in this section, so we will be covering:
A — The type of chart bars we are looking at, indicated by the colored band at the top.
B — The plots resulting of calling security() with the close price in different ways.
C — Points of interest on the chart.
A — Chart bars
The colored band at the top shows the three types of bars that any chart on a live market will print. It is critical for coders to understand the important distinctions between each type of bar:
1 — Gray : Historical bars, which are bars that were already closed when the script was run on them.
2 — Red : Elapsed realtime bars, i.e., realtime bars that have run their course and closed.
The state of script calculations showing on those bars is that of the last time they were made, when the realtime bar closed.
3 — Green : The realtime bar. Only the rightmost bar on the chart can be the realtime bar at any given time, and only when the chart's market is active.
Refer to the Pine User Manual's Execution model page for a more detailed explanation of these types of bars.
B — Plots
The chart shows the result of letting our 5sec chart run for a few minutes with the following settings: "Repaint" = "On" (the default is "Off"), "Source" = `close` and "Timeframe" = 1min. The five lines plotted are the following. They have progressively thinner widths:
1 — Yellow : A normal, repainting security() call.
2 — Silver : Our recommended security() function.
3 — Fuchsia : Our recommended way of achieving the same result as our security() function, for cases when the source used is a function returning a tuple.
4 — White : The method we previously recommended in our MTF Selection Framework , which uses two distinct security() calls.
5 — Black : A lame attempt at fooling traders that MUST be avoided.
All lines except the first one in yellow will vary depending on the "Repaint" setting in the script's inputs. The first plot does not change because, contrary to all other plots, it contains no conditional code to adapt to repainting/no-repainting modes; it is a simple security() call showing its default behavior.
C — Points of interest on the chart
Historical bars do not show actual repainting behavior
To appreciate what a repainting security() call will plot in realtime, one must look at the realtime bar and at elapsed realtime bars, the bars where the top line is green or red on the chart at the top of this page. There you can see how the plots go up and down, following the close value of each successive chart bar making up a single bar of the higher timeframe. You would see the same behavior in "Replay" mode. In the realtime bar, the movement of repainting plots will vary with the source you are fetching: open will not move after a new timeframe opens, low and high will change when a new low or high are found, close will follow the last feed update. If you are fetching a value calculated by a function, it may also change on each update.
Now notice how different the plots are on historical bars. There, the plot shows the close of the previously completed timeframe for the whole duration of the current timeframe, until on its last bar the price updates to the current timeframe's close when it is confirmed (if the timeframe's last bar is missing, the plot will only update on the next timeframe's first bar). That last bar is the only one showing where the plot would end if that timeframe's bars had elapsed in realtime. If one doesn't understand this, one cannot properly visualize how his script will calculate in realtime when using repainting. Additionally, as published scripts typically show charts where the script has only run on historical bars, they are, in fact, misleading traders who will naturally assume the script will behave the same way on realtime bars.
Non-repainting plots are more accurate on historical bars
Now consider this chart, where we are using the same settings as on the chart used to publish this script, except that we have turned "Repainting" off this time:
The yellow line here is our reference, repainting line, so although repainting is turned off, it is still repainting, as expected. Because repainting is now off, however, plots on historical bars show the previous timeframe's close until the first bar of a new timeframe, at which point the plot updates. This correctly reflects the behavior of the script in the realtime bar, where because we are offsetting the series by one, we are always showing the previously calculated—and thus confirmed—higher timeframe value. This means that in realtime, we will only get the previous timeframe's values one bar after the timeframe's last bar has elapsed, at the open of the first bar of a new timeframe. Historical and elapsed realtime bars will not actually show this nuance because they reflect the state of calculations made on their close , but we can see the plot update on that bar nonetheless.
► This more accurate representation on historical bars of what will happen in the realtime bar is one of the two key reasons why using non-repainting data is preferable.
The other is that in realtime, your script will be using more reliable data and behave more consistently.
Misleading plots
Valiant attempts by coders to show non-repainting, higher timeframe data updating earlier than on our chart are futile. If updates occur one bar earlier because coders use the repainting version of the function, then so be it, but they must then also accept that their historical bars are not displaying information that is as accurate. Not informing script users of this is to mislead them. Coders should also be aware that if they choose to use repainting data in realtime, they are sacrificing reliability to speed and may be running a strategy that behaves very differently from the one they backtested, thus invalidating their tests.
When, however, coders make what are supposed to be non-repainting plots plot artificially early on historical bars, as in examples "c4" and "c5" of our script, they would want us to believe they have achieved the miracle of time travel. Our understanding of the current state of science dictates that for now, this is impossible. Using such techniques in scripts is plainly misleading, and public scripts using them will be moderated. We are coding trading tools here—not video games. Elementary ethics prescribe that we should not mislead traders, even if it means not being able to show sexy plots. As the great Feynman said: You should not fool the layman when you're talking as a scientist.
You can readily appreciate the fantasy plot of "c4", the thinnest line in black, by comparing its supposedly non-repainting behavior between historical bars and realtime bars. After updating—by miracle—as early as the wide yellow line that is repainting, it suddenly moves in a more realistic place when the script is running in realtime, in synch with our non-repainting lines. The "c5" version does not plot on the chart, but it displays in the Data Window. It is even worse than "c4" in that it also updates magically early on historical bars, but goes on to evaluate like the repainting yellow line in realtime, except one bar late.
Data Window
The Data Window shows the values of the chart's plots, then the values of both the inside and outside offsets used in our calculations, so you can see them change bar by bar. Notice their differences between historical and elapsed realtime bars, and the realtime bar itself. If you do not know about the Data Window, have a look at this essential tool for Pine coders in the Pine User Manual's page on Debugging . The conditional expressions used to calculate the offsets may seem tortuous but their objective is quite simple. When repainting is on, we use this form, so with no offset on all bars:
security(ticker, i_timeframe, i_source )
// which is equivalent to:
security(ticker, i_timeframe, i_source)
When repainting is off, we use two different and inverted offsets on historical bars and the realtime bar:
// Historical bars:
security(ticker, i_timeframe, i_source )
// Realtime bar (and thus, elapsed realtime bars):
security(ticker, i_timeframe, i_source )
The offsets in the first line show how we prevent repainting on historical bars without the need for the `lookahead` parameter. We use the value of the function call on the chart's previous bar. Since values between the repainting and non-repainting versions only differ on the timeframe's last bar, we can use the previous value so that the update only occurs on the timeframe's first bar, as it will in realtime when not repainting.
In the realtime bar, we use the second call, where the offsets are inverted. This is because if we used the first call in realtime, we would be fetching the value of the repainting function on the previous bar, so the close of the last bar. What we want, instead, is the data from the previous, higher timeframe bar , which has elapsed and is confirmed, and thus will not change throughout realtime bars, except on the first constituent chart bar belonging to a new higher timeframe.
After the offsets, the Data Window shows values for the `barstate.*` variables we use in our calculations.
█ NOTES
Why are we revisiting security() ?
For four reasons:
1 — We were seeing coders misuse our `f_secureSecurity()` function presented in How to avoid repainting when using security() .
Some novice coders were modifying the offset used with the history-referencing operator in the function, making it zero instead of one,
which to our horror, caused look-ahead bias when used with `lookahead = barmerge.lookahead_on`.
We wanted to present a safer function which avoids introducing the dreaded "lookahead" in the scripts of unsuspecting coders.
2 — The popularity of security() in screener-type scripts where coders need to use the full 40 calls allowed per script made us want to propose
a solid method of allowing coders to offer a repainting/no-repainting choice to their script users with only one security() call.
3 — We wanted to explain why some alternatives we see circulating are inadequate and produce misleading behavior.
4 — Our previous publication on security() focused on how to avoid repainting, yet many other considerations worthy of attention are not related to repainting.
Handling tuples
When sending function calls that return tuples with security() , our `f_security()` function will not work because Pine does not allow us to use the history-referencing operator with tuple return values. The solution is to integrate the inside offset to your function's arguments, use it to offset the results the function is returning, and then add the outside offset in a reassignment of the tuple variables, after security() returns its values to the script, as we do in our "c2" example.
Does it repaint?
We're pretty sure Wilder was not asked very often if RSI repainted. Why? Because it wasn't in fashion—and largely unnecessary—to ask that sort of question in the 80's. Many traders back then used daily charts only, and indicator values were calculated at the day's close, so everybody knew what they were getting. Additionally, indicator values were calculated by generally reputable outfits or traders themselves, so data was pretty reliable. Today, almost anybody can write a simple indicator, and the programming languages used to write them are complex enough for some coders lacking the caution, know-how or ethics of the best professional coders, to get in over their heads and produce code that does not work the way they think it does.
As we hope to have clearly demonstrated, traders do have legitimate cause to ask if MTF scripts repaint or not when authors do not specify it in their script's description.
► We recommend that authors always use our `f_security()` with `false` as the last argument to avoid repainting when fetching data dependent on OHLCV information. This is the only way to obtain reliable HTF data. If you want to offer users a choice, make non-repainting mode the default, so that if users choose repainting, it will be their responsibility. Non-repainting security() calls are also the only way for scripts to show historical behavior that matches the script's realtime behavior, so you are not misleading traders. Additionally, non-repainting HTF data is the only way that non-repainting alerts can be configured on MTF scripts, as users of MTF scripts cannot prevent their alerts from repainting by simply configuring them to trigger on the bar's close.
Data feeds
A chart at one timeframe is made up of multiple feeds that mesh seamlessly to form one chart. Historical bars can use one feed, and the realtime bar another, which brokers/exchanges can sometimes update retroactively so that elapsed realtime bars will reappear with very slight modifications when the browser's tab is refreshed. Intraday and daily chart prices also very often originate from different feeds supplied by brokers/exchanges. That is why security() calls at higher timeframes may be using a completely different feed than the chart, and explains why the daily high value, for example, can vary between timeframes. Volume information can also vary considerably between intraday and daily feeds in markets like stocks, because more volume information becomes available at the end of day. It is thus expected behavior—and not a bug—to see data variations between timeframes.
Another point to keep in mind concerning feeds it that when you are using a repainting security() plot in realtime, you will sometimes see discrepancies between its plot and the realtime bars. An artefact revealing these inconsistencies can be seen when security() plots sometimes skip a realtime chart bar during periods of high market activity. This occurs because of races between the chart and the security() feeds, which are being monitored by independent, concurrent processes. A blue arrow on the chart indicates such an occurrence. This is another cause of repainting, where realtime bar-building logic can produce different outcomes on one closing price. It is also another argument supporting our recommendation to use non-repainting data.
Alternatives
There is an alternative to using security() in some conditions. If all you need are OHLC prices of a higher timeframe, you can use a technique like the one Duyck demonstrates in his security free MTF example - JD script. It has the great advantage of displaying actual repainting values on historical bars, which mimic the code's behavior in the realtime bar—or at least on elapsed realtime bars, contrary to a repainting security() plot. It has the disadvantage of using the current chart's TF data feed prices, whereas higher timeframe data feeds may contain different and more reliable prices when they are compiled at the end of the day. In its current state, it also does not allow for a repainting/no-repainting choice.
When `lookahead` is useful
When retrieving non-price data, or in special cases, for experiments, it can be useful to use `lookahead`. One example is our Backtesting on Non-Standard Charts: Caution! script where we are fetching prices of standard chart bars from non-standard charts.
Warning users
Normal use of security() dictates that it only be used at timeframes equal to or higher than the chart's. To prevent users from inadvertently using your script in contexts where it will not produce expected behavior, it is good practice to warn them when their chart is on a higher timeframe than the one in the script's "Timeframe" field. Our `f_tfReminderAndErrorCheck()` function in this script does that. It can also print a reminder of the higher timeframe. It uses one security() call.
Intrabar timeframes
security() is not supported by TradingView when used with timeframes lower than the chart's. While it is still possible to use security() at intrabar timeframes, it then behaves differently. If no care is taken to send a function specifically written to handle the successive intrabars, security() will return the value of the last intrabar in the chart's timeframe, so the last 1H bar in the current 1D bar, if called at "60" from a "D" chart timeframe. If you are an advanced coder, see our FAQ entry on the techniques involved in processing intrabar timeframes. Using intrabar timeframes comes with important limitations, which you must understand and explain to traders if you choose to make scripts using the technique available to others. Special care should also be taken to thoroughly test this type of script. Novice coders should refrain from getting involved in this.
█ TERMINOLOGY
Timeframe
Timeframe , interval and resolution are all being used to name the concept of timeframe. We have, in the past, used "timeframe" and "resolution" more or less interchangeably. Recently, members from the Pine and PineCoders team have decided to settle on "timeframe", so from hereon we will be sticking to that term.
Multi-timeframe (MTF)
Some coders use "multi-timeframe" or "MTF" to name what are in fact "multi-period" calculations, as when they use MAs of progressively longer periods. We consider that a misleading use of "multi-timeframe", which should be reserved for code using calculations actually made from another timeframe's context and using security() , safe for scripts like Duyck's one mentioned earlier, or TradingView's Relative Volume at Time , which use a user-selected timeframe as an anchor to reset calculations. Calculations made at the chart's timeframe by varying the period of MAs or other rolling window calculations should be called "multi-period", and "MTF-anchored" could be used for scripts that reset calculations on timeframe boundaries.
Colophon
Our script was written using the PineCoders Coding Conventions for Pine .
The description was formatted using the techniques explained in the How We Write and Format Script Descriptions PineCoders publication.
Snippets were lifted from our MTF Selection Framework , then massaged to create the `f_tfReminderAndErrorCheck()` function.
█ THANKS
Thanks to apozdnyakov for his help with the innards of security() .
Thanks to bmistiaen for proofreading our description.
Look first. Then leap.

Kairos [Signals]Kairos bot looks for the opportune time to buy low and sell high at targets
It provides signals to open and close trades, and indicates favorable positions for a stop loss and profit taking
The Kairos bot can be used on any chart and on any time frame
---BACKTESTER---
Using the backtester script the user can look at a chart's history between selected dates to find optimal bot settings and optimal time frames
The backtester is based on general percentages for profit taking as indicated below:
-------------T1 T2 T3 T4 T5 T6 CLOSE
1 Target: 50% 50%
2 Targets: 50% 25% 25%
3 Targets: 40% 30% 20% 10%
4 Targets: 40% 25% 20% 10% 5%
5 Targets: 35% 25% 20% 10% 5% 5%
6 Targets: 30% 25% 20% 10% 5% 5% 5%
ie: If 2 targets are selected:
- 50% of investment will be taken at target 1
- 25% of investment will be taken at target 2
- and the remainder 25% will be taken when the trade is closed on a close signal
However, it is up to the user's own risk appetite to determine where and how much profit to take
Note that the backtester does not have any on screen indicators other than OPEN and CLOSE, however profit taking can be indicated by ticking the Style -> Trades on Chart tick box on the settings userform
---SIGNALS---
The signals script can be used for automation and can indicate up to 6 potential Profit Targets, as well as a Stop Loss based on how many bars back needs to be taken into consideration
The signals (Open/Close) can be automated using TradingView alerts, however the Stop Loss and Profit Taking are only indicators and are for the users own interpretation
The user does not have to place a Stop Loss or take profit at the Targets if so wished, the bot can be used to simply buy on an OPEN signal and sell on a CLOSE signal, however, the backtester will indicate that it is far more profitable to take profits.
It is advised to take profits just below indicated Targets as these are potentially high selling zones and price action can sometimes turn down just short of these targets.
---INVITE-ONLY SCRIPT---
This is an invite-only script, so if you would like to try out Kairos Bot, send me a message
