MTF EMA Ribbon & Bands + BBMulti Timeframe Exponential Moving Average Ribbon & Bands + Boillinger Bands
I used the script "EMA Ribbon - low clutter, configurable " by adam24x, I made some color change and I added a few indicators (Boillinger Bands, EMA on multi timeframe and EMA bands from "34 EMA Bands " by VishvaP).
The script can display various EMA from the chart's timeframe but also EMA from other timeframes.
Bollinger Bands and EMA bands can also be added to the chart.
חפש סקריפטים עבור "band"

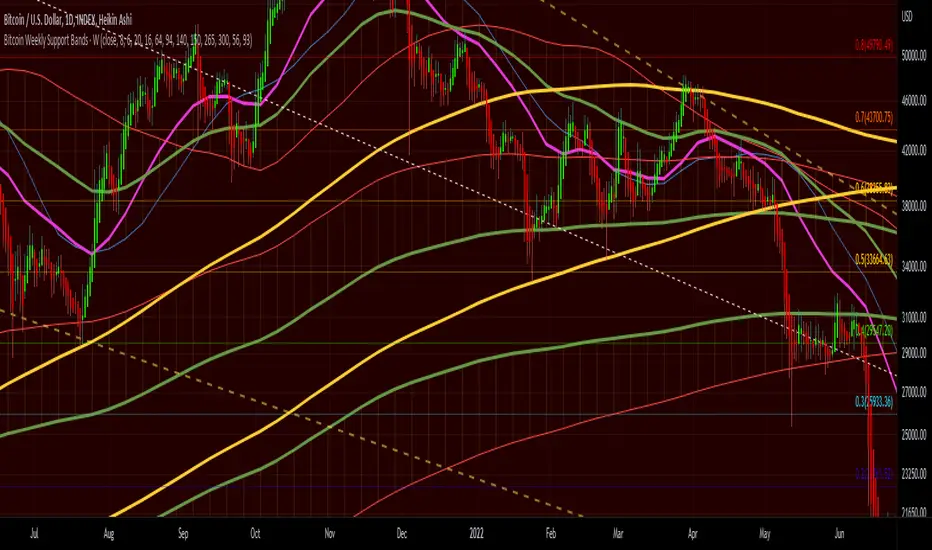
Bitcoin Weekly Support BandsMy first ever attempt at a custom script. I took Benjamin Cowen's concept of the Bitcoin Bull Market Support Band and applied it to the 100 week and 200 week moving averages. I also added in the 300 week sma. I mainly wanted to have all these in one indicator.
double Bollinger BandsThe Double Bollinger Band consists of an average and two Bollingers and two backgrounds, each of which has separate settings and can be approved more strongly for trades. Moves and vice versa. With the price chart coming out of the second band, the price is much more likely to move in the same direction.
To use this feature, we had to use two Bollinger indicators with different settings at the same time, but we no longer need to do this with the Double Bollinger.
Its main use is crypto, but it can be used in all markets

Steven Primo's bollinger bands strategyHi, this strategy is taken from a video made by Steven Primo. You can look it up on YouTube if you want to know about it.
It is a mean-reversion strategy based on the Bollinger Bands, in which we wait for 5 consecutive closes above the upper band, and for a short-term top. Once it happens, we place an entry order on this top, with a stop at the nearest bottom before the movement started, and use the difference from the stop and entry point to determine the target. For shorting, it's the same process, but for the downside. From my testing, only long orders were profitable, but you can configure whichever you want.
It works well for directional markets with a low level of noise, as you can see with the BTCUSD chart. One of its caveats is the short number of occurrences, and the long stop loss and target. You can enable a trailing stop, but from my testings, it just made the results worse.
I made some modifications, like removing the MA requirement, since the entry point was above it almost all the time, and I forced the BB to use a log version of the prices, so that discrepancies are eliminated. You'll also notice that you can't select an extension that is lower than 100, and that is intentional, since you're not supposed to enter a trade in which you can lose more than what you can earn.
I chose not to implement any kind of risk management, but I might do that in the future. You can leave your suggestions in the comments.

Y/Q/M/W aVWAP BandsYearly, Quarterly, Monthly or Weekly VWAP with Standard Deviation Envelope
Previous Y/Q/M/W VWAP and Band are extended forward automatically*
VWAP standard deviation envelope serves as a kind of Value Area, with the boundaries of the envelope acting as support and resistance. Previous envelops often show confluence with price action once price retests them.
Helpful to form a bias on the available time frames, find areas of support and resistance, and determine acceptance/rejection from breakouts or consolidations.
* this is a unique feature of this script

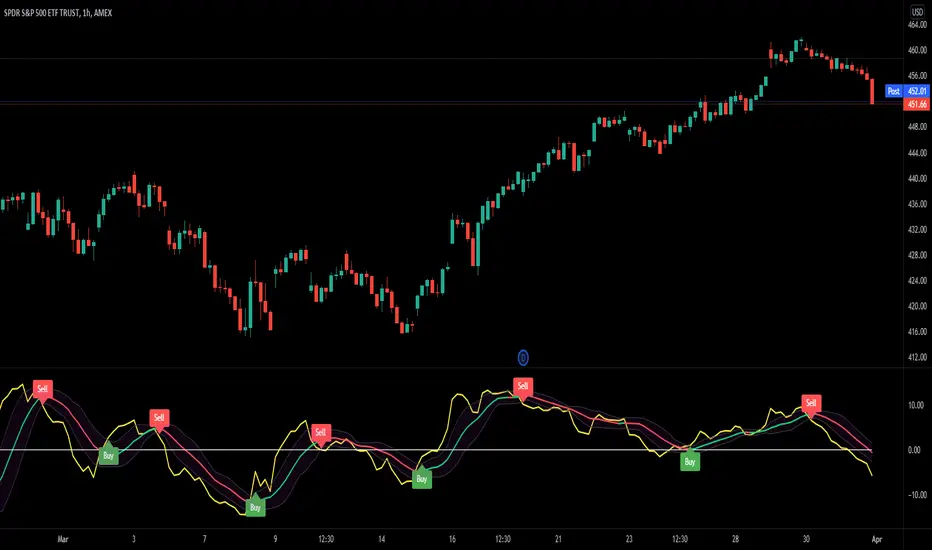
Mobo BandsThis indicator is the Mobo Bands (Momentum Breakout Bands). These bands are bollinger bands that have an adjusted standard deviation. There are Buy signals when it has momentum breakouts above the bands for moves to the upside and Sell signals when it has momentum breakouts below the bands for moves to the downside. The bands simply suggest that all markets have periods of chop which we all know to be true. While the price is inside the bands it is said to be trendless. Once the breakouts happen you can take trades in the breakout direction. I like to use these to swing trade options on the hourly timeframe but the bands should work on most instruments and timeframes. I like to use it to take swings on SPY on the 1 hour chart for entries and use the Daily chart for trend confirmation.
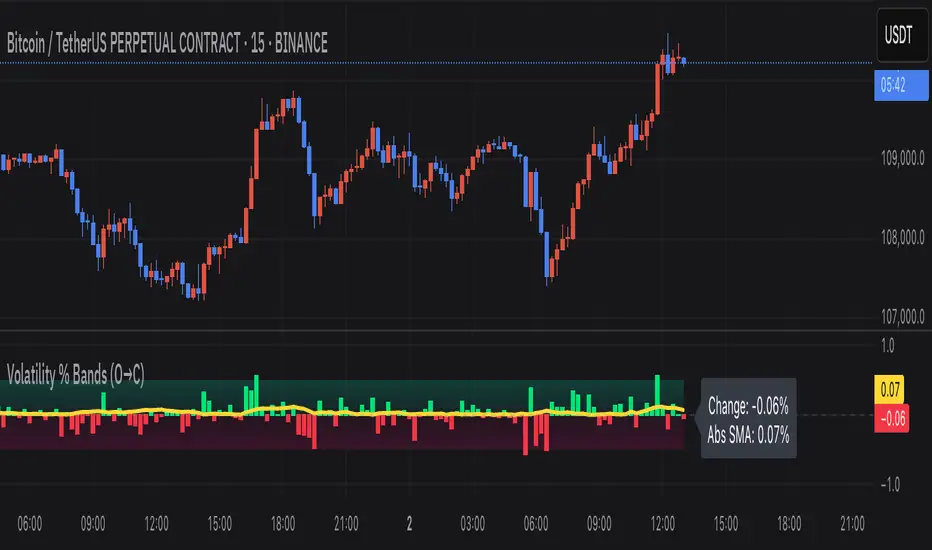
Volatility % Bands (O→C)Volatility % Bands (O→C) is an indicator designed to visualize the percentage change from Open to Close of each candle, providing a clear view of short-term momentum and volatility.
**Histogram**: Displays bar-by-bar % change (Close vs Open). Green bars indicate positive changes, while red bars indicate negative ones, making momentum shifts easy to identify.
**Moving Average Line**: Plots the Simple Moving Average (SMA) of the absolute % change, helping traders track the average volatility over a chosen period.
**Background Bands**: Based on the user-defined Level Step, ±1 to ±5 zones are highlighted as shaded bands, allowing quick recognition of whether volatility is low, moderate, or extreme.
**Label**: Shows the latest candle’s % change and the current SMA value as a floating label on the right, making it convenient for real-time monitoring.
This tool can be useful for volatility breakout strategies, day trading, and short-term momentum analysis.
Multi-Length Quad Bollinger BandsHere is a Pine Script code for TradingView that plots four separate Bollinger Bands on your chart. The lengths are preset to 14, 50, 100, and 200, but every aspect—including lengths, standard deviations, colors, and the source price—is fully customizable through the script's settings menu.
The 14 and 50-period bands are enabled by default, while the 100 and 200-period bands are disabled to keep the chart clean initially. You can easily toggle any of them on or off.

Adaptive Fibonacci Volatility Bands (AFVB)
**Adaptive Fibonacci Volatility Bands (AFVB)**
### **Overview**
The **Adaptive Fibonacci Volatility Bands (AFVB)** indicator enhances standard **Fibonacci retracement levels** by dynamically adjusting them based on market **volatility**. By incorporating **ATR (Average True Range) adjustments**, this indicator refines key **support and resistance zones**, helping traders identify **more reliable entry and exit points**.
**Key Features:**
- **ATR-based adaptive Fibonacci levels** that adjust to changing market volatility.
- **Buy and Sell signals** based on price interactions with dynamic support/resistance.
- **Toggleable confirmation filter** for refining trade signals.
- **Customizable color schemes** and alerts.
---
## **How This Indicator Works**
The **AFVB** operates in three main steps:
### **1️⃣ Detecting Key Fibonacci Levels**
The script calculates **swing highs and swing lows** using a user-defined lookback period. From this, it derives **Fibonacci retracement levels**:
- **0% (High)**
- **23.6%**
- **38.2%**
- **50% (Mid-Level)**
- **61.8%**
- **78.6%**
- **100% (Low)**
### **2️⃣ Adjusting for Market Volatility**
Instead of using **fixed retracement levels**, this indicator incorporates an **ATR-based adjustment**:
- **Resistance levels** shift **upward** based on ATR.
- **Support levels** shift **downward** based on ATR.
- This makes levels more **responsive** to price action.
### **3️⃣ Generating Buy & Sell Signals**
AFVB provides **two types of signals** based on price interactions with key levels:
✔ **Buy Signal**:
Occurs when price **dips below** a support level (78.6% or 100%) and **then closes back above it**.
- **Optionally**, a confirmation buffer can be enabled to require price to close **above an additional threshold** (based on ATR).
✔ **Sell Signal**:
Triggered when price **breaks above a resistance level** (0% or 23.6%) and **then closes below it**.
📌 **Important:**
- The **buy threshold setting** allows traders to **fine-tune** entry conditions.
- Turning this setting **off** generates **more frequent** buy signals.
- Keeping it **on** reduces false signals but may result in **fewer trade opportunities**.
---
## **How to Use This Indicator in Trading**
### 🔹 **Entry Strategy (Buying)**
1️⃣ Look for **buy signals** at the **78.6% or 100% Fibonacci levels**.
2️⃣ Ensure price **closes above** the support level before entering a long trade.
3️⃣ **Enable or disable** the buy threshold filter depending on desired trade strictness.
### 🔹 **Exit Strategy (Selling)**
1️⃣ Watch for **sell signals** at the **0% or 23.6% Fibonacci levels**.
2️⃣ If price **breaks above resistance and then closes below**, consider exiting long positions.
3️⃣ Can be used **alone** or **combined with trend confirmation tools** (e.g., moving averages, RSI).
### 🔹 **Using the Toggleable Buy Threshold**
- **ON**: Buy signal requires **extra confirmation** (reduces false signals but fewer trades).
- **OFF**: Buy triggers as soon as price **closes back above support** (more signals, but may include weaker setups).
---
## **User Inputs**
### **🔧 Customization Options**
- **ATR Length**: Defines the period for **ATR calculation**.
- **Swing Lookback**: Determines how far back to find **swing highs and lows**.
- **ATR Multiplier**: Adjusts the size of **volatility-based modifications**.
- **Buy/Sell Threshold Factor**: Fine-tunes the **entry signal strictness**.
- **Show Level Labels**: Enables/disables **Fibonacci level annotations**.
- **Color Settings**: Customize **support/resistance colors**.
### **📢 Alerts**
AFVB includes built-in **alert conditions** for:
- **Buy Signals** ("AFVB BUY SIGNAL - Possible reversal at support")
- **Sell Signals** ("AFVB SELL SIGNAL - Possible reversal at resistance")
- **Any Signal Triggered** (Useful for automated alerts)
---
## **Who Is This Indicator For?**
✅ **Scalpers & Day Traders** – Helps identify **short-term reversals**.
✅ **Swing Traders** – Useful for **buying dips** and **selling rallies**.
✅ **Trend Traders** – Can be combined with **momentum indicators** for confirmation.
**Best Timeframes:**
⏳ **15-minute, 1-hour, 4-hour, Daily charts** (works across multiple assets).
---
## **Limitations & Considerations**
🚨 **Important Notes**:
- **No indicator guarantees profits**. Always **combine** it with **risk management strategies**.
- Works best **in trending & mean-reverting markets**—may generate false signals in **choppy conditions**.
- Performance may vary across **different assets & timeframes**.
📢 **Backtesting is recommended** before using it for live trading.

Bollinger Bands + EMA 200 + EMA 50This indicator combines three technical analysis tools: the Bollinger Bands (BB), and two Exponential Moving Averages (EMA) with periods of 200 and 50.
Bollinger Bands (BB): This indicator consists of three lines—the middle line being a simple moving average (SMA), and the upper and lower bands representing two standard deviations above and below the SMA. The width of the bands indicates market volatility, with wider bands signifying higher volatility and narrower bands indicating lower volatility.
Exponential Moving Averages (EMA 200 and EMA 50): The EMA is a type of moving average that gives more weight to recent prices, making it more responsive to price changes than the simple moving average. The EMA 200 is considered a long-term trend indicator, often used to identify the overall direction of the market. The EMA 50 is a medium-term trend indicator, helping to spot more immediate market trends. Crossovers between these two EMAs (such as when EMA 50 crosses above EMA 200) are commonly used as buy or sell signals, with the idea that a short-term trend shift is occurring.
By combining these three indicators, this custom Pine Script aims to give a comprehensive view of the market conditions, helping traders to understand both the volatility (via BB), the long-term market trend (via EMA 200), and the medium-term trend (via EMA 50). The interaction between the price and these indicators, along with crossovers, can be used to identify potential entry and exit points.

PFCF Price BandPFCF Price Band shows price calculated using the previous period's high and low P/TTM FCFPS (TTM's price to free cash flow per share over the last 12 months) multiplied by TTM's current FCFPS ( Similar to price theory = P/E x expected earnings per share)
If the current P/FCFPS is lower than the minimum P/FCFPS, it is considered cheap. In other words, above the maximum P/FCFPS is considered expensive.
PFCF Price Band consists of 2 parts.
- Firstly, the historical P/FCFPS value in "Green" (if TTM FCFPS is positive) or "Red" (if TTM FCFPS is negative) status changes based on the latest high or low price of TTM FCFPS.
- Second, the blue line is the closing price divided by TTM FCFPS, which shows the current P/FCF.
P.S. It is recommended to use it together with the PE Band indicator because just net profit does not mean that a company has good cash flow.

SMA Custom Volume BandsThe "SMA Custom Volume Bands" indicator is a custom technical analysis tool designed for use on the TradingView platform. This indicator allows users to analyze and visualize key aspects of a stock's volume within the context of its 200-period Simple Moving Average (SMA). It features the following components:
Volume Bars: The indicator displays the volume of a selected financial instrument using colored bars. Green bars represent days when the trading volume is higher than the previous day, while red bars represent days when the trading volume is lower.
200 SMA of Volume: A blue line on the chart represents the 200-period Simple Moving Average of the trading volume, providing insight into the longer-term volume trend.
Customizable Percentage Line: Users have the flexibility to set a custom percentage value above or below the 200 SMA of trading volume. This line is plotted as a blue line on the chart, allowing traders to identify when volume meets their preferred percentage threshold.
The "SMA Custom Volume Bands" indicator is a simple tool for traders, aiding in the assessment of volume trends and potential price reversals in the context of moving averages. It offers customization options, enhancing its adaptability to individual trading strategies and preferences.

Logarithmic Bollinger Bands [MisterMoTA]The script plot the normal top and bottom Bollinger Bands and from them and SMA 20 it finds fibonacci logarithmic levels where price can find temporary support/resistance.
To get the best results need to change the standard deviation to your simbol value, like current for BTC the Standards Deviation is 2.61, current Standard Deviation for ETH is 2.55.. etc.. find the right current standard deviation of your simbol with a search online.
The lines ploted by indicators are:
Main line is a 20 SMA
2 retracement Logarithmic Fibonacci 0.382 levels above and bellow 20 sma
2 retracement Logarithmic Fibonacci 0.618 levels above and bellow 20 sma
Top and Bottom Bollindger bands (ticker than the rest of the lines)
2 expansion Logarithmic Fibonacci 0.382 levels above Top BB and bellow Bottom BB
2 expansion Logarithmic Fibonacci 0.618 levels above Top BB and bellow Bottom BB
2 expansion Logarithmic Fibonacci level 1 above Top BB and bellow Bottom BB
2 expansion Logarithmic Fibonacci 1.618 levels above Top BB and bellow Bottom BB
Let me know If you find the indicator useful or PM if you need any custom changes to it.

Alpha Fractal BandsWilliams fractals are remarkable support and resistance levels used by many traders. However, it can sometimes be challenging to use them frequently and get confirmation from other oscillators and indicators. With the new "Alpha Fractal Bands", a unique blend of Williams Fractals and Bollinger Bands emerges, offering a fresh perspective. Extremes can be utilized as price reversals or for taking profits. I look forward to hearing your thoughts. Best regards... Happy trading!
An easy solution for long positions is to:
Identify a bullish trend or a potential entry point for a long position.
Set a stop-loss order to limit potential losses if the trade goes against you.
Determine a target price or take-profit level to lock in profits.
Consider using technical indicators or analysis tools to confirm the strength of the bullish trend.
Regularly monitor the trade and make necessary adjustments based on market conditions.
An easy solution for short positions could be to follow these steps:
Identify a bearish trend or a potential entry point for a short position.
Set a stop-loss order to limit potential losses if the trade goes against you.
Determine a target price or take-profit level to lock in profits.
Consider using technical indicators or analysis tools to confirm the strength of the bearish trend.
Regularly monitor the trade and make necessary adjustments based on market conditions.
Remember, it's important to conduct thorough research and analysis before entering any trade and to manage your risk effectively.
To stay updated with the content, don't forget to follow and engage with it on TV, my friends. Remember to leave comments as well :)

Average Trend with Deviation Bands v2TL;DR: An average based trend incl. micro trend spotting and multiple display options.
This script is basically an update of my "Average Trend with Deviation Bands" script. I made the following changes:
Not an overlay anymore - The amount of drawn lines makes the chart pretty messy. That's why I moved it to a pane. If you preferred the overlay you can use my "Average Trend with Deviation Bands" script. *This is also the reason why I publish this script instead of updating the existing one.
I added an EMA to represent the price movement instead of candles
I added a signal (SMA) to spot micro trends and early entry/exit signals
I added the option to switch between a "line view" which shows the average trend and deviation bands and an "oscillator view" which shows an oscillator and histogram (MACD style)
General usage:
1. The white line is the average trend (which is an average of the last N bars open, close, high, low price).
2. Bands around the average trend are standard deviations which can be adjusted in the options menu and are only visible in "lines view". Basically they are like the clouds in the Ichimoku Cloud indicator - In big deviation bands the price movement needs more "power" to break through the average trend and vice versa.
3. Indicator line (blue line) - This is the EMA which represents the price. Crossing the average trend from below indicates an uptrend and vice versa (crossing from above indicates a down trend).
4. Signal line (red line) - This is a smoothed version of the indicator line which can be used to predict the movement of the price when crossed by the indicator line (like at MACD and many other indicators).
Oscillator usage:
When switched to "oscillator view" the indicator line oscillates around a zero line which can be seen as the average trend. The usage is basically the same as described above. However there is also the histogram which shows the difference between the indicator and signal. Of course the histogram can be deactivated. Additionally a color filling can be added to easily spot entry/exit signals.
As always: Code is free do whatever you like. If you have any questions/comments/etc. just drop it in the comment section.

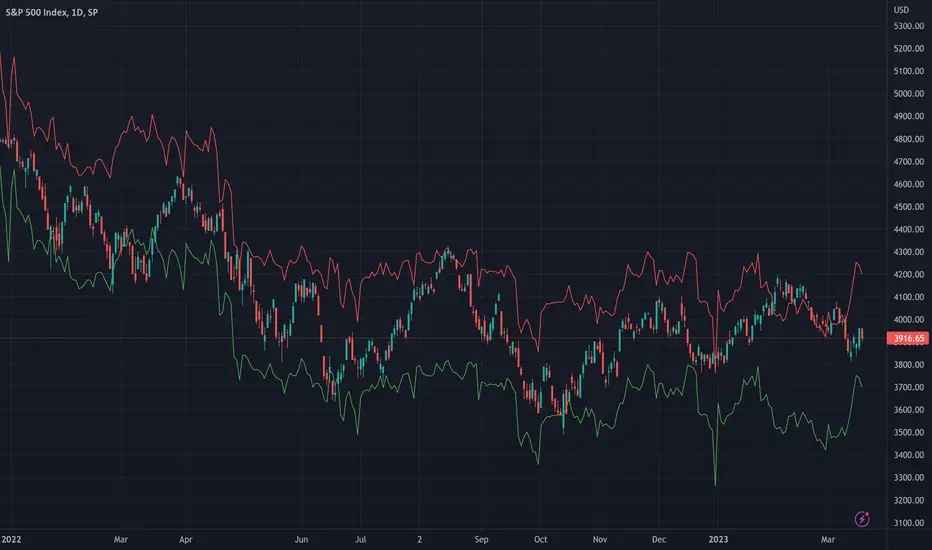
SPX Fair Value Bands WSHOSHOThis is a variation of the SPX Fair Value Bands indicator which uses WSHOSHO instead of WALCL.
WSHOSHO only includes the 'Securities Held Outright' portion of the Fed balance sheet. This effectively eliminates the portions related to BTFP (Bank Term Funding Program).
Weighted Deviation Bands [Loxx]What are Weighted Deviation Bands?
Variation of the Bollinger bands but it uses linear weighted average and weighted deviation via Mladen Rakic.
What is Weighted Deviation?
This weighted deviation is a sort of all linear weighted deviation. It uses linear weighting in all the steps calculated (which makes it different from the built in deviation in a case when linear weighted ma is used in the ma method). It is more responsive than the standard deviation
Included
Bar coloring

QQQ Fair Value BandsThis is similar to the SPX Fair Value Bands indicator, but for QQQ.
It is based on the Net Liquidity model:
Net Liquidity = FED - RRP - TGA

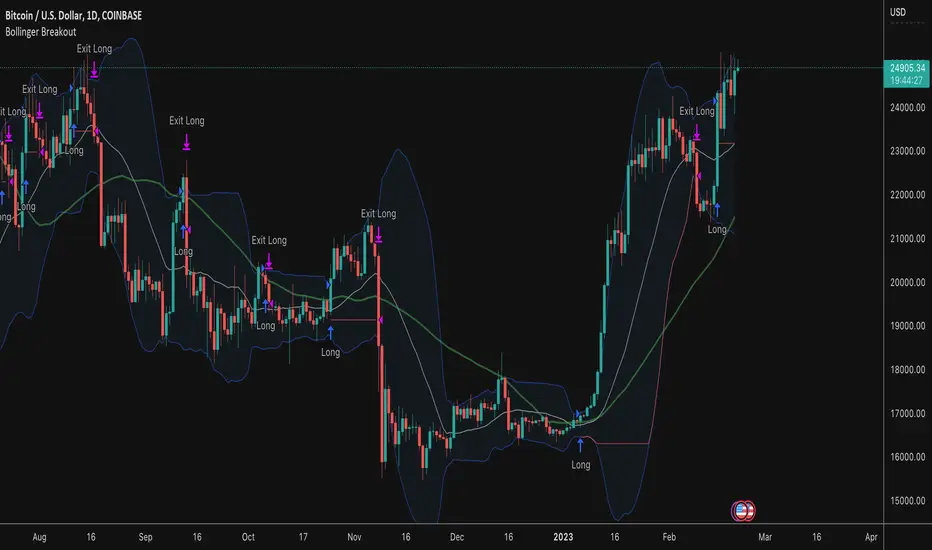
Bollinger Band BreakoutThis strategy buys when price crosses above an upper Bollinger Band and sells when the lower band is breached. What makes this strategy different than others:
Long only with filtering for only showing strong tickers
Filter out trades below a moving average on both the current timeframe and a longer period timeframe to keep you out of bear markets
Optional ability to set a tighter initial stop level to increase exposure and decrease downside risk on freshly opened trades while you wait for the lower Bollinger Band trailing stop to catch up
Take entries/exits on wicks/stops or wait for candle closes before entry
Select which dates to backtest
Customize Bollinger Band parameters including the ability to have different values for the upper and lower band standard deviation
Bollinger Bands SignalsDescription:
This indicator works well in trendy markets on long runs and in mean-reverting markets, at almost any timeframe.
That said, higher timeframes are much preferred for their intrinsic ability to cut out noise. The example chart is in 3H TF.
Be mindful, the script shows somewhat erratic jigsaw-like behaviour during consolidation periods when the price
jumps up and down in indecision which way to go. Fortunately, there are scripts out there that detect such periods.
You can choose between 4 Moving Averages, Vidya being the default. Period, Deviation and Bands Width parameters
all of them affect the signal generation.
For the Pine Script coder this script is pretty obvious.
It uses a standard technical analysis indicator - Bollinger Bands - and appends it with a 'width' parameter and
a signal generation procedure.
The signal generation procedure is the heart of this script that keeps the script pumping signals.
The BB width is used as a filter.
You can use this procedure in your own scripts and it will continue generate signals according to your rules.

Squeeze Range: Bollinger Bands / Keltner Channels [Whvntr]Presenting Squeeze Range: Bollinger Bands / Keltner Channels
TTMSqueeze method is a volatility and momentum indicator introduced by John Carter of Simpler Trading, which capitalizes on the tendency for price to break out strongly after consolidating in a tight trading range.
How did I make this indicator? The Bollinger Bands & Keltner Channels base scripts are from the standard indicators of their class in the Technicals section... I made this indicator first then noticed there were 3 others with a similar concept, but this differs in it's unique features and application of the TTMSqueeze strategy. This indicator plots the True Range of the Keltner Channel (Customizable in 'Bands Style" in the Inputs Menu) the instances the Bollinger Bands are within the range of the Keltner channel (the market just entered a squeeze).
Featuring: customizable Moving Averages
1. Exponential (Default for both BB & KC)
2. Simple
3. RMA (MA used in RSI )
Keltner channels have a multiplier of 2 & 3 on the Chart (3 being the outer).
How do I use this indicator? Once the teal dots are inside the solid red lines this would indicate that TTMperiod of low market volatility (the market is preparing itself for an explosive move up or down). Do some research and study how to use the TTMSqueeze method by John Carter. Disclaimer: not a guarantee of future favorable results.

Bollinger Band strategy with split, limit, stopEntering a short position after breaking the upper Bollinger Band, entering a long position when entering after breaking the lower Bollinger Band
Provides templates for how to display position average price, stop loss, and profit price using the plot function on the chart, and how to buy splits
After entering the position, if the price crosses the mid-band line, the stop loss is adjusted to the mid-band line.

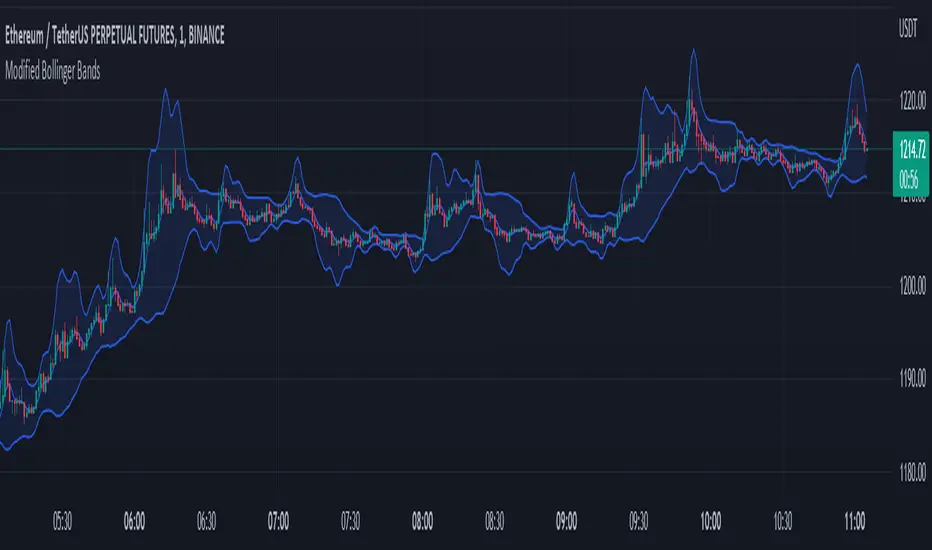
Modified Bollinger BandsThis script has been distributed for learning purposes.
A particular kind of price envelope is "Bollinger Bands" indicator. Upper and lower price range levels are determined by price envelopes. By default, Bollinger Bands are plotted in Tradingview as envelopes at a standard deviation level above and below the price's simple moving average (SMA). I attempted to modify the indicator in this version by adding several kinds of moving averages first. The key feature is that standard deviation should be modified. in Tradingview, SMA calculates the standard deviation. The allocated moving average should be used to calculate the std function when the base line is changed.