Lane Bandpass Filter OscillatorThis is a bandpass filter oscillator that has an additional tuning parameter
in addition to the Period used by John Ehlers. It is 'quality' which has meaning
in a frequency/magnitude sense (See Q in line 7). The bandpass is slower
according to the inverse of Q.
The concept was developed by John Lane etal in the text 'DSP Filters'
The bandpass filter works better in a trending environment.
חפש סקריפטים עבור "band"

Volatility Bands by DGTVolatility represents how large an asset's prices swing around the mean price, the degree of variation of a trading price over time, and is commonly measured with beta (β) coefficients, standard deviations (σ) of returns where tools such as Average True Range, Bollinger Bands, Keltner Channel, Squeeze Indicator, etc presents volatility concept
Volatility often refers to the amount of uncertainty or risk related to the size of changes in a security's value. The higher the volatility, the riskier the security - the price of the security can change dramatically over a short time period in either direction. A lower volatility - security's value does not fluctuate dramatically, and tends to be more steady
This study, Volatility Bands , attempts to present a way to measure and visualize volatility , using standard deviations (σ) and average true range indicator, and aims to point out areas that might indicate potential trading opportunities
I will try to explain the usage with examples,
same setup with different option selected
as you may observe from the examples different setting may have advantages and disadvantages over one another, it is recommended to verify a trading setup with different available options.
Additionally, It is recommended to use this indicator in conjunction with other technical indicators, or verify using chart/candle patterns. Below is an usage example using in conjunction with other indicator, in the given example “Neglected Volume by DGT” is selected
Similarities and Differences
Bollinger Bands depicts two standard deviations above and below a simple moving average, and Keltner Channel depicts two times average true range (ATR) above and below an exponential moving average
Volatility Bands study combines the approach of both Bollinger Bands and Keltner Channel, with different settings and different visualization
Default settings are one standard deviations and one time average true range (ATR) above and below 13 period exponential moving average. Setting can be adjusted by users but let me remind all testes are performed with the default settings.
Mathematically expressed as
Upper band area between “ema + stdev” and “ema + atr”
Lower band area between “ema – stdev” and “ema – atr”
A different display is added with the inspiration I get from one of the @quantgym ‘s study, many thanks @quantgym 😉
When difference band display is selected the study will reflect the area between “ema + stdev – atr” and “ema – stdev + atr”. As shown in the examples above
Note: standard deviation calculation can be adjusted based on price action or its moving average.
Other differentiation between BB and KC is with V-BANDS mostly we look for trade opportunities when price action move out of the bands and in most cases we assume market is consolidating when the price action is within the bands
The other indicator that presents similarities to Volatility Bands is Squeeze Indicator, which measures the relationship between Bollinger Bands and Keltner's Channels to help identify consolidations and signal when prices are likely to break out. Mainly Volatility Bands is different version of Squeeze indicator, in fact the purpose is almost same but visualization is completely different. Additionally Volatility Bands Offers trading opportunities whereas Squeeze indicator only presents market states unless a momentum indicator is adapted to Squeeze indicator.
Disclaimer:
Trading success is all about following your trading strategy and the indicators should fit within your trading strategy, and not to be traded upon solely
The script is for informational and educational purposes only. Use of the script does not constitute professional and/or financial advice. You alone have the sole responsibility of evaluating the script output and risks associated with the use of the script. In exchange for using the script, you agree not to hold dgtrd TradingView user liable for any possible claim for damages arising from any decision you make based on use of the script

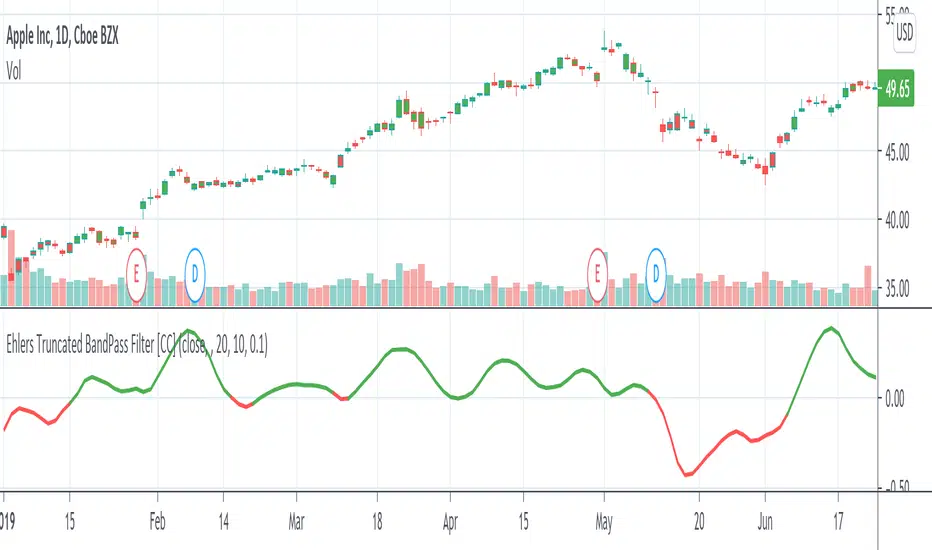
Ehlers Truncated BandPass Filter [CC]Hot off the presses! The Truncated BandPass Filter was created by John Ehlers (Stocks & Commodities July 2020) and this is a much more reactive version of his original bandpass filter. When the indicator rises above 0 then it is an uptrend and when it falls below 0 then it is in a downtrend. Buy when the indicator line is red and sell when it is green.
Let me know if there are other scripts you would like to see me publish or if you want something custom done!

Flagging BandsIntroduction
A pun between the word flag and the adjective flagging (less dynamic) , this indicator have two bands who react faster when in contact to the price. Imagine you are under sheets, if you abruptly rise, the sheets will instantaneously go up, then if you abruptly get down, the sheets will fall slowly until being in contact with a surface, this is because of a type of friction called drag or air resistance , this force is described in fluid dynamics and i inspired myself from that for the creation of the indicator.
The indicator
The indicator is made of two bands, one upper band and one lower band, then a weighted average of each bands, this average is weighted depending on which band the price is closer. The length control the period of the indicator, in general higher lengths will create wider bands, you must consider that this parameter behave differently than other ones and may create slower results in comparison with other bands indicators while having the same length period.
The indicator can use a simple breakout methodology (see trailing stop part) but can sometime provide support and resistance points, in fact i believe that when the average variability/volatility of band A is higher than the average variability/volatility of band B and that the price cross band B then price will reverse its direction, this claim is not justified, research is needed.
Trailing Stop Mod
It is possible to make the indicator act as a trailing stop, in order to do so just tick the trailing stop mod box.
The average/bands will automatically disappear being replaced by the trailing stop.
Conclusion
I was just playing around when making the skeleton of the indicator, i hope the code is easy to understand, if you need some kind of explanation just pm me, i'm always open to help people/receive suggestions.
Best Regards


[JR] Multi Bollinger Heat BandsBollinger Bands, with incremented additional outer bands.
Set as you would normally, but with the addition of an incremental value for the added outer bands.
Defaults with Length 20, base multiplier of 2.0, and an Increment value of 0.5 for additional outer bands at 2.5 and 3.0. Adjust values to suite your needs.
All lines and zones have colour and formatting options available - because why not eh?

Acc/Dist. Cloud with Fractal Deviation Bands by @XeL_ArjonaACCUMULATION / DISTRIBUTION CLOUD with MORPHIC DEVIATION BANDS
Ver. 2.0.beta.23:08:2015
by Ricardo M. Arjona @XeL_Arjona
DISCLAIMER
The Following indicator/code IS NOT intended to be a formal investment advice or recommendation by the author, nor should be construed as such. Users will be fully responsible by their use regarding their own trading vehicles/assets.
The embedded code and ideas within this work are FREELY AND PUBLICLY available on the Web for NON LUCRATIVE ACTIVITIES and must remain as is.
Pine Script code MOD's and adaptations by @XeL_Arjona with special mention in regard of:
Buy (Bull) and Sell (Bear) "Power Balance Algorithm by Vadim Gimelfarb published at Stocks & Commodities V. 21:10 (68-72).
Custom Weighting Coefficient for Exponential Moving Average (nEMA) adaptation work by @XeL_Arjona with contribution help from @RicardoSantos at TradingView @pinescript chat room.
Morphic Numbers (PHI & Plastic) Pine Script adaptation from it's algebraic generation formulas by @XeL_Arjona
Fractal Deviation Bands idea by @XeL_Arjona
CHANGE LOG:
ACCUMULATION / DISTRIBUTION CLOUD: I decided to change it's name from the Buy to Sell Pressure. The code is essentially the same as older versions and they are the center core (VORTEX?) of all derived New stuff which are:
MORPHIC NUMBERS: The "Golden Ratio" expressed by the result of the constant "PHI" and the newer and same in characteristics "Plastic Number" expressed as "PN". For more information about this regard take a look at: HERE!
CUSTOM(K) EXPONENTIAL MOVING AVERAGE: Some code has cleaned from last version to include as custom function the nEMA , which use an additional input (K) to customise the way the "exponentially" is weighted from the custom array. For the purpose of this indicator, I implement a volatility algorithm using the Average True Range of last 9 periods multiplied by the morphic number used in the fractal study. (Golden Ratio as default) The result is very similar in response to classic EMA but tend to accelerate or decelerate much more responsive with wider bars presented in trending average.
FRACTAL DEVIATION BANDS: The main idea is based on the so useful Standard Deviation process to create Bands in favor of a multiplier (As John Bollinger used in it's own bands) from a custom array, in which for this case is the "Volume Pressure Moving Average" as the main Vortex for the "Fractallitly", so then apply as many "Child bands" using the older one as the new calculation array using the same morphic constant as multiplier (Like Fibonacci but with other approach rather than %ratios). Results are AWSOME! Market tend to accelerate or decelerate their Trend in favor of a Fractal approach. This bands try to catch them, so please experiment and feedback me your own observations.
EXTERNAL TICKER FOR VOLUME DATA: I Added a way to input volume data for this kind of study from external tickers. This is just a quicky-hack given that currently TradingView is not adding Volume to their Indexes so; maybe this is temporary by now. It seems that this part of the code is conflicting with intraday timeframes, so You are advised.
This CODE is versioned as BETA FOR TESTING PROPOSES. By now TradingView Admins are changing lot's of things internally, so maybe this could conflict with correct rendering of this study with special tickers or timeframes. I will try to code by itself just the core parts of this study in order to use them at discretion in other areas. ALL NEW IDEAS OR MODIFICATIONS to these indicator(s) are Welcome in favor to deploy a better and more accurate readings. I will be very glad to be notified at Twitter or TradingView accounts at: @XeL_Arjona

Indicators: Hurst Bands and Hurst OscillatorThese 2 indicators are derivative work from Jim Hurst's book - "The Magic of Stock Transaction Timing".
The bands are % bands around a median that gets calculated according to Hurst's formula. The outer bands (called ExtremeBands) signify extreme overbought/oversold conditions. Inner bands signify potential pullback points. As you can see, they also act as dynamic S/R levels.
The oscillator bands match the bands overlaid on price, so you will get an excellent indication of where the price is gonna do by using the oscillator along with the bands. Note that Hurst Oscillator can be used separately too, there is no technical dependency on Hurst Bands.
More info on Hurst Method:
www.readtheticker.com

Multi Timeframe 7 Bollinger Bands by CSPMulti Timeframe 7 Bollinger Bands by CSP IT SHOW 1MT,5MT,10MT,1HR,D, W,M BOLLINGER BAND IN ASINGLE CHART.
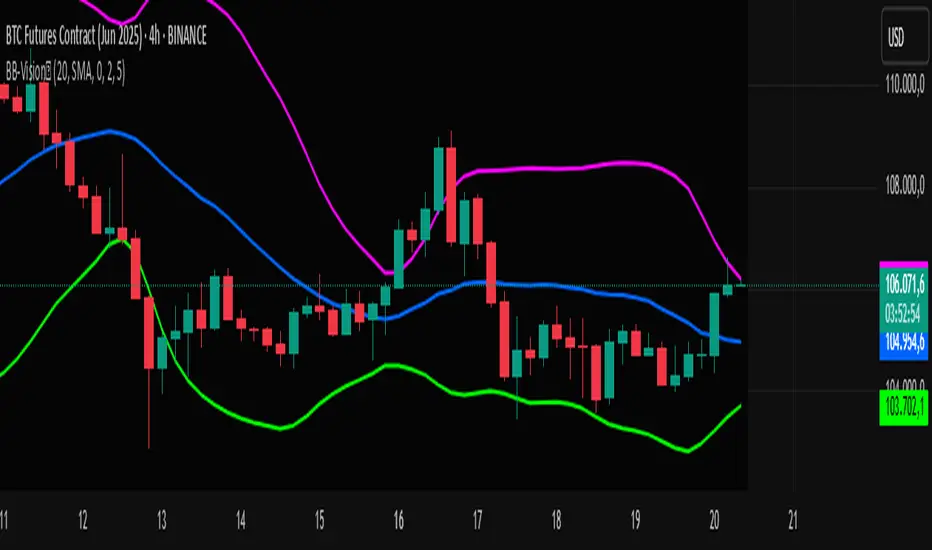
Bands Vision-XBands Vision-X (BB-Vision-X) – Full Description
Description:
Bands Vision-X is an indicator based on dynamic bands constructed from customizable moving averages and standard deviation, allowing you to visualize potential support and resistance zones, volatility, and market conditions. It uses an adjustable moving average (with multiple options such as SMA, EMA, WMA, JMA, LSMA, DEMA, and TEMA) to define the central line, and upper and lower bands calculated by standard deviation multiplied by an adjustable factor. The bands are smoothed by a Hull Moving Average (HMA) to reduce noise and improve clarity.
How to Use
The bands indicate potential support and resistance levels.
The central line serves as a dynamic price reference.
The distance between bands reflects market volatility.
Touches or breakouts of the bands may signal entry or exit opportunities.
Parameters
Parameter Description Default
Standard Error Band Period Period for moving average and standard deviation 20
Moving Average Type Type of moving average (SMA, EMA, etc.) SMA
Standard Deviation Multiplier Multiplier for standard deviation 2.0
Band Lines Smoothing Period Period for smoothing the bands (HMA) 5
Technical Notes
The JMA function used is not the original Jurik version but an approximate and open implementation based on publicly available TradingView community code.
Developed in Pine Script v6 with optimized and clean code.
Recommendations
Ideal for traders seeking a clear view of volatility and dynamic support/resistance levels.
Should not be used in isolation; it is recommended to combine with volume analysis, price action, or other technical indicators.
Adjust the period and multiplier according to the asset and timeframe for better effectiveness.
VWAP Bands [TradingFinder] 26 Brokers Data (Forex + Crypto)🔵 Introduction
Indicators are tools that help analysts predict the price trend of a stock through mathematical calculations on price or trading volume. It is evident that trading volume significantly impacts the price trend of a stock symbol.
The Volume-Weighted Average Price (VWAP) indicator combines the influence of trading volume and price, providing technical analysts with a practical tool.
This technical indicator determines the volume-weighted average price of a symbol over a specified time period. Consequently, this indicator can be used to identify trends and entry or exit points.
🟣 Calculating the VWAP Indicator
Adding the VWAP indicator to a chart will automatically perform all calculations for you. However, if you wish to understand how this indicator is calculated, the following explains the steps involved.
Consider a 5-minute chart. In the first candle of this chart (which represents price information in the first 5 minutes), sum the high, low, and close prices, and divide by 3. Multiply the resulting number by the volume for the period and call it a variable (e.g., X).
Then, divide the resulting output by the total volume for that period to calculate your VWAP. To maintain the VWAP sequence throughout the trading day, it is necessary to add the X values obtained from each period to the previous period and divide by the total volume up to that time. It is worth noting that the calculation method is the same for intervals shorter than a day.
The mathematical formula for this VWAP indicator : VWAP = ∑ (Pi×Vi) / ∑ Vi
🔵 How to Use
Traders might consider the VWAP indicator as a tool for predicting trends. For example, they might buy a stock when the price is above the VWAP level and sell it when the price is below the VWAP.
In other words, when the price is above the VWAP, the price is rising, and when it is below the VWAP, the price is falling. Major traders and investment funds also use the VWAP ratio to help enter or exit stocks with the least possible market impact.
It is important to note that one should not rely solely on the VWAP indicator when analyzing symbols. This is because if prices rise quickly, the VWAP indicator may not adequately describe the conditions. This indicator is generally used for daily or shorter time frames because using longer intervals can distort the average.
Since this indicator uses past data in its calculations, it can be considered a lagging indicator. As a result, the more data there is, the greater the delay.
🟣 Difference Between VWAP and Simple Moving Average
On a chart, the VWAP and the simple moving average may look similar, but these two indicators have different calculations. The VWAP calculates the total price considering volume, while the simple moving average does not consider volume.
In simpler terms, the VWAP indicator measures each day's price change relative to the trading volume that occurred that day. In contrast, the simple moving average implicitly assumes that all trading days have the same volume.
🟣 Reasons Why Traders Like the VWAP Indicator
The VWAP Considers Volume: Since VWAP takes volume into account, it can be more reliable than a simple arithmetic average of prices. Theoretically, one person can buy 200,000 shares of a symbol in one transaction at a single price.
However, during the same time frame, 100 other people might place 200 different orders at various prices that do not total 100,000 shares. In this case, if you only consider the average price, you might be mistaken because trading volume is ignored.
The Indicator Can Help Day Traders: While reviewing your trades, you might notice that the shares you bought at market price are trading below the VWAP indicator.
In this case, there's no need to worry because with the help of VWAP, you always get a price below the average. By knowing the volume-weighted average price of a stock, you can easily make an informed decision about paying more or less than other traders for the stock.
VWAP Can Signal Market Trend Changes: Buying low and selling high can be an excellent strategy for individuals. However, you are looking to buy when prices start to rise and sell your shares when prices start to fall.
Since the VWAP indicator simulates a balanced price in the market, when the price crosses above the VWAP line, one can assume that traders are willing to pay more to acquire shares, and as a result, the market will grow. Conversely, when the price crosses below the line, this can be considered a sign of a downward movement.
🔵 Setting
Period : Indicator calculation time frame.
Source : The Price used for calculations.
Market Ultra Data : If you turn on this feature, 26 large brokers will be included in the calculation of the trading volume.
The advantage of this capability is to have more reliable volume data. You should be careful to specify the market you are in, FOREX brokers and Crypto brokers are different.
Multiplier : Coefficient of band lines.

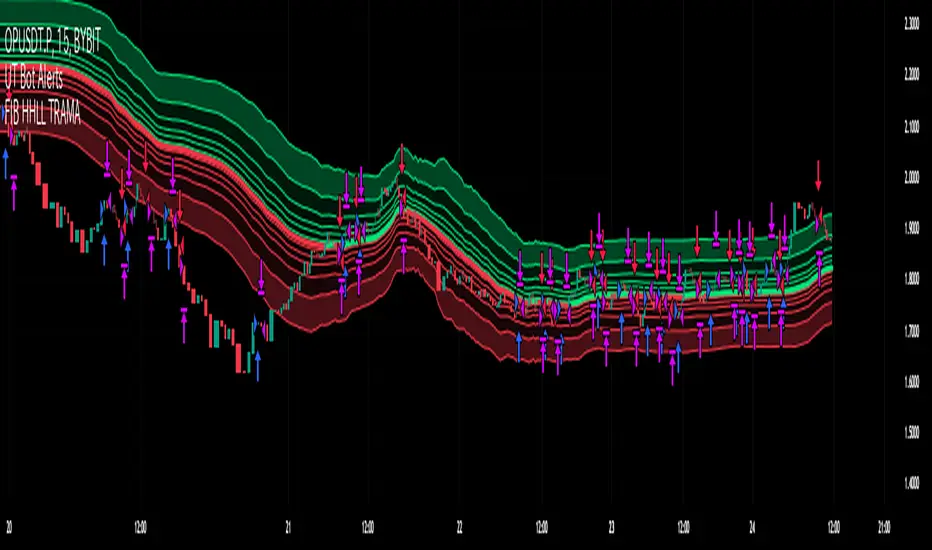
Fibonacci HH LL TRAMA BandLuxAlgo's Trend Moving Adaptive Moving Average was used as a reference to create bands by reading the highest and lowest prices of past bars based on Fibonacci numbers and then multiplying them by the Fibonacci ratio.
LuxAlgo/ LuxAlgo/
In particular, the so-called TRAMA is characterized by its adaptation to the average of the highest and lowest prices over a specific period of time and is used to identify support/resistance.
In order to apply this feature to the maximum extent possible, I used the high or low prices as the source of input, rather than the closing price.
For example,
src = high
not original like
src = close
In addition, I created 6 levels by multiplying the Fibonacci ratio
//Midline
mah = ama1
mal = ama2
m = (mah + mal)/2
//Half Mean Range
dist = (mah - mal)/2
//Levels
h6 = m + dist * 11.089
h5 = m + dist * 6.857
h4 = m + dist * 4.235
h3 = m + dist * 2.618
h2 = m + dist * 1.618
h1 = m + dist * 0.618
l1 = m - dist * 0.618
l2 = m - dist * 1.618
l3 = m - dist * 2.618
l4 = m - dist * 4.235
l5 = m - dist * 6.857
l6 = m - dist * 11.089
If you want to use it for scalping, such as 15 minutes, you can include Fibonacci numbers such as 21,34,55 for a quick reaction type to detect the trend. Also, by including Fibonacci numbers such as 89,144,233, you can see where you stand in the larger trend. Some examples are included below.
For Investors
BTCUSDT 1day Chart Fibonacci number "55"
For Daytraders
BTCUSDT 4hour Chart Fibonacci number "34"
For Scalpers
BTCUSDT 15min Chart Fibonacci number "55"
BTCUSDT 15min Chart Fibonacci number "89"
BTCUSDT 15min Chart Fibonacci number "233"
Fibonacci numbers are 1, 1, 2, 3, 5, 8, 13, 21, 34, 55, 89, 144, 233, 377, 610, etc.,
Fibonacci ratios are 0.618, 1.618, 2.618, 4.236, 6.854, 11.089, etc.,
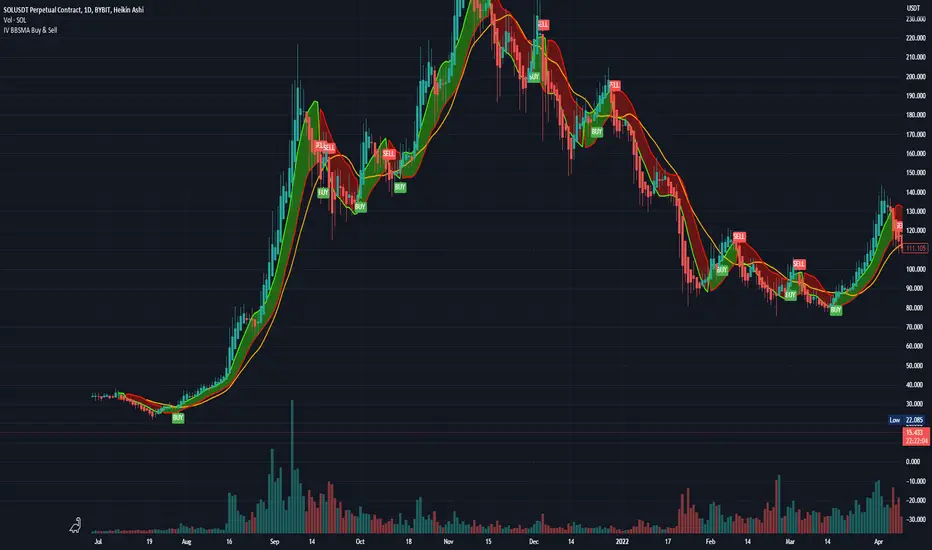
Bollinger Bands and SMA Channel Buy and Sell
This Indicator is a combination of a standard BB indicator incorporated with a SSL Channel by ErwinBeckers which is Simple Moving average with a length of set at 10 (Default) and calculates the high and low set for the default 10 to form a Channel.
The Settings for the Bollinger Band is the standard settings on a normal Bollinger Band - Length 20, source close and Standard dev 2
The setting for the SMA is length 10 and the high and low calculated or that length to form a channel.
The SMA Channel gives a green line for the Up channel and the Red line for the down Channel.
The basis of the indicator is that the Candle close above the Basis line of the BB and the SMA green line will give a buy indicator
and the same for Sell indicator the candle close below the basis BB and the SMA line Red will give a Sell indicator.
Please note that this indicator is a mix of 2 basic indicators found in Trading view, giving Buy and Sell indicators to make things easier to not look for this visually.
This code will be open source for anyone to use or back test or use it for whatever they want.
This code is for my own personal trading and cannot be relied upon. This indicator cannot be used and cannot guarantee anything, and caution should always be taken when trading. Use this with other indicators to give certanty.
Again use this for Paper Trading only.
I want to thank TradingView for its platform that facilitates development and learning.
Ultimate Moving Average Bands [CC+RedK]The Ultimate Moving Average Bands were created by me and @RedKTrader and this converts our Ultimate Moving Average into volatility bands that use the same adaptive logic to create the bands. I have enabled everything to be fully adjustable so please let me know if you find a more useful setting than what I have here by default. I'm sure everyone is familiar with volatility bands but generally speaking if a price goes above the volatility bands then this is either a sign of an extremely strong uptrend or a potential reversal point and vice versa. I have included strong buy and sell signals in addition to normal ones so darker colors are strong signals and lighter colors are normal ones. Buy when the lines turn green and sell when they turn red.
Let me know if there are any other scripts you would like to see me publish!

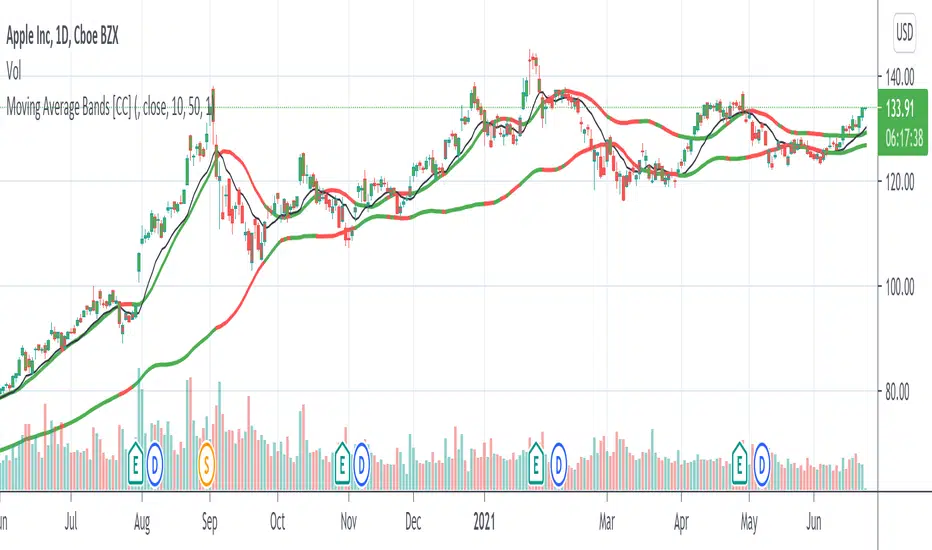
Moving Average Bands [CC]The Moving Average Bands were created by Vitali Apirine (Stocks and Commodities July 2021 pg 16) and this is a very handy trend following indicator that will give you the overall trend of the underlying stock. As the bands rise then the stock is in an uptrend and as they fall then it is a downtrend. If the bands stay flat then it is a sideways and/or choppy market. I did change the middle band from what he originally authored because I believe this gives more accurate buy and sell signals so keep that in mind. Feel free to use a different moving average than the original exponential moving average in the formula. As always buy when the indicator lines turn green and sell when they turn red.
Let me know if there are any other indicators you would like to see me publish!
Overbought/Oversold BandsThe basis of this script is my "Hybrid Overbought/Oversold Detector" which uses many different oscillators to confirm overbought/oversold conditions. The main idea is to generate higher and lower bands around the desired moving average using an average of the volatility (ATR) and the standard deviation (StDev), of course by interfering detected overbought/oversold condition.
Simply put, the more the asset become overvalued/undervalued, the tighter the channel would be and every breakout of the bands announces a return back into the channel in near future.
By default, the multiplier of the standard deviation in the indicator settings is set to 2 which means only less than 5% of price actions would appear outside the bands. Also the default multiplier of the ATR is set to 3 which leads to some similar result, but to achieve more strict results setting StDev multiplier to 3 and ATR multiplier to 4 would be useful.
The type of the central moving average could be picked up from 6 different types which are:
- SMA (Simple Moving Average)
- EMA (Exponential Moving Average)
- HMA (Hull Moving Average)
- LSMA (Least Squares Moving Average)
- TMA (Triangular Moving Average)
- MAEMA (My Personalized Momentum Adjusted EMA)
The latter one leads to a useful combination of the channel with the momentum.
Also the script has multi-timeframe features and the user could apply calculations from other time frames to the current chart.
Hope the idea would be helpful!
Overlay Indicators (EMAs, SMAs, Ichimoku & Bollinger Bands)This is a combination of popular overlay indicators that are used for dynamic support and resistance, trade targets and trend strength.
Included are:
-> 6 Exponential Moving Averages
-> 6 Simple Moving Averages
-> Ichimoku Cloud
-> Bollinger Bands
-> There is also a weekend background marker ideal for cryptocurrency trading
Using all these indicators in conjunction with each other provide great confluence and confidence in trades and price targets.
An explanation of each indicator is listed below.
What Is an Exponential Moving Average (EMA)?
"An exponential moving average (EMA) is a type of moving average (MA) that places a greater weight and significance on the most recent data points. The exponential moving average is also referred to as the exponentially weighted moving average. An exponentially weighted moving average reacts more significantly to recent price changes than a simple moving average (SMA), which applies an equal weight to all observations in the period.
What Does the Exponential Moving Average Tell You?
The 12- and 26-day exponential moving averages (EMAs) are often the most quoted and analyzed short-term averages. The 12- and 26-day are used to create indicators like the moving average convergence divergence (MACD) and the percentage price oscillator (PPO). In general, the 50- and 200-day EMAs are used as indicators for long-term trends. When a stock price crosses its 200-day moving average, it is a technical signal that a reversal has occurred.
Traders who employ technical analysis find moving averages very useful and insightful when applied correctly. However, they also realize that these signals can create havoc when used improperly or misinterpreted. All the moving averages commonly used in technical analysis are, by their very nature, lagging indicators."
Source: www.investopedia.com
Popular EMA lookback periods include fibonacci numbers and round numbers such as the 100 or 200. The default values of the EMAs in this indicator are the most widely used, specifically for cryptocurrency but they also work very well with traditional.
EMAs are normally used in conjunction with Simple Moving Averages.
" What Is Simple Moving Average (SMA)?
A simple moving average (SMA) calculates the average of a selected range of prices, usually closing prices, by the number of periods in that range.
Simple Moving Average vs. Exponential Moving Average
The major difference between an exponential moving average (EMA) and a simple moving average is the sensitivity each one shows to changes in the data used in its calculation. More specifically, the EMA gives a higher weighting to recent prices, while the SMA assigns an equal weighting to all values."
Source: www.investopedia.com
In this indicator, I've included 6 popular moving averages that are commonly used. Most traders will find specific settings for their own personal trading style.
Along with the EMA and SMA, another indicator that is good for finding confluence between these two is the Ichimoku Cloud.
" What is the Ichimoku Cloud?
The Ichimoku Cloud is a collection of technical indicators that show support and resistance levels, as well as momentum and trend direction. It does this by taking multiple averages and plotting them on the chart. It also uses these figures to compute a "cloud" which attempts to forecast where the price may find support or resistance in the future.
The Ichimoku cloud was developed by Goichi Hosoda, a Japanese journalist, and published in the late 1960s.1 It provides more data points than the standard candlestick chart. While it seems complicated at first glance, those familiar with how to read the charts often find it easy to understand with well-defined trading signals."
More info can be seen here: www.investopedia.com
I have changed the default settings on the Ichimoku to suit cryptocurrency trading (as cryptocurrency is usually fast and thus require slightly longer lookbacks) to 20 60 120 30.
Along with the Ichimoku, I like to use Bollinger Bands to not only find confluence for support and resistance but for price discovery targets and trend strength.
" What Is a Bollinger Band®?
A Bollinger Band® is a technical analysis tool defined by a set of trendlines plotted two standard deviations (positively and negatively) away from a simple moving average (SMA) of a security's price, but which can be adjusted to user preferences.
Bollinger Bands® were developed and copyrighted by famous technical trader John Bollinger, designed to discover opportunities that give investors a higher probability of properly identifying when an asset is oversold or overbought."
This article goes into great detail of the complexities of using the Bollinger band and how to use it.
=======
This indicator combines all these powerful indicators into one so that it is easier to input different settings, turn specific tools on or off and can be easily customised.

Exponential Deviation Bands Width [ChuckBanger]This indicator is a compliment to Exponential Deviation Bands . It is the difference between the upper and the lower bands divided by the middle band. It is an easy way to visualize consolidation before price movements or periods of higher volatility.
How it works
During a period of high volatility, the distance between the two bands will widen and Exponential Deviation Bands width will increase. And the opposite occurs during a period of low volatility, the distance between the two bands will contract and Exponential Deviation Bands width will decrease. Meaning there is a tendency for bands to alternate between expansion and contraction.
When the bands are relatively far apart, that is often is a sign that the current trend is ending. When the distance between the two bands is relatively narrow that often is a sign that the market is about to initiate a bigger move in either direction.

Combo Backtest 123 Reversal & High Low Bands This is combo strategies for get a cumulative signal.
First strategy
This System was created from the Book "How I Tripled My Money In The
Futures Market" by Ulf Jensen, Page 183. This is reverse type of strategies.
The strategy buys at market, if close price is higher than the previous close
during 2 days and the meaning of 9-days Stochastic Slow Oscillator is lower than 50.
The strategy sells at market, if close price is lower than the previous close price
during 2 days and the meaning of 9-days Stochastic Fast Oscillator is higher than 50.
Second strategy
As the name suggests, High low bands are two bands surrounding the underlying’s
price. These bands are generated from the triangular moving averages calculated
from the underlying’s price. The triangular moving average is, in turn, shifted
up and down by a fixed percentage. The bands, thus formed, are termed as High
low bands. The main theme and concept of High low bands is based upon the triangular
moving average.
WARNING:
- For purpose educate only
- This script to change bars colors.

Ultimate VWAP Bands- Ultimate VWAP Bands is a script that helps to decide and further clarify areas of oversold and overbought conditions.
- For example, when the price is in the lowest band it is extremely oversold relative to the VWAP . Hence it should be considered a good place to buy with a high risk to reward payoff.
- Each band is set at a fixed offset away from the VWAP . The "VWAP Band Multiplier" adjusts this and is a key part of the script. This allows the indicator to be adjusted based on the assets volatility . For example, with Crypto. A multiplier of 1 would be strongly advised. Whilst a multiplier of 0.1-0.25 would be useful for currency pairs.
- This indicator can be used for all manners of trading. However, it is most effective when used for scalping and swing trading.

Ehlers BandPass Filter [CC]The BandPass Filter was created by John Ehlers (Cycle Analytics For Traders pgs 56-57) and this indicator only works well in choppy markets so I figured it would be useful for the scalpers out there. As you will notice it correctly identifies the peaks and valleys in the underlying stock data but it doesn't work as well when the stock is trending. The black line is a leading signal for the indicator and so I use that as the basis for the buy and sell signals. Make sure to experiment with this one and let me know if you find any better buy and sell signals to work with since I believe this is the first time I have seen this script published. Buy when the line turns green and sell when it turns red.
Let me know if there are other indicators you would like to see me publish or if you want something custom done!

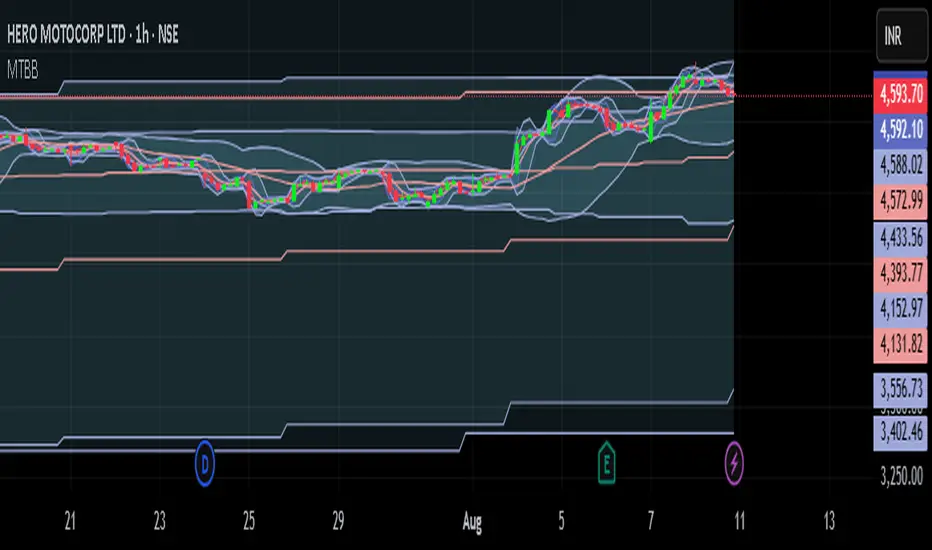
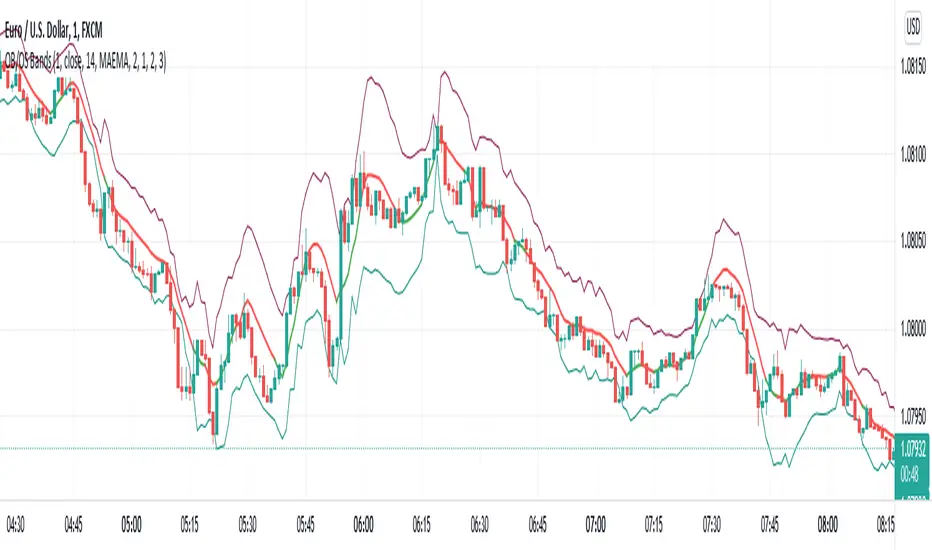
Any MA bands (TMA bands V2)Hi everyone
Website will be opening very shortly :) Sorting out the last details and we're so excited to finally roll-out our different Algorithm Builders for you guys
Forewords
This present script is an evolution of the TMA bands . I would never have expected that script to become so popular to be honest
This is not only a study or idea but a really proven method and I'm glad that many of you are using it already. But please, whenever you see a new script out there, even if it looks cool and promising, please test it on a demo account for a week or on a LIVE account but with tiny amounts every time.
Many times, what you see on the chart is not what will happen in reality. I know that most of you will agree and I know exactly why we see this behavior... I'll give more details in a later post
I have plenty of methods like that one and I'll detail them on my website (and a bit on TradingView) starting next month
TMA bands on steroids
Someone asked me privately to make a generic version of the TMA bands and make it compatible with other standards Moving Average types. That's it for the specifications really as I didn't do much than re-using some piece of my own code
Suggested (but not mandatory) methodology
1) The Take Profit 1 is the middle line, Take Profit 2 is the opposite band.
2) Once the TP1 is hit, set your Stop Loss to breakeven
3) Once the TP2 is hit, if you still want to stay in the trade, set your Stop Loss to the TP1
It will be a powerful tool in your arsenal for some scalp/intraday trades
Wishing you all of you a great and profitable day
PS
It's strictly forbidden to republish this script without my explicit approval. All my posts are copyrighted from now on
Obviously you can use but not republish and get the credit or even worse... some money from your own clients
Dave
____________________________________________________________
Be sure to hit the thumbs up. Building those indicators take a lot of time and likes are always rewarding for me :) (tips are accepted too)
- If you want to suggest some indicators that I can develop and share with the community, please use my personal TRELLO board
- I'm an officially approved PineEditor/LUA/MT4 approved mentor on codementor. You can request a coaching with me if you want and I'll teach you how to build kick-ass indicators and strategies
Jump on a 1 to 1 coaching with me
- You can also hire for a custom dev of your indicator/strategy/bot/chrome extension/python
Disclaimer:
Trading involves a high level of financial risk, and may not be appropriate because you may experience losses greater than your deposit. Leverage can be against you.
Do not trade with capital that you can not afford to lose. You must be aware and have a complete understanding of all the risks associated with the market and trading. We can not be held responsible for any loss you incur.
Trading also involves risks of gambling addiction.
Please notice I do not provide financial advice - my indicators, strategies, educational ideas are intended to provide only some source code for anyone interested in improving their trading
The proprietary indicators and strategies developed by Best Trading Indicator, the object of intellectual property rights are and remain the exclusive property of Best Trading Indicator, at the exclusion of images and videos and texts free of rights or provided by the Company or external legal or physical person.
No assignment of intellectual property rights is carried out through these Terms and Conditions.
Any total or partial reproduction, modification or use of these properties for any reason whatsoever is strictly prohibited without the express written authorization of the Company.
