Bollinger Bands MTF [LonesomeTheBlue]With this script you can follow Bollinger Bands for current and higher time frame together. Higher time frame is calculated by script.
if current period
1m => higher period=5m
3m => higher period=5m
5m => higher period=15m
15m => higher period=1h
30m => higher period=1h
45m => higher period=1h
1h => higher period=4h
2h => higher period=4h
3h => higher period=4h
4h => higher period=1day
1day => higher period=1week
חפש סקריפטים עבור "band"

Trend Trader Bands Strategy This is plots the indicator developed by Andrew Abraham
in the Trading the Trend article of TASC September 1998
It was modified, result values wass averages.
And draw two bands above and below TT line.

Percentage BandsA different version of bollinger bands, I use percentage difference instead of standard deviation.

Trend Trader Bands This is plots the indicator developed by Andrew Abraham
in the Trading the Trend article of TASC September 1998
It was modified, result values wass averages.
And draw two bands above and below TT line.

Standard Error Bandswith the best settings - this indicator is a better version of the bollinger bands, because it uses a linear regression .
Use this carefully and with other indicators.
Interquartile Range BandsInterquartile Range Bands script.
This indicator was originally developed by Alex Orekhov at his home.
The idea based on the interquartile range en.wikipedia.org
If price breaks out from the bands then it is `outlier` price.
After breakouts price always returns to its median.
Watch squeeze/expansion periods.
Anyway use it as a supplement to the other indicators.
I will glad to get your feedback.

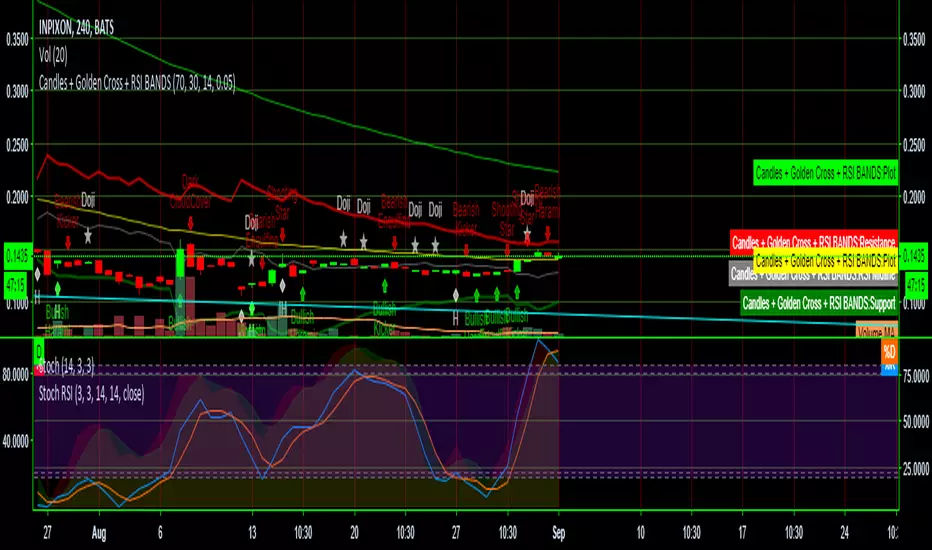
Candles + Golden Cross + RSI BANDSThis script combines three scripts for ease of use
RSI Bands LazyBear
Golden Cross MichMexTrading
Candlestick patterns identified repo32
I combined them because they work exceptionally well together in identifying reversals and other potential changes
Acceleration BandsAcceleration Bands indicator script. This indicator was originally developed by Price Headley.
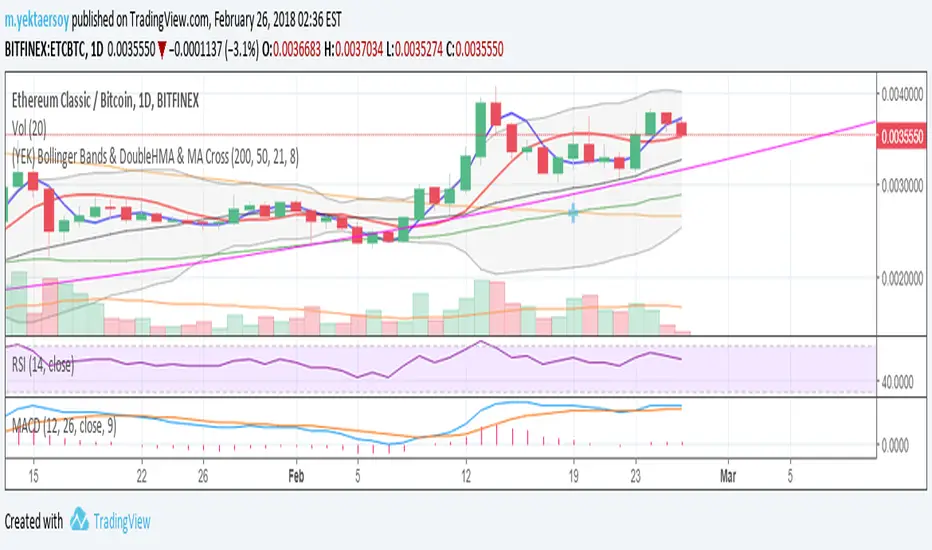
(YEK) Bollinger Bands & DoubleHMA & MA CrossMy favorite indicators ALL-IN-1: Bollinger Bands, Double Hull Moving Average (21,8), Double Moving Average (200,50)
Volume Weighted Average Range Bands [DW]This is an experimental study designed to identify the underlying trend bias and volatility of an instrument over any custom interval TradingView supports.
First, reset points are established at points where the opening price of the interval changes.
Next, Volume Weighted Average Price (VWAP) is calculated. It is the cumulative sum of typical price times volume divided by the cumulative volume. The cumulation starts over upon each reset point.
After that, Volume Weighted Average Range (VWAR) is calculated. The formula structure is the same as VWAP, except using range rather than typical price.
Lastly, the bands are calculated by multiplying the VWAR by the specified multiplier (approximate Golden Ratio by default) and by 1 through 5, then adding to and subtracting from the VWAP.
Custom Bar Colors are included.

Fractal Chaos Bands Backtest The FCB indicator looks back in time depending on the number of time periods trader selected
to plot the indicator. The upper fractal line is made by plotting stock price highs and the
lower fractal line is made by plotting stock price lows. Essentially, the Fractal Chaos Bands
show an overall panorama of the price movement, as they filter out the insignificant fluctuations
of the stock price.
You can change long to short in the Input Settings
WARNING:
- For purpose educate only
- This script to change bars colors.

FIBONACCI BANDS by KIVANCfr3762Calculated with a default value of 14 periods of EMA and 14 periods of Average True Range ( SMA )
There are 4 levels of upper bands and 4 levels of lower bands in the indicator
its calculated adding and subtracting ATR( SMA ) values with coefficients 1, 1.618, 2.618 and 4.236 (Fibonacci ratios) to EMA of close prices.
Top and Bottom Fibo lines are aceepted as significant Resistance and Support levels.

Ichimoku And DD Bollinger BandsIchimoku System Plus Double Bolliner Bands
Made in Mexico City with Love.
Kaufman's Adaptive Moving Average BandsKaufman's Adaptive Moving Average with 6 Bands at a time and trend direction.

Yacine MA Bands ModMashed together the ema-bands from IvanLabrie with some moving average script stuff from ChrisMoody and LazyBear and this is the result. Credit goes to them, 'cause I don't know to how to code tbh. Just copy/pasted stuff untill I got the result I wanted.
Bands work as support/resistance among other things. You can use them to trade breakouts or reversals or whatever.
Combining them with a momentum indicator would probably be useful for timing divergence or OB/OS and stuff like that.
Included moving average types;
SMA
EMA
RMA
WMA
VWMA
HullMA
TilsonMA
TEMA
Not sure if all of them works as they should... y'know since I cant code/script. Looks good to me though.¨
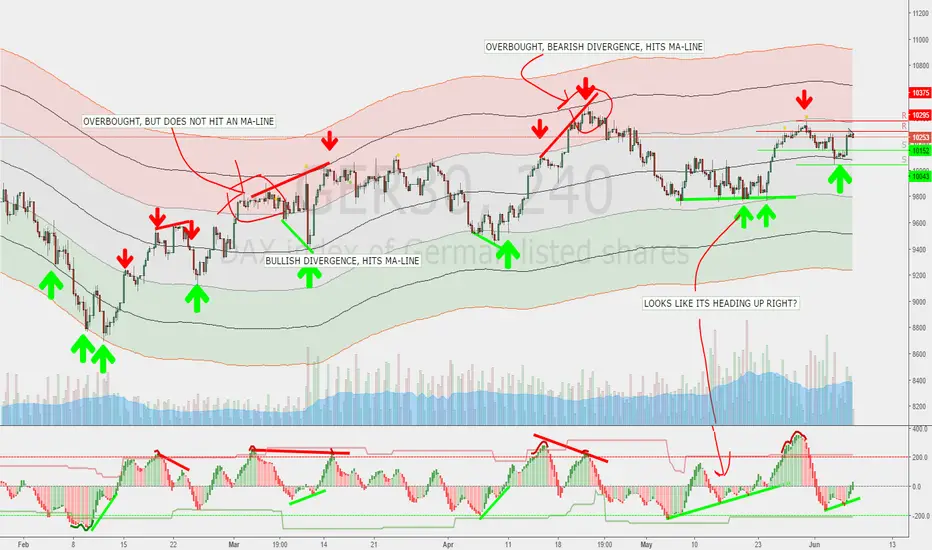
Default should work pretty good for the DAX, But you'll probably want to fiddle a bit with the settings.
Here's a pic of how they can be used. Ofc everything looks simple in hindsight, but you get the point.
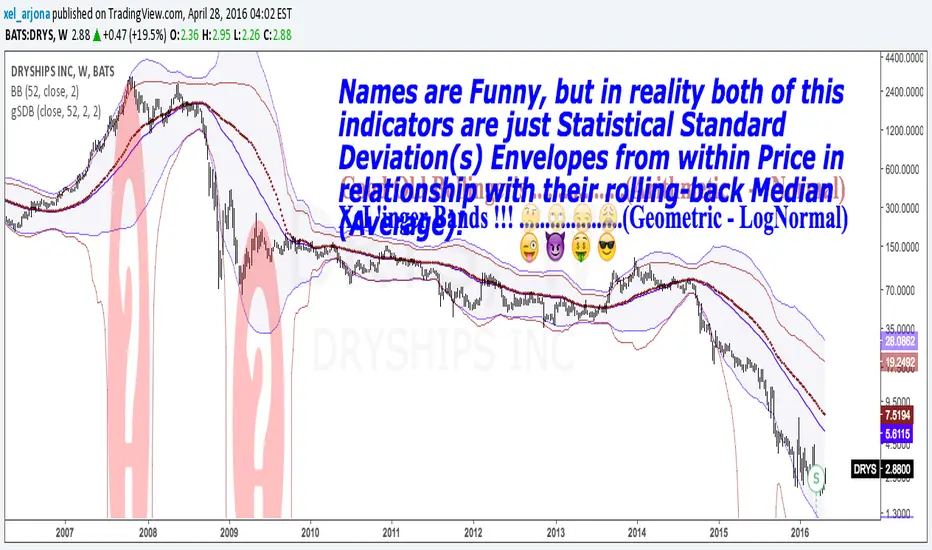
GEOMETRIC STANDARD DEVIATION BANDS v1 by @XeL_ArjonaGEOMETRIC STANDARD DEVIATION BANDS
Ver.1 By Ricardo M Arjona @XeL_Arjona
DISCLAIMER:
The Following indicator/code IS NOT intended to be a formal investment advice or recommendation by the author, nor should be construed as such. Users will be fully responsible by their use regarding their own trading vehicles/assets.
The embedded code and ideas within this work are FREELY AND PUBLICLY available on the Web for NON LUCRATIVE ACTIVITIES and must remain as is.
WHAT'S THIS?
This IS NOT the wheel "Re-Invention"... This is exactly what the name says: A pair of Envelope Bands to measure "volatility", constructed at statistical relation from within price series and their Rolling back MEAN (Simple Moving Average). YES, What Mr. Bollinger did and put it's name to this simple, cleaver and popular formula.
This time, I took the time to make another simple mod, but seems to me to be quite functional in REAL VOLATILE assets like in the example chart: TO USE THEIR GEOMETRIC MODE!!
Cheers!
Any feedback or public modification(s) are quite welcome to the community....!
@XeL_Arjona
Apr 28 2016
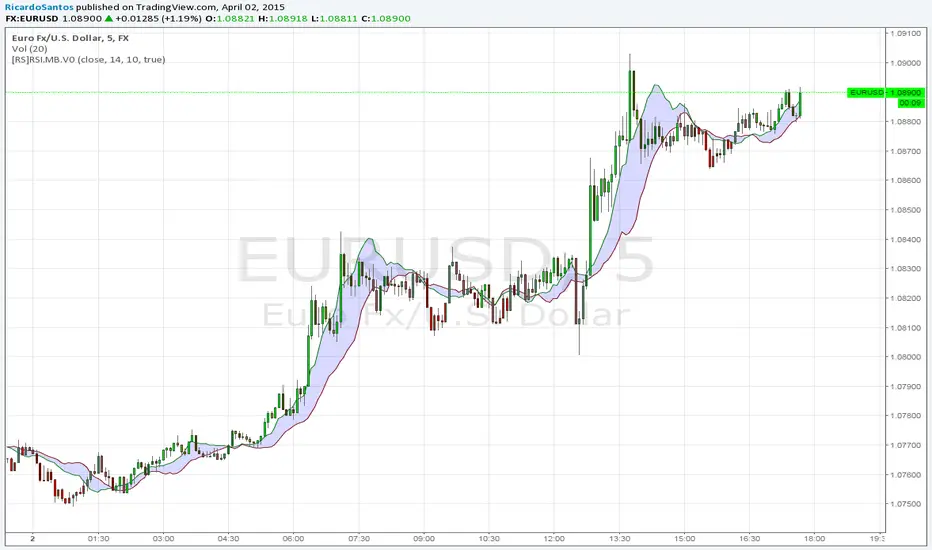
Triple Bollinger BandsI found myself using multiple bollinger bands a lot so I decided to add them all to one script and add the ability to adjust them by 0.2. It has helped me by not taking up as much space in the upper left corner as well as improving my in's and outs of trend continuation trades. If you manage to find a double top at +2 or greater deviation, and with a bearish divergence on the RSI as shown in this picture, GO SHORT SON! This was a fast and easy 35 - 40 pips and if you used your fibonacci for an exit you had little doubt of the final result and could have even been prepared for an immediate reversal knowing you were then at an oversold -2.8 deviation. I could go on and on........
Stochastic In BandsWhat about to display Stochastic Oscilator in EMA-ATR Bands? If you like the idea I would code advanced version

Variable Moving Average Bands [LazyBear]VMA Bands are ATR bands with VMA as its centre. For a description of options, refer to my VMA post:
I have moved VMA calculation in to a separate function. Feel free to use calc_vma() in your scripts. For more MA calculation function (KAMA, VIDYA and others), refer to my complete list of indicators below.
Wish you all a very prosperous New year. Hope these indicators make you all more money this year too :)
List of my other indicators:
- GDoc: docs.google.com
- Chart:

Dual Keltner ChannelsDual Keltner Channels (DKC) Indicator 📊
🔹 About This Indicator
This indicator is an enhanced version of the original Keltner Channel available in TradingView. The Keltner Channel was initially designed as a volatility-based envelope around a moving average, helping traders identify trends, breakouts, and potential reversal zones.
💡 Original Creator: The Keltner Channel concept is based on the work of Chester W. Keltner and was later implemented in various trading platforms, including TradingView’s built-in Keltner Channel indicator.
This script builds upon the TradingView version of the Keltner Channel, adding:
✅ Dual Keltner Bands (Inner & Outer) for better trend and volatility analysis.
✅ Customizable Moving Averages (EMA/SMA) for flexibility.
✅ Multiple Band Calculation Methods (ATR, True Range, Range) for improved accuracy.
✅ Shaded Zones Between the Bands for enhanced visual clarity.
⚡ Credit: This indicator is an enhancement of the original Keltner Channel Indicator in TradingView. All improvements and modifications are made to provide deeper market insights while maintaining the core principles of the original Keltner concept.
🔹 Overview
The Dual Keltner Channels (DKC) indicator overlays two Keltner Channels on the price chart, helping traders spot trends, breakouts, and reversals with greater precision.
Inner Keltner Band (Multiplier 1): Captures normal price movements.
Outer Keltner Band (Multiplier 2): Highlights extreme price movements and potential breakouts.
🔹 Features & Inputs
📌 Main Inputs:
Keltner Channel Length: Defines the lookback period for the moving average calculation.
Source Price: Selects the price type (close, open, high, low) to calculate the bands.
Exponential Moving Average (EMA) Option: Choose between Exponential (EMA) or Simple (SMA) as the basis for calculations.
Bands Style: Selects how the volatility is measured:
Average True Range (ATR) (default)
True Range (TR)
Range (High - Low)
ATR Length: Determines the length of ATR calculations.
Enable Multiplier 1 & 2: Toggle to display/hide inner (multiplier 1) and outer (multiplier 2) bands.
📌 Keltner Channels Calculation:
Moving Average (MA): Uses either EMA or SMA for the midline.
Volatility Band Calculation:
Upper Band 1 (Inner Band): MA + (Multiplier 1 × Volatility Measure)
Lower Band 1 (Inner Band): MA - (Multiplier 1 × Volatility Measure)
Upper Band 2 (Outer Band): MA + (Multiplier 2 × Volatility Measure)
Lower Band 2 (Outer Band): MA - (Multiplier 2 × Volatility Measure)
📌 Visuals & Plotting:
Inner Bands (Multiplier 1): Blue upper & lower lines.
Outer Bands (Multiplier 2): Darker blue upper & lower lines.
Basis Line: White moving average.
Shaded Areas:
Between Upper 1 & Upper 2 (Light Brown Area): Identifies the upper Keltner region.
Between Lower 1 & Lower 2 (Light Brown Area): Identifies the lower Keltner region.
🔹 How to Use the Dual Keltner Channels Indicator
✅ 1. Trend Identification
Price above the upper outer band (Multiplier 2): Strong uptrend – potential continuation.
Price below the lower outer band (Multiplier 2): Strong downtrend – potential continuation.
Price within the inner bands (Multiplier 1): Sideways market – possible consolidation.
✅ 2. Breakout Trading
Break above outer upper band: Indicates a bullish breakout – consider long trades.
Break below outer lower band: Indicates a bearish breakdown – consider short trades.
✅ 3. Overbought & Oversold Conditions
Price touching/exceeding outer bands (Multiplier 2): Potential reversal zones.
Reversal confirmation: Look for candlestick patterns (e.g., Doji, Engulfing) or divergence signals.
✅ 4. Pullback & Entry Zones
Price bouncing from inner bands (Multiplier 1): Good re-entry point in trend direction.
Inner band as support/resistance: Helps in setting stop-loss and profit targets.
🔹 Effective Trading Strategies Using DKC
📌 1. Trend Following Strategy (Using Moving Average & Bands)
✅ Look for price staying above/below the basis line (MA) within the outer bands.
✅ Use pullbacks to the inner bands as re-entry points for trend continuation.
✅ Confirm trend strength with momentum indicators like RSI, MACD.
📌 2. Breakout Trading Strategy
✅ Identify a tight consolidation phase within the inner Keltner bands.
✅ Wait for a strong breakout beyond the outer bands.
✅ Enter long/short trades based on breakout direction.
✅ Place stop-loss at the previous inner band to manage risk.
📌 3. Reversal Strategy (Mean Reversion)
✅ When price extends beyond the outer band (Multiplier 2), look for reversal signals (candlestick patterns, RSI divergence).
✅ Enter counter-trend trades with tight stop-loss beyond the band.
✅ Target the moving average (basis line) as take-profit.
🔹 Final Thoughts 💡
The Dual Keltner Channels (DKC) is a powerful upgrade to the standard Keltner Channel, providing:
✅ Greater clarity on trend strength
✅ More precise breakout & reversal signals
✅ Better visual insights for dynamic market conditions
📌 Best Used With: RSI, MACD, Volume Profile, Price Action Signals.
📌 Works on: Stocks, Forex, Crypto, Commodities, Indices.

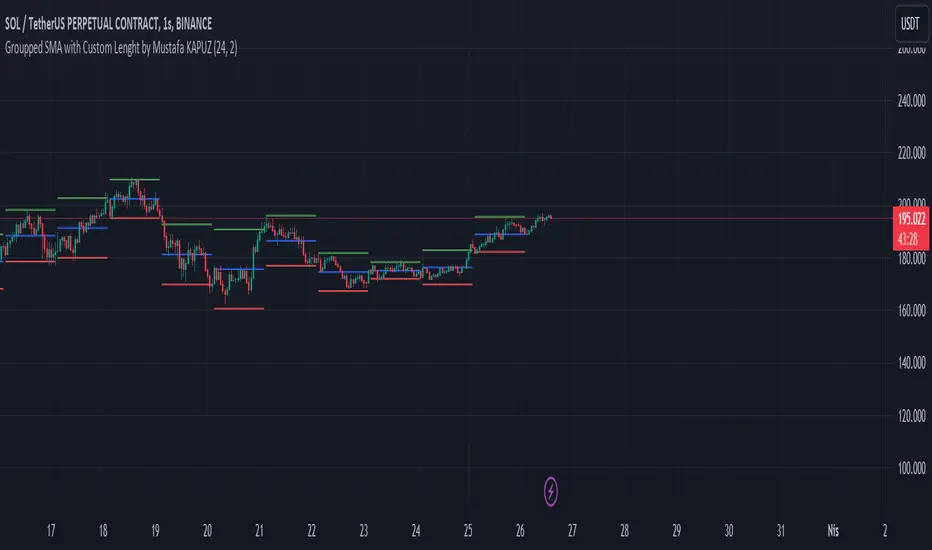
Groupped SMA with Custom Lenght by Mustafa KAPUZThis script is a custom implementation of grouped Simple Moving Averages (SMA) with added Bollinger Bands
Key Features:
Customizable Length (n): Allows users to set the length for the SMA calculation. The length is the number of bars used to calculate the average. This is input by the user and can be adjusted to analyze different time periods.
Standard Deviation Multiplier (StdDev): This input allows users to customize the width of the Bollinger Bands. A higher multiplier results in wider bands, and a lower multiplier results in narrower bands.
Grouped Calculation: Instead of calculating the SMA on a rolling basis, this script groups the data in sets of n (as per the user-defined length) and calculates the SMA for each group. After each group, the calculation resets.
Bollinger Bands: Based on the SMA calculated for each group, the script calculates the standard deviation of prices within the group. Using the standard deviation and the standard deviation multiplier (StdDev), it computes the upper and lower Bollinger Bands.
Dynamic Visualization: For each completed group of n bars, the script draws lines on the chart representing the upper band, lower band, and the SMA itself. These lines help visualize the volatility and the average price level for each group.
How It Works:
Data Grouping: For every candle/bar on the chart, the script sums up the closing prices and counts the number of bars until it reaches the user-defined length (n). It stores closing prices in an array for further calculations.
Average Calculation: Once the count reaches n, it calculates the average closing price for the group and resets the sum and count for the next group.
Standard Deviation and Bollinger Bands: With the average calculated, it then computes the standard deviation of the closing prices within the group. This standard deviation, multiplied by the user-defined StdDev multiplier, determines the distance of the Bollinger Bands from the average.
Drawing Lines: Finally, the script visually represents these calculations on the chart by drawing lines for the upper band, lower band, and the average itself for each group.
Purpose and Use:
This script is useful for traders and analysts who prefer to examine price movements and volatility in fixed intervals or groups of bars, rather than the continuous rolling averages provided by traditional SMA and Bollinger Band indicators. By adjusting the length and standard deviation multiplier, users can tailor the indicator to fit various trading strategies, time frames, and market conditions. This grouped approach can provide unique insights into market trends, potential reversals, and volatility patterns that might not be as evident with standard indicators.