COG-10 + Deviation BandsClassic Center of Gravity, COG
«Center of Gravity»
COG is a weighted moving average, in which new bars have more weight, and old ones have less.
Formula (Pine equivalent):
COG = – Σ (price × (i+1)) / Σ price
• i = 0 – the most recent bar
• i = length-1 – the oldest bar
The minus sign simply flips the curve so that the extremes coincide with the price reversals.
Bars: | 9 | 8| 7 | 6| 5| 4| 3 | 2 | 1 | 0 |
Weight: |1 | 2 | 3 | 4| 5| 6| 7| 8 | 9| 10|
Where COG is used
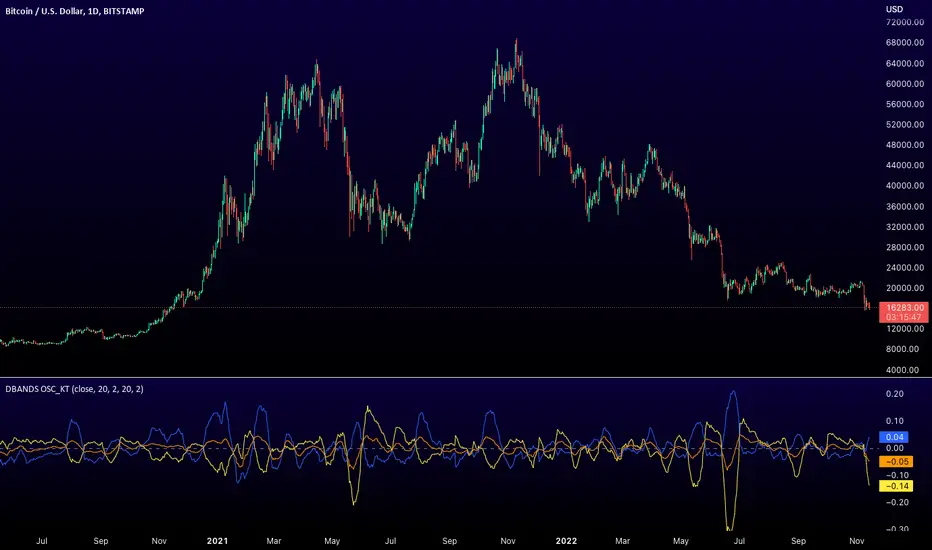
Reversal zones
– when the price moves far from the COG, it is considered «overbought/oversold»; return to COG – potential reversal.
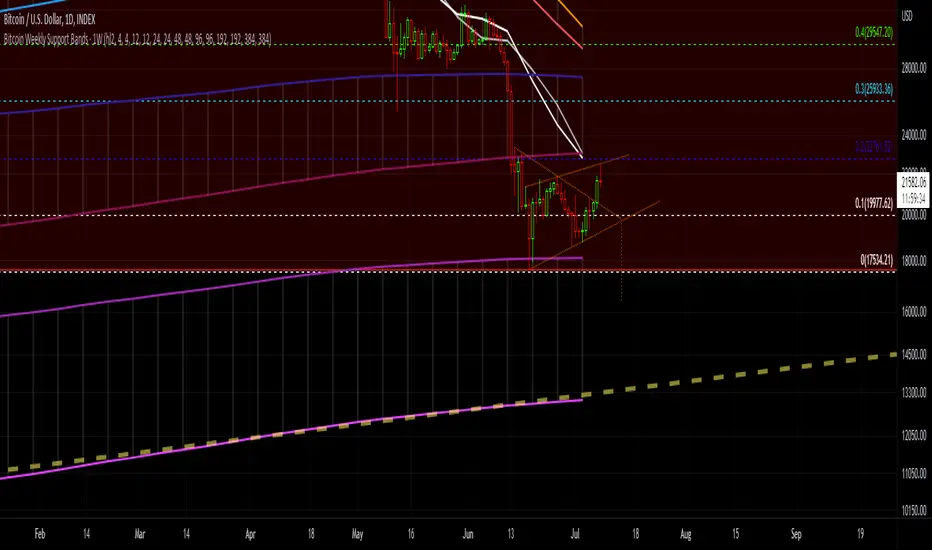
Dynamic support/resistance
– in a sideways trend, the price often bounces off the COG.
Trend filter
– if COG grows → uptrend, falls → downtrend.
Strategy pairs
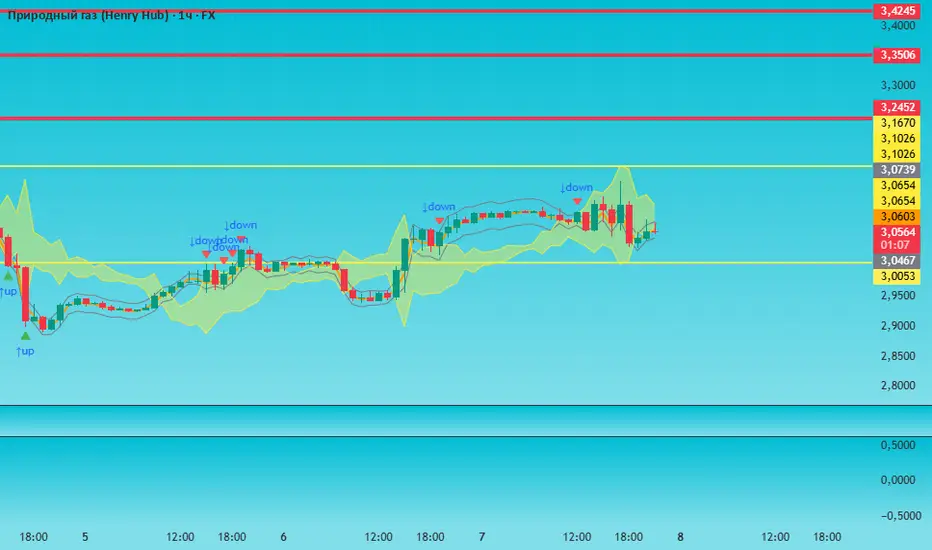
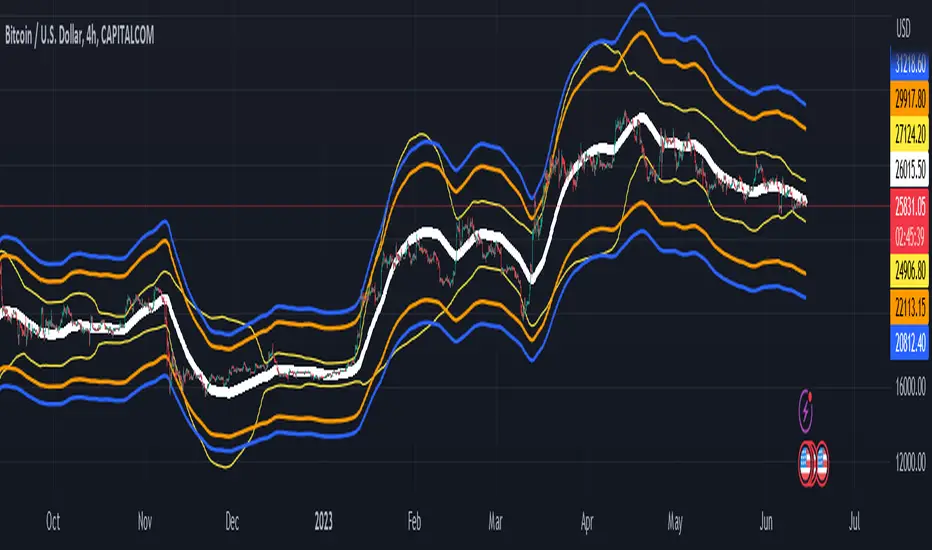
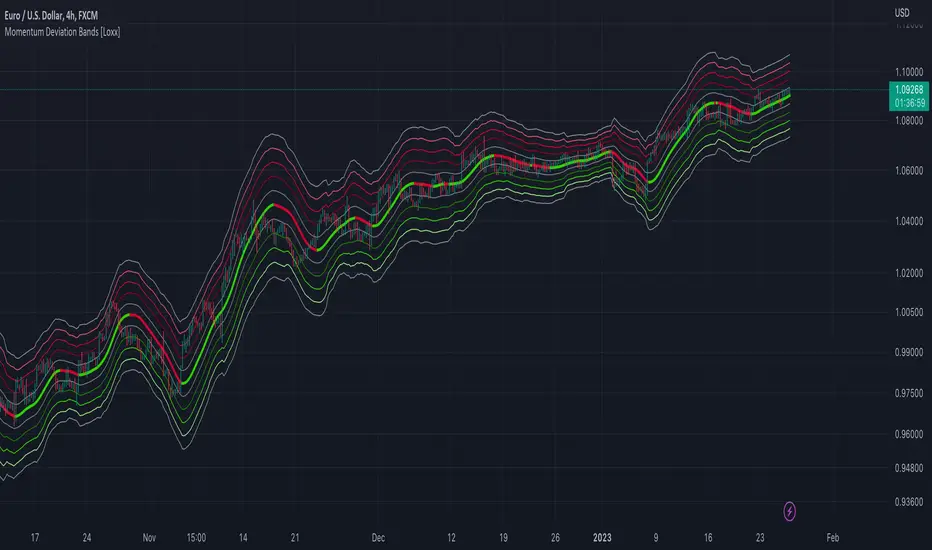
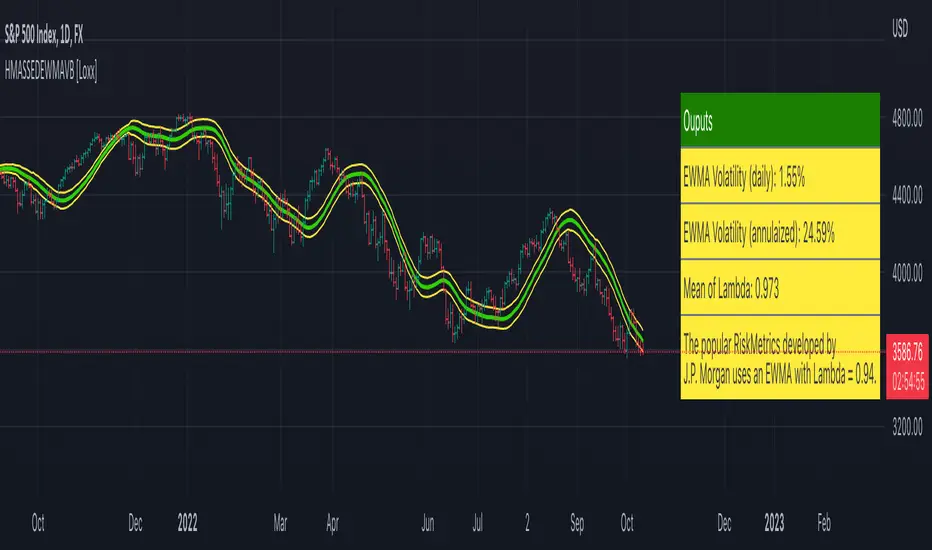
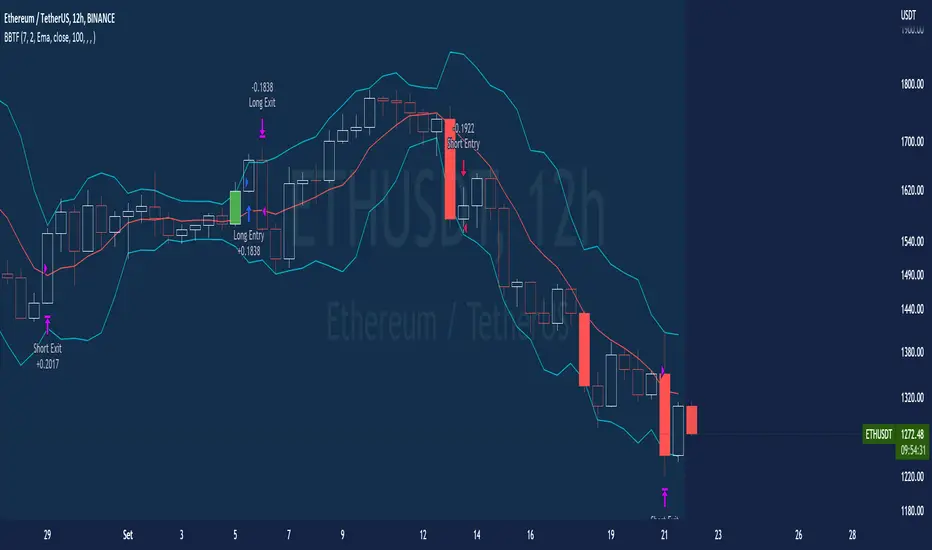
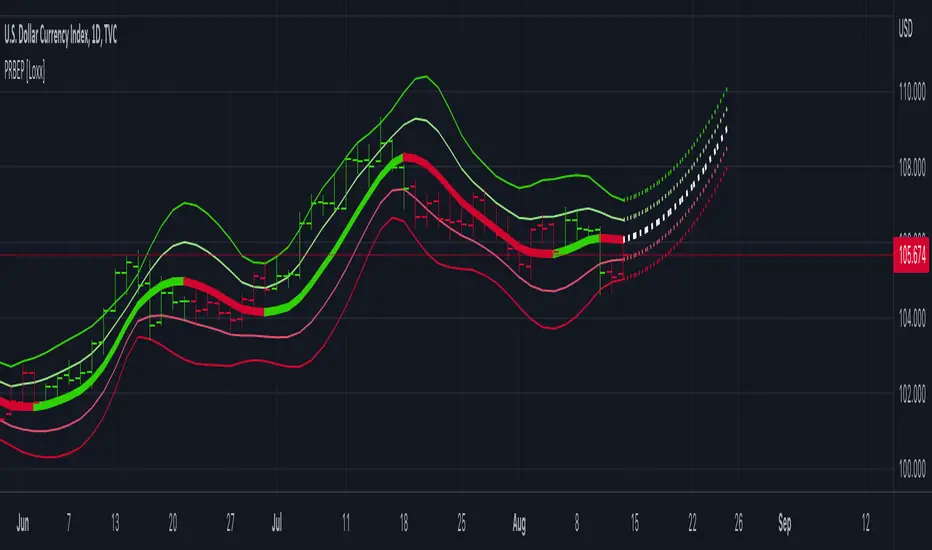
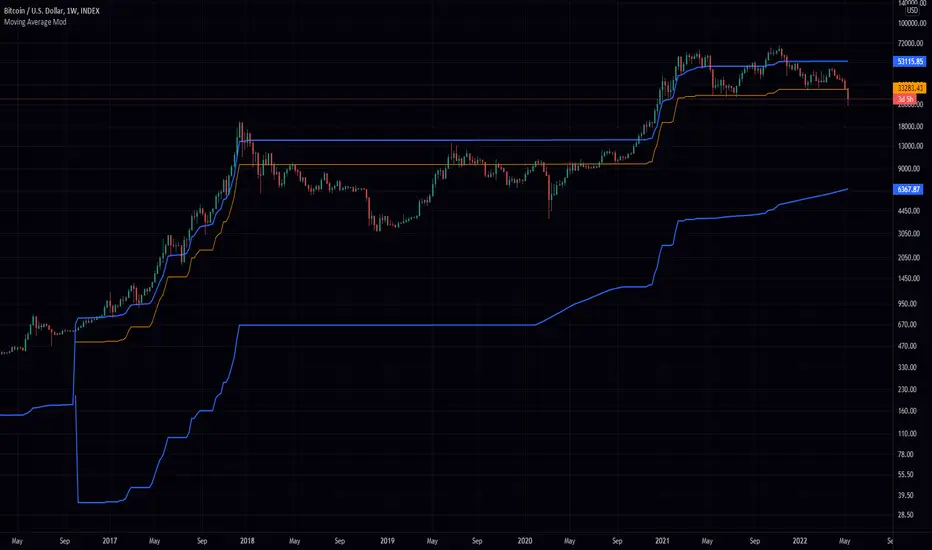
• COG + deviation bands (analogous to Bollinger) is given in lines
• COG + RSI – confirmation of divergences
• COG + volume (weighted by volume) is given in yellow lines
Перевод для русской аудитории
Classic Center of Gravity, COG
«Центр тяжести»
COG – это взвешенное скользящее среднее, в котором новые бары имеют больший вес, а старые – меньший.
Формула (Pine-эквивалент):
COG = – Σ (price × (i+1)) / Σ price
• i = 0 – самый свежий бар
• i = length-1 – самый старый бар
Знак «минус» просто переворачивает кривую, чтобы экстремумы совпадали с разворотами цены.
Бары: | 9 | 8| 7 | 6| 5| 4| 3 | 2 | 1 | 0 |
Вес: |1 | 2 | 3 | 4| 5| 6| 7| 8 | 9| 10|
Где применяют COG
Разворотные зоны
– когда цена отходит далеко от COG, считается «перекупленностью/перепроданностью»; возврат к COG – потенциальный разворот.
Динамическая опора/сопротивление
– в боковике цена часто отталкивается от COG.
Фильтр тренда
– если COG растёт → восходящий тренд, падает → нисходящий.
Пары стратегий
• COG + полосы отклонения (аналог Bollinger) приводится в линиях
• COG + RSI – подтверждение дивергенций
• COG + объём (взвешивать по volume) приводится в желтых линиях
אינדיקטור Pine Script®