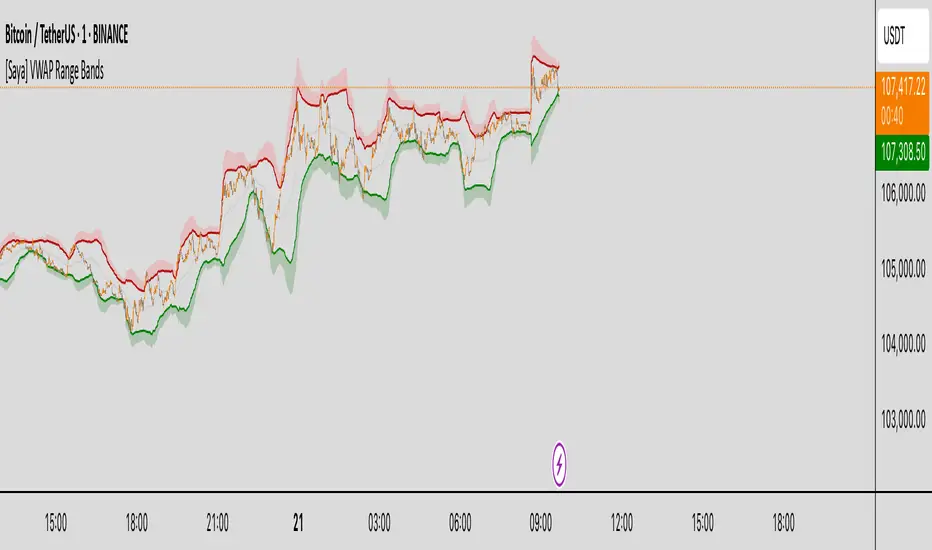
Session Pivots + EMA20/50 + Bollinger BandsMulti-tool indicator combining session pivots, EMA trend filters, Bollinger Bands, and alerts for intraday trading.
📌 Description
One of the biggest advantages of this indicator is that it supports TradingView’s ALERT system, so traders can be notified the moment price crosses the daily/session pivot level. This allows faster decision-making without constant chart watching.
This script combines three powerful tools into a single indicator:
Session Pivot Levels (with Support/Resistance): Automatically calculates pivot, R1–R3 and S1–S3 levels based on the previous trading session (London, New York, Asia, or custom). Levels are plotted with clean labels and connector lines so you always see the exact price values ahead of time.
EMA Trend Filters (20 & 50): Tracks short- and medium-term market direction with two popular exponential moving averages, helping confirm entries and exits.
Bollinger Bands (fully customizable): Adds volatility bands with choice of SMA, EMA, SMMA, WMA, or VWMA for the middle line, plus adjustable standard deviation and offset.
✅ Key Features
Auto-detects London, New York, and Asian sessions or set your own custom session.
Displays up to 3 levels of support and resistance from the previous session.
Clean label display with customizable theme options (Dark, Light, Custom).
Alerts included: Get notified instantly when price crosses above or below the Pivot.
EMA20/50 trend confirmation built-in.
Bollinger Bands with multiple moving average types and volatility settings.
Works for Forex, Crypto, Indices, Commodities — optimized for intraday & scalping.
This makes it a complete intraday toolkit, reducing the need to load multiple separate indicators.
📄 Full documentation available here: [ link ]
חפש סקריפטים עבור "bands"
Bollinger Bands (Log Scale)📈 Bollinger Bands on log scale are broken.
Many traders use log charts for better price symmetry—but still apply Bollinger Bands calculated on linear price. That mismatch creates distorted signals.
Here’s what I found:
- Standard deviation becomes misleading on log scale
- Band width no longer reflects true volatility
- Breakout signals lose behavioral clarity
🛠 So I rewrote the logic.
My version calculates Bollinger Bands using log(price) for both mean and deviation, then maps the result back to price. It behaves correctly on log charts and aligns better with behavioral scoring.
Price Bands ScriptThis Pine Script indicator visually marks customizable percentage bands below the 52-week high of a security, even if historical data is limited.
• It calculates the highest price over the past 365 days or all available daily bars (whichever is less), ensuring compatibility with new or illiquid securities.
• The user can set two band levels as percentages below the 52-week high from the indicator settings.
• These bands are plotted as horizontal lines, and the area between them is shaded for easy visualization.
• The actual 52-week high is also plotted as a reference line.
• This helps traders identify meaningful pullback zones relative to the yearly high and adapt those levels to different strategies or market conditions
52-Week High Percentage BandsGeneral price band indicator for momentum trading:
How to use the code
Open TradingView and navigate to a chart.
Click the "Pine Editor" tab at the bottom of your screen.
Delete any existing code in the editor window.
Copy and paste the Pine Script code provided above into the Pine Editor.
Click "Add to Chart" to apply the indicator.
How the code works
indicator("52-Week High Percentage Bands", overlay=true): This line names the indicator and tells TradingView to plot it directly on the price chart.
request.security(syminfo.tickerid, "D", ta.highest(high, lookbackPeriod)): This is the most critical part. It fetches the highest price from the daily timeframe over the last 365 days. This ensures accuracy even if your chart is set to a different timeframe (e.g., 4-hour or weekly).
upperBand and lowerBand: These variables calculate the specific price levels for the 10% and 23% bands by multiplying the 52-week high by 0.90 and 0.77, respectively.
plot(): This function draws the horizontal lines on the chart for each band.
fill(): This function takes two plots as arguments and colors the space between them to create the "band" effect.
highestHigh: This optional plot adds a line to show you the exact 52-week high.
TMA Bands with AlertsTMA Bands with Alerts uses bands to indicate the up and downtrend with alerts to show potential reversals. POAYEE
16H Bollinger BandsThis indicator plots Bollinger Bands based on the 16-hour timeframe, regardless of the chart’s current timeframe.
📌 Features:
Uses a higher-timeframe (16H / 960 minutes) SMA as the basis
Upper and lower bands calculated with standard deviation
Adjustable parameters: length, standard deviation multiplier, and source
Works even when applied on lower timeframes (e.g. 1H, 15m), allowing you to overlay higher-timeframe volatility zones on intraday charts
📌 Use cases:
Identify major support and resistance zones from a higher timeframe
Filter out market noise by relying on broader 16H volatility structure
Combine with lower-timeframe signals for more accurate entries and exits
Bollinger Bands (with Width/GaUGE)This overlay plots standard Bollinger Bands and makes volatility obvious. The fill between bands is color-coded by band width (tight = red “squeeze”, wide = teal “expansion”, mid = yellow). A compact table (top-right) shows live BB Gap ($) and BB Width (%), and the width also appears in the status line. Thresholds for squeeze/expansion are user-set. Use it to avoid low-volatility chop and time breakouts when width expands.
Team Undergrounds Magic RSI BandsWhat is this indicator?
This indicator shows RSI but visualize as bands with custom timeframe settings. Normal RSI doesn't really visualse well when the price gets overbought/oversold and generally because of candle closes it can be hard to determine if the price has already touched the prefered RSI level. The custom timeframe allows you to go to shorter or longer timeframes on the chart while maintaining the same timeframe on the RSI indicator.
How does it work?
Add this indicator to the chart, and you'll see 2 bands (green and red). By standard settings, the green band shows when price goes below 30 RSI and the red line when price goes above 70 on the RSI. By standard settings the RSI band is set to 7 hour because this tends to work well with Bitcoin and crypto in general, but the timeframe can be changed in the settings. 12hr, 3hr, 3D, 1W are all good timeframes based off personal preference. The overbought/oversold level and RSI length can also be adjusted.
Indicator is not a financial advice tool, and offcourse, data can always change. Past price does not predict future price by defintion.
Binomial MA BandsThe Binomial MA Bands is a simple and straightforward trading tool that uses a binomial distribution to calculate the moving average and standard deviation of a given price series. It allows users to adjust the length of the moving average and the multiplier for the standard deviation, providing some flexibility in its usage. However, it should be noted that the binomial distribution may not always provide the most accurate representation of market movements and trends, and may not always be the best choice for all traders. Additionally, the tool only has a limited range of adjustable parameters, so it may not be suitable for traders with more advanced or complex strategies. Overall, the Binomial MA Bands may be a useful tool for some traders, but its limitations should be kept in mind when considering its use in trading.
Fibonacci Bands 33 — Pro (auto+fix EMA/ATR + HTF panel)Fibonacci Bands 33 — Pro (auto+fix EMA/ATR + HTF panel)
ATR EMA Bands (Kerry Lovvorn Style) - Fixed Scale//@version=5
indicator("ATR EMA Bands (Kerry Lovvorn Style) - Fixed Scale",
overlay = true,
scale = scale.right, // ⭐ 强制使用右侧价格刻度
precision = 2)
// ——— 参数 ———
src = input.source(close, "Source")
emaLength = input.int(34, "EMA Length")
atrLength = input.int(13, "ATR Length")
atrMult1 = input.float(1.0, "ATR ×1")
atrMult2 = input.float(2.0, "ATR ×2")
atrMult3 = input.float(3.0, "ATR ×3")
// ——— 计算 ———
ema = ta.ema(src, emaLength)
atr = ta.atr(atrLength)
// 上下轨
upper1 = ema + atr * atrMult1
upper2 = ema + atr * atrMult2
upper3 = ema + atr * atrMult3
lower1 = ema - atr * atrMult1
lower2 = ema - atr * atrMult2
lower3 = ema - atr * atrMult3
// ——— 绘图 ———
plot(ema, "EMA", color = color.white, linewidth = 2)
plot(upper1, "Upper 1×ATR", color = color.new(color.green, 0))
plot(upper2, "Upper 2×ATR", color = color.new(color.green, 30))
plot(upper3, "Upper 3×ATR", color = color.new(color.green, 60))
plot(lower1, "Lower 1×ATR", color = color.new(color.red, 0))
plot(lower2, "Lower 2×ATR", color = color.new(color.red, 30))
plot(lower3, "Lower 3×ATR", color = color.new(color.red, 60))
// ——— 可选:在当前 K 线上标记数值,方便你肉眼对比 ———
showDebug = input.bool(false, "Show Debug Labels (for checking value vs position)")
if showDebug
var label lb = na
if barstate.islast
label.delete(lb)
txt = "EMA: " + str.tostring(ema, format.mintick) + "\n" +
"U1: " + str.tostring(upper1, format.mintick) + "\n" +
"U2: " + str.tostring(upper2, format.mintick) + "\n" +
"U3: " + str.tostring(upper3, format.mintick)
lb := label.new(bar_index, upper1, txt, style = label.style_label_right, textcolor = color.white, color = color.new(color.black, 40))
Bollinger Bands ±3σ (No Fill, Paired Colors)±3σまで1つのインジケーターで表示できるシンプルなボリンジャーバンドです。
A simple Bollinger Bands indicator that can display up to ±3σ within a single script.
MTF Bollinger Bands (W/D/4H)MTF Bollinger Bands (W/D/4H)
Always mark the 1W 1D 4H bolinger band regardless of the time frame.
EMA ± ATR BandsPlot the bands from EMA as potential points where may want to enter/exit on principle that price returns to mean over time.
This script was created using Chat GPT.
Bull Market Support Bands (20W SMA & 21W EMA)This indicator plots the 20-week Simple Moving Average (SMA) and the 21-week Exponential Moving Average (EMA), together forming the Bull Market Support Bands (BMSB).
Fully compatible with any chart; values are calculated using the weekly timeframe, even if applied on daily charts.
Adjustable band transparency in settings.
Includes optional alerts when EMA crosses above/below SMA.
Dollar Bands [TNI]This script shows divergences bands implemented by Argentine Goverment this year for the Argentine Currency USDARS.
You can change the fix monthly and date/price init, and create upper or lower band cross alerts.
VIX‑Based σ‑BandsThis Pine Script v5 indicator builds a volatility‑based envelope around yesterday’s close using CBOE’s volatility indices. It dynamically pulls VIX, VXN, VXD or RVX—depending on whether you’re charting ES, NQ, YM or RTY—and converts annualized volatility into dollar‑move bands at ±¼ σ, ±½ σ, ±1 σ, and ±2 σ. Optional “mid‑lines” fill in the gaps between each band for even finer precision.
SYMPL Reversal BandsThis is an expansion of the Hybrid moving average. It uses the same hybrid moving code from the hybrid moving average script with an additional layer using the ta.hma function for some slight additional smoothing. Colors of the bands change dynamically based of the long and short hybrid moving averages running in the background. This can be really helpful in identifying periods to short bounces or long dips.
Below is the explanation of the hybrid moving average
Hybrid Moving Average Market Trend System - , designed to visualize market trends using a combination of three moving averages: FRAMA (Fractal Adaptive Moving Average), VIDYA (Variable Index Dynamic Average), and a Hamming windowed Volume-Weighted Moving Average (VWMA).
Key Features:
FRAMA Calculation:
FRAMA adapts to market volatility by dynamically adjusting its smoothing factor based on the fractal dimension of price movement. This allows it to be more responsive during trending periods while filtering out noise in sideways markets. The FRAMA is calculated for both short and long periods
VIDYA with CMO:
The VIDYA (Variable Index Dynamic Average) is based on a Chande Momentum Oscillator (CMO), which adjusts the smoothing factor dynamically depending on the momentum of the market. Higher momentum periods result in more responsive averages, while low momentum periods lead to smoother averages. Like FRAMA, VIDYA is calculated for both short and long periods.
Hamming Windowed VWMA:
This VWMA variation applies a Hamming window to smooth the weighting of volume across the calculation period. This method emphasizes central data points and reduces noise, making the VWMA more adaptive to volume fluctuations. The Hamming VWMA is calculated for short and long periods, offering another layer of adaptability to the hybrid moving average.
Hybrid Moving Averages:
Dynamic Coloring and Filling:
The script uses dynamic color transitions to visually distinguish between bullish and bearish conditions:
Bollinger Bands Width TresholdsBasic Bollinger Bands Bandwidth. I added dashed lines to indicate the 6%/9% treshold where it's likely to squeeze.
MTF RSI MA System + Adaptive BandsMTF RSI MA System + Adaptive Bands
Overview
MTF RSI MA System + Adaptive Bands is a highly customizable Pine Script indicator for traders seeking a versatile tool for multi-timeframe (MTF) analysis. Unlike traditional RSI, it focuses on the Moving Average of RSI (RSI MA), delivering smoother and more flexible trading signals. The main screenshot displays the indicator in two panels to showcase its diverse capabilities.
Important: Timeframes do not adjust automatically – users must manually set them to match the chart’s timeframe.
Features
Core Component: Built around RSI MA, not raw RSI, for smoother trend signals.
Multi-Timeframe: Analyze RSI MA across three customizable timeframes (default: 4H, 8H, 12H).
Adaptive Bands: Three band calculation methods (Fixed, Percent, StdDev) for dynamic signals.
Flexible Signals: Generated via RSI MA crossovers, band interactions, or directional alignment across timeframes.
Background Coloring: Highlights when RSI MAs across timeframes move in the same direction, aiding trend confirmation.
Screenshot Panels Configuration
Upper Panel: Shows RSI, RSI MA, and fixed bands for reversal strategies (RSI crossing bands).
Lower Panel: Displays three RSI MAs (Alligator-style) for trend-following, with background coloring for directional alignment.
Band Calculation Methods
The indicator offers three ways to calculate bands around RSI MA, each with unique characteristics:
Fixed Bands
Set at a fixed point value (default: 10) above and below RSI MA.
Example: If RSI MA = 50, band value = 10 → upper band = 60, lower = 40.
Use Case: Best for stable markets or fixed-range preferences.
Tip: Adjust the band value to widen or narrow the range based on asset volatility.
Percent Bands
Calculated as a percentage of RSI MA (default: 10%).
Example: If RSI MA = 50, band value = 10% → upper band = 55, lower = 45.
Use Case: Ideal for assets with varying volatility, as bands scale with RSI MA.
Tip: Experiment with percentage values to match typical price swings.
Standard Deviation Bands (StdDev)
Based on RSI’s standard deviation over the MA period, multiplied by a user-defined factor (default: 10).
Example: If RSI MA = 50, standard deviation = 5, factor = 2 → upper band = 60, lower = 40.
Important: The default value (10) may produce wide bands. Reduce to 1–2 for tighter, practical bands.
Use Case: Best for dynamic markets with fluctuating volatility.
Configuration Options
RSI Length: Set RSI calculation period (default: 20).
MA Length: Set RSI MA period (default: 20).
MA Type: Choose SMA or EMA for RSI MA (default: EMA).
Timeframes: Configure three timeframes (default: 4H, 8H, 12H) for MTF analysis.
Overbought/Oversold Levels: Optionally display fixed levels (default: 70/30).
Background Coloring: Enable/disable for each timeframe to highlight directional alignment.
How to Use
Add Indicator: Load it onto your TradingView chart.
Setup:
Reversals: Configure like the upper panel (RSI, RSI MA, bands) and watch for RSI crossing bands.
Trends: Configure like the lower panel (three RSI MAs) and look for fastest MA crossovers and background coloring.
Adjust Timeframes: Manually set tf1, tf2, tf3 (e.g., 1H, 2H, 4H on a 1H chart) to suit your strategy.
Adjust Bands: Choose band type (Fixed, Percent, StdDev) and value. For StdDev, reduce to 1–2 for tighter bands.
Experiment: Test settings to match your trading style, whether scalping, swing trading, or long-term.
Notes
Timeframes: Always match tf1, tf2, tf3 to your chart’s needs, as they don’t auto-adjust.
StdDev Bands: Lower the default value (10) to avoid overly wide bands.
Versatility: Works across markets (stocks, forex, crypto).
Bollinger Bands [LePasha]Bollinger Bands : Advanced Volatility Analysis Made Simple
Discover a refined take on Bollinger Bands that offers clearer market insights and deeper volatility understanding — perfect for traders seeking precision and confidence.
What Is the Bollinger Bands Indicator?
The Bollinger Bands indicator is a powerful, overlay chart tool designed to help traders visualize price volatility and identify potential market extremes more effectively.
Unlike classic Bollinger Bands which use just two standard deviation bands, this enhanced version employs multiple deviation levels around a simple moving average (SMA) to give a richer picture of market dynamics.
Key Features
Multiple Deviation Bands: Instead of only ±2 standard deviations, it uses three extended levels: 2.5, 3.0, and 3.5 standard deviations to highlight subtle and extreme price movements.
Color-coded Volatility Zones: Each band range is filled with translucent red or teal shades to help traders visually grasp the intensity of price moves.
Customizable Length and Toggle: Adjust the length of the bands and enable or disable the indicator easily through inputs.
Why Three Deviation Levels?
Traditional Bollinger Bands (±2 standard deviations) cover approximately 95% of price action, but markets often present significant moves beyond this range that are important to identify for better risk management and trading decisions.
The three deviation levels serve distinct purposes:
Deviation Level Approximate Purpose Market Insight Provided
±2.5 SD Captures strong but fairly common moves Entry/exit trigger zones for trending moves
±3.0 SD Highlights more extreme, less frequent moves Indicates breakout strength or overextension
±3.5 SD Marks rare and extreme price deviations Signals potential reversal or exhaustion
This graduated scale allows traders to differentiate between normal volatility, strong momentum, and possible exhaustion—making it easier to tailor trading decisions according to market context.
How to Use Bollinger Bands
Identify Volatility Zones:
Observe how price interacts with the colored bands:
Price touching or crossing the ±2.5 SD band may indicate a strong move is underway.
Price breaching the ±3.0 or ±3.5 SD bands signals rare, extreme market conditions, which could be either a breakout or a setup for reversal.
Combine With Trend Analysis:
Use in conjunction with trend indicators like moving averages or volume to confirm the direction or strength of moves indicated by the bands.
Adjust Your Stops and Targets:
The layered bands help you set more intelligent stop losses and take profit zones by understanding how far price can reasonably stray.
Visual Clarity for Market Phases:
The shaded fills between bands give intuitive visual cues of volatility expansion and contraction phases.
Why Traders Choose Bollinger Bands
Greater Precision: More nuanced volatility detection than traditional Bollinger Bands.
Visual Elegance: Soft translucent fills and clear band lines reduce clutter while delivering maximum insight.
User-Friendly: Easy to toggle and adjust with minimal setup.
Versatile: Effective across assets, timeframes, and trading styles.
Final Thoughts
The Bollinger Bands indicator is more than just a volatility tool — it's your visual guide to understanding how extreme price moves develop in real-time. Whether you’re entering new trades, managing risk, or hunting reversals, this indicator equips you with superior clarity and confidence.
Add Bollinger Bands to your TradingView toolkit and see volatility like never before.
Stochastic RSI BandsStochastic RSI Bands by // © drbarry92064859
It is suggested to view this indicator on 15m or 5m timeframe with current Default Settings.
This indicator is based on the StochRsi.
It creates color bands based on the direction of multiple timeframe StochRsi.
When the MTF StochRsi's are opposed in direction it produces darker bands and when aligned in direction it produces light bands.
During Green Bands, price tends to be Bullish. During Red Bands, price tends to be Bearish.
During Medium toned Bands, price action tends to be in a correction in existing HTF trend, ranging, or getting ready for reversal.
During Light Bands, price tends to be in Trend in direction of color.
There is usually Dark Bands on either side of a light or medium toned band.
Best to enter in direction of current color, during the dark band after the medium toned bands
And exit in the dark band after the light toned band.
Brown bands tend to indicate reversal of direction and color.
I have experimented with all the timeframes and StochRSI settings and found the best settings to be as follows.
The Default settings are Middle Time Frame: 4H and Higher TimeFrame: D1.
The Default StochRSI settings are 34 RSI, 21 Stochastic, 13 smooth K and 13 smooth D.
It is suggested to use a lower timeframe such as 15m or 5m for entry.
You can experiment with different StochRSI and TimeFrame Settings.
SUGGESTED STRATEGY
Dark Bands after medium toned bands: Look for an entry on lower timeframe (15m or 5m) based on reversal candlestick formations or other indicators in direction of current color.
Light Bands: Do not enter during lighter bands. You should already be in trade during Light Bands
Light Band changes to Dark Band: Exit Trade if already in.
Look for general change of directional bias if a brown band occurs; however wait for dark band after the 2nd wide band following the brown band.
Bollinger Bands & SuperTrend Strategy by Tradinggg HubThis TradingView Pinescript combines Bollinger Bands and a custom SuperTrend indicator to generate trading signals.
Bollinger Bands:
Bollinger Bands are a popular volatility indicator that consists of three lines:
* Basis: A simple moving average (SMA) of the price (default length is 20 periods).
* Upper Band: The basis plus a standard deviation multiplier (default is 2).
* Lower Band: The basis minus a standard deviation multiplier (default is 2).
These bands expand and contract as volatility increases or decreases, helping traders identify potential overbought and oversold conditions.
SuperTrend:
The SuperTrend indicator is a trend-following tool that aims to identify the direction of the price trend. It uses the Average True Range (ATR) to determine the volatility of the market and sets levels above and below the price to indicate potential trend reversals.
How the Strategy Works:
1. Bollinger Bands: The script plots Bollinger Bands around the price, providing insight into the current volatility and potential overbought or oversold conditions.
2. SuperTrend: The script calculates and plots a custom SuperTrend indicator based on user-defined ATR period and factor. It helps visualize the current trend direction and potential trend reversals.
3. Buy Signals: A buy signal is generated when the following conditions are met:
- The price crosses above the SuperTrend line.
- The price is above the Bollinger Bands basis line.
4. Sell Signals: A sell signal is generated when one of the following conditions is met:
- The price crosses below the SuperTrend line.
- The price is below the Bollinger Bands basis line.
Key Parameters:
* Bollinger Bands Length: The number of periods used to calculate the basis (SMA) of the Bollinger Bands.
* Bollinger Bands Multiplier: The factor used to calculate the standard deviation for the upper and lower bands.
* SuperTrend ATR Period: The number of periods used to calculate the Average True Range (ATR) for the SuperTrend.
* SuperTrend Factor: The factor used to determine the distance of the SuperTrend levels from the price.
Customization:
Feel free to experiment with different parameter values to optimize the strategy for your preferred asset and time frame.
Disclaimer:
This script is intended for educational and informational purposes only. It should not be considered as financial advice. Always conduct thorough research and consider your own risk tolerance before making any trading decisions.


