Oscillator OB/OS BarsChoose between 3 different oscillators (RSI, MFI, and StochRSI) to show bars when the oscillator is oversold/overbought.
Green = oversold
Red = overbought
Orange = Bearish "Reversal"
Aqua = Bullish "Reversal"
I created this to help determine patterns with other stuff I'm building. Thought others may find it useful for the same purpose, not to trade based off of this.
Used those 3 oscillators cause their OB/OS levels are clear enough (though I put no effort into the stochrsi like I should've but welp)
enjoy zzzzzz
חפש סקריפטים עבור "bar"

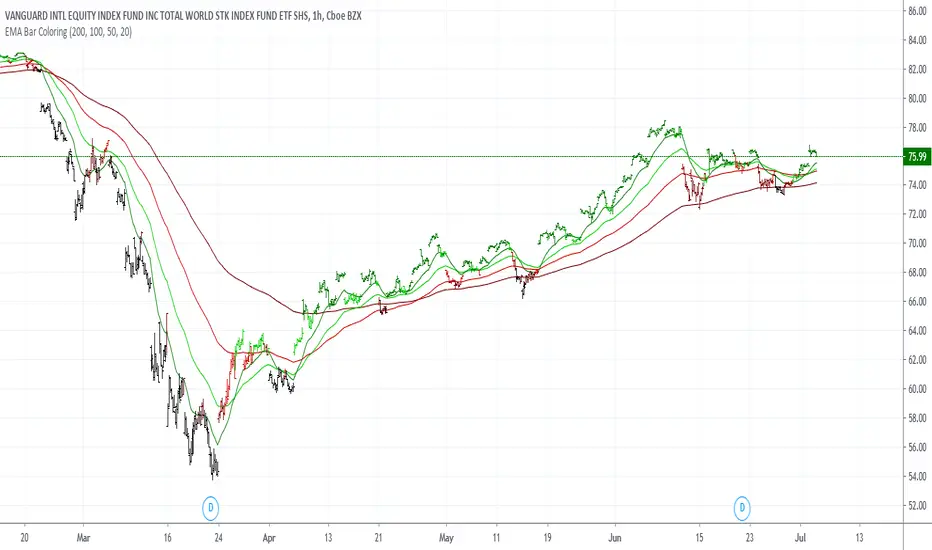
EMA Bar ColoringHi,
This is a simple visualization because I wanted to use tradingview on the cellphone with less Lines and Easy to understand.
There are 4 moving averages for each level of the closing price, the color changes.
The Moving averages can be seen in the option tab.
Also the plot of the closing prices can also be seen.
It works better with bar charts.
Best Regards,
RERS
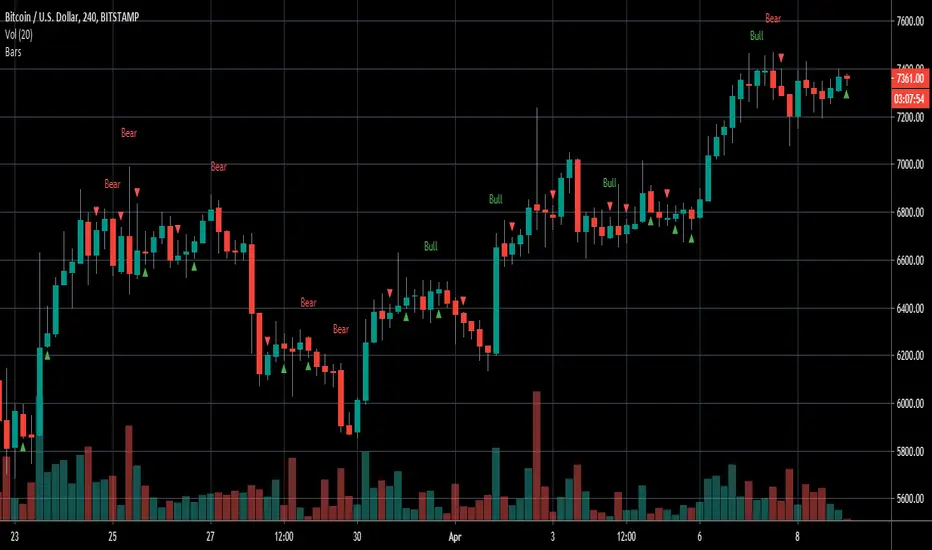
Engulfing Signal Considering Three Bars BeforeIts a simple analysis using Candle Pattern Technique, Engulfing. The script will find the engulf candle by considering three bars before. For Bullish Engulfing it will be colored by yellow, and for Bearish will be white. I reccomend you for using this script in Daily Time Frame.
Enjoyyyy!!!

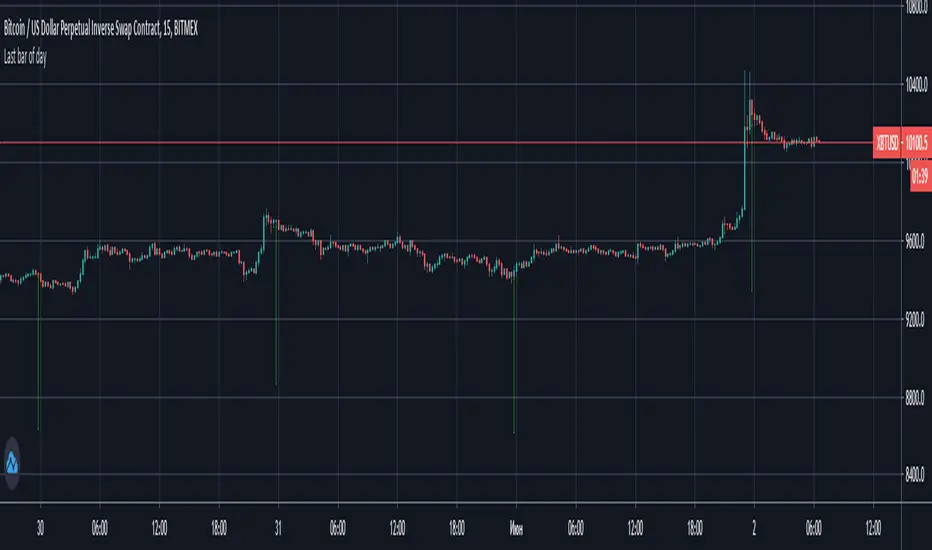
How to detect last bar of day Simple way how to detect last bar of day and close all positions
UPD: day end can be different for yours because stocks market use another timezone
Internal Bar Strength IndicatorThe Internal Bar Strength Indicator is pretty basic but very intuitive. Most stocks that close near their high of the day tend to fall the next day and stocks that close near their low tend to rise the next day. This indicator has very similar buy and sell signals as the RSI. Buy when the indicator rises above its signal or if the indicator is in the red zone and rises up outside of the red zone. Sell when the indicator falls below its signal or if the indicator is in the green zone and falls down outside of the green zone.
Let me know if you would like to see other indicators from me!

GRAB or TrendStrength Bars with Highlights[Salty]GRAB or TrendStrength Bars with Propulsion Dots and Highlights for Squeeze Pro, CCI-Arrows, and SlowStoch
This indicator shows GRAB or TrendStrength candles and allows several moving averages to be displayed at the same time.
It has arrows and diamonds above or below the candles to show CCI values above 100 or below -100 with the arrow pointing in the direction of the momentum.
Diamonds indicate slightly weaker momentum than arrows, but still consider strong.
It has background coloring that is light green to show bullish trends and light red to show bearish trends that are derived from slow stochastics.
In general Darker colors are used for down moves and lighter colors are use to show up moves. Also, red indicates bearish, and green indicates bullish throughout.
It has yellow background to show squeezes with additional Squeeze Pro information shown at the bottom of the chart in the form of letters and momentum arrows.
L = Low compression squeeze, S = Normal Squeeze, and H = High Compression Squeeze.
It has a set of propulsion dots for each Moving Average. The trend is consider bullish when green colored dots print, and bearish when red dots print.
3 ATR Keltner channels are printed. The first two show the values used by the squeeze by default
2 Bolinger Bands are displayed based on the values used by the Squeeze by default.
1 VWAP line may be displayed.
TIP: overlaying the TICK symbol is great for confirming a bias where positive values are bullish and negative values are bearish.

Highlight Last Bar of: D | W | M | Hour| H4 | MinutesSimple script highlighting a vertical line on the last bar of the Day/ Week/ Month/ Hour/ H4/ minute etc.
Helps maintain visibility of higher timeframes when on lower timeframes.
Quickly identify end of period levels.
Engulfing/Inside BarsVery basic script to help discretionary traders with their candlestick pattern analysis
This script shows a colored arrow on top or below the candlestick indicating a bearish/bullish inside bar formation
also shows text with "bull" or "bear" on top of the candle when a bullish or bearish engulfing pattern surges.
big thanks to the pinescript reference manual & everyone that has open source codes bc i got stuck 50 bajillion times
Cheers.
Total Bars [xdecow]This simple indicator shows the total number of bars on the graph.
It serves to see which broker has a longer history or if the chart has enough candles to perform backtests.

Pin Bar CandlesPin Bar Candles can be used for identifying reversal points with the help of support and resistance

Three Bar Exit Trailing Stop - Naked Forex: Price ActionThree Bar Exit Trailing Stop - Naked Forex: Exit indicator based on price action. The naked trader locks in profit by trailing the stop loss behind the lowest low of the last three candlesticks (for buy trades) or above the highest high of the last three candlesticks (For sell trades)

How to Overlay First LTF Bar of DayExample how to overlay the first lower timeframe bar of the day across the entire day. Set chart to a timeframe that is lower than 1 Day period. Also included option for coloring wick pressure of that bar.
NOTICE: This is an example script and not meant to be used as an actual strategy. By using this script or any portion thereof, you acknowledge that you have read and understood that this is for research purposes only and I am not responsible for any financial losses you may incur by using this script!
N Bars Down Backtest Evaluates for n number of consecutive lower closes. Returns a value
of 1 when the condition is true or 0 when false.
WARNING:
- For purpose educate only
- This script to change bars colors.
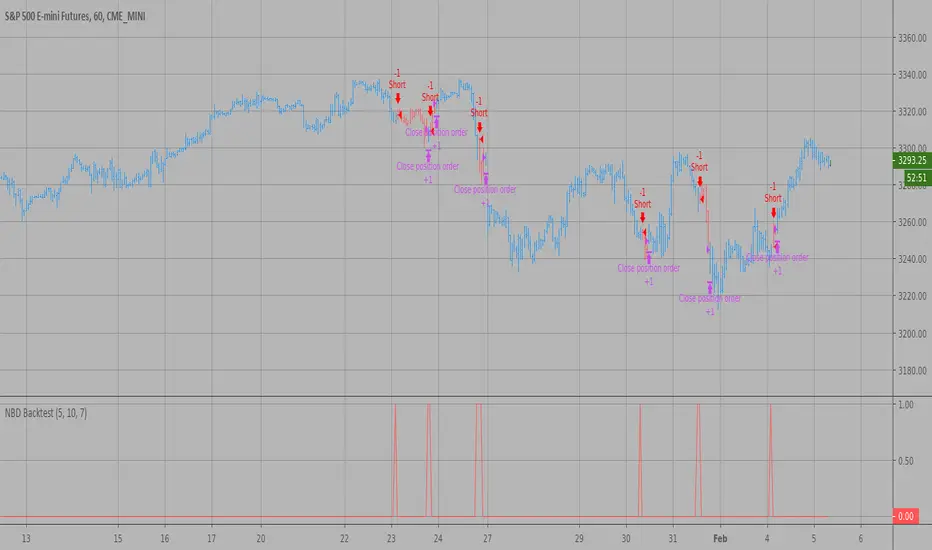
N Bars Up Backtest Evaluates for n number of consecutive higher closes. Returns a value
of 1 when the condition is true or 0 when false.
WARNING:
- For purpose educate only
- This script to change bars colors.

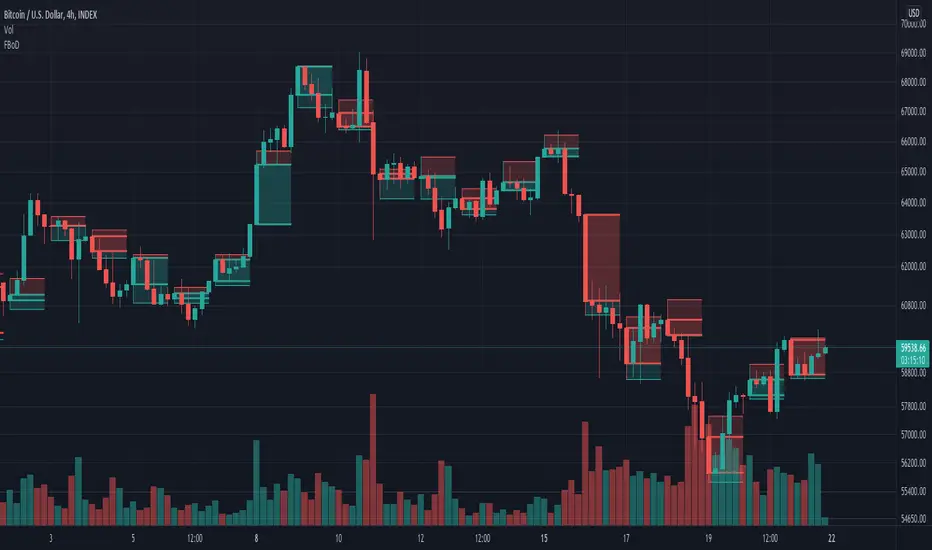
Dumb Indicator 21 - Function's Candlestick Bar's StyleThe idea is help traders to see the patterns and levels from a different point o view.
This script create candlestick using the opening, high, low and close price as source on your favorite function.
It's very simple to use:
Select a function in the drop box list, the number of bars length, check or uncheck the boxes to treat source as logarithm, smooth, and if you want to plot the SMA from the results.
To make a deeper analysis, you can select to plot the candles in Stochastic or in Percent Rank way.
The Stochastic and Percent Rank plot will show how far the price is close to highest or lowest value of the source from the last "Stochastic Length" number of bars.
Some functions with different names can plot the same results.
This indicator works on every kind of market, but you will need to find the best function and length to use.
Please, if you find anything good with this, share to everyone.
Williams Fractals - 3 or 5 Bar Wanted to give a user the option to choose between the original 5 bars in the Williams Fractal or 3 bars.

Leledc Exhaustion Bar V4 PLUSLeledc Exhaustion Bar indicator created by glaz converted to Pine 4, plotshape was added.


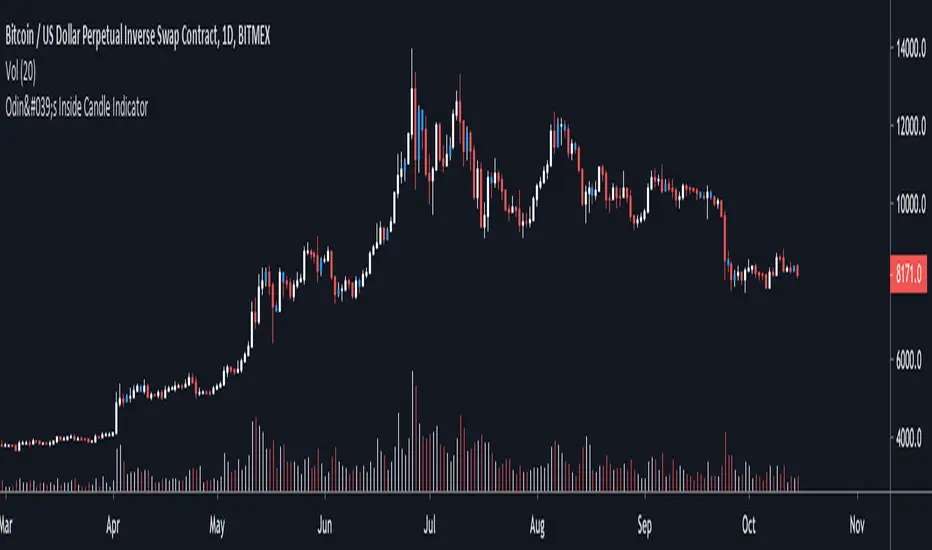
Odin's Inside Bar IndicatorA simple indicator that identifies "inside bars" by painting them blue.
An inside candle is a candle that has a lower high and higher low than the previous candle.
I like to use it on the daily chart to find areas of price compression that lead to a breakout.
The price then often trends in the direction of the breakout.
Especially powerful when combined with other market structure analysis.
Cheers.
Multiple SMAs + X-Bar High/LowWhen starting my daily analysis, I typically open a daily chart and check where the price is compared to several SMAs, as well as check the high/low of today and the 10-day high/low. This indicator was designed to save chart space as well as make finding the highs and lows more efficient. Everything is adjustable, so you don't have to stick with my 10-bar rule.

vline() Function for Pine Script v4.0+It's been a long time coming, but here is a versatile vline() function applicable to PSv4.0+ utilizing line.new(). I decided to finally figure this out at the request of another member recently. I have been waiting myself for months, but it's now time for an idea who's time has come to unleash upon planet Pine Script. It's a handy little function I believe will be very useful in the future. It only requires 4 parameters of BarIndex, Color, LineStyle, and LineWidth. Make sure you place it in an appropriate if() block to use it properly. As displayed above, this plots every 10 bars using a conditional statement employing the rarely used modulus operator.
Use it as you please, this is free code to implement into your new Pine projects. I don't require an credit for any one to use this function. I simply don't want any credit. I would however like to see some great ideas utilizing this when I randomly and accidentally come across them in the public library. I didn't know where to put this script, so I just tossed into the "Trend Analysis" category. I'm pondering we members need a "Miscellaneous" category some time in the future.
The comments section below is solely just for commenting and other remarks, ideas, compliments, etc... regarding only this indicator, not others. If you do have any questions or comments regarding this indicator, I will consider your inquiries, thoughts, and concepts presented below in the comments section, when time provides it. When my indicators achieve more prevalent use by TV members, I will implement more ideas when they present themselves as worthy additions. As always, "Like" it if you simply just like it with a proper thumbs up, and also return to my scripts list occasionally for additional postings. Have a profitable future everyone!

Current Price Bar LabelA simple Indicator to display the current price of the asset above the current bar. It shows a green label if the close is equal or greater than the open, red otherwise.
