Inside/Outside Bar Direction Highlighter
Here’s a trading indicator in Pine Script (v6) that combines the essence of the Inside Bar, Outside Bar, and directional patterns inspired by TT3 Theory. This indicator highlights bars based on their classification as inside, outside, or directional and provides potential trade signals.
Inside Outside Indicator
Explanation:
Bar Classification:
Inside Bar: Current high is less than the previous high, and the low is greater than the previous low.
Outside Bar: Current high exceeds the previous high, and the low breaks below the previous low.
Up/Down Bars: Closing prices relative to the previous high/low.
Visual Highlights:
Bars are visually highlighted with colors for easy identification.
Trade Signals:
Long Signal: When the close crosses above the previous high and it's a directional up bar.
Short Signal: When the close crosses below the previous low and it's a directional down bar.
Customizable Inputs:
Colors for inside, outside, up, and down bars can be modified.
You can copy and paste this script into the Pine Editor on TradingView to see it in action. Adjust the logic to fit your trading strategy as needed.
You said:
summary of how to use this indicator without buy/sell signal
ChatGPT said:
ChatGPT
How to Use the Inside/Outside Bar Direction Highlighter Indicator (Without Buy/Sell Signals)
Understand the Bar Classifications:
Inside Bars: Highlighted in blue (default). These indicate periods of market consolidation. Look for potential breakouts in either direction.
Outside Bars: Highlighted in orange (default). These represent increased volatility, where both higher highs and lower lows are made. Watch for reversals or continuations based on broader trends.
Directional Up Bars: Highlighted in green (default). These occur when the current close is above the previous high, signaling bullish momentum.
Directional Down Bars: Highlighted in red (default). These occur when the current close is below the previous low, indicating bearish momentum.
Identify Key Patterns:
Use the highlighted bars to spot price action setups, such as:
Breakouts from inside bars.
Reversal signals following outside bars.
Continuation patterns when directional bars align with the trend.
Combine with Your Analysis:
Trend Analysis: Match bar classifications with trend direction on larger timeframes (e.g., daily, 4-hour).
Support/Resistance: Use inside and outside bars near key levels for confirmation or reversal signals.
Volume: Higher volume on directional bars strengthens the momentum signal.
Customize the Colors:
Adjust the bar highlight colors to fit your chart theme for better visibility.
No Automatic Signals:
This indicator doesn’t provide explicit buy/sell recommendations. Instead, use the visual highlights to make informed decisions based on your trading strategy.
By interpreting these bar patterns, you can better gauge market behavior and make more confident decisions without relying on preset signals.
חפש סקריפטים עבור "bar"

5-Minute YEN Pivot Bars 1.0The 5-Minute YEN Pivot Bars indicator is designed to identify and highlight low-range pivot bars on 5-minute charts, specifically tailored for Yen-based pairs (e.g., GBPJPY, USDJPY). By focusing on precise pip thresholds, this tool helps traders detect potential pivot points within specific trading sessions, while avoiding inside bars and other noise often seen in low-volatility conditions. This can be particularly useful for trend traders and those looking to refine their entry points based on intraday reversals.
Key Features:
- Customized Pip Thresholds for Yen Pairs:
The indicator is pre-configured for Yen pairs, where 1 pip is typically represented by 0.01. It applies these thresholds:
- Limited Range: 4 pips or less between open and close prices.
- High/Low Directionality: At least 3 pips from the close/open to the bar's high or low.
- Open/Close Proximity: 4 pips or less between open and close.
- Inside Bar Tolerance: A tolerance of 3 pips for inside bars, helping reduce false signals from bars contained within the previous bar's range.
- Session-Specific Alerts:
- The indicator allows you to enable alerts for the European Session (6:00-12:00), American Session (12:00-17:00), and London Close (17:00-20:00). You can adjust these times based on your own trading hours or timezone preferences via a time-shift setting.
- Receive real-time alerts when a valid bullish or bearish pivot bar is identified within the chosen sessions, allowing you to respond to potential trade opportunities immediately.
- Time Shift Customization:
- Adjust the "Time Shift" parameter to account for different time zones, ensuring accurate session alignment regardless of your local time.
How It Works:
1. Pivot Bar Identification:
The indicator scans for bars where the difference between the open and close is within the "Limited Range" threshold, and both open and close prices are close to either the high or the low of the bar.
2. Directional Filtering:
It requires the bar to show strong directional bias by enforcing an additional distance between the open/close levels and the opposite end of the bar (high/low). Only bars with this directional structure are considered for highlighting.
3. Exclusion of Inside Bars:
Bars that are completely contained within the range of the previous bar are excluded (inside bars), as are consecutive inside bars. This filtering is essential to avoid marking bars that typically indicate consolidation rather than potential pivot points.
4. Session Alerts:
When a valid pivot bar appears within the selected sessions, an alert is triggered, notifying the trader of a potential trading signal. Bullish and bearish signals are differentiated based on whether the close is near the high or low.
How to Use:
- Trend Reversals: Use this indicator to spot potential trend reversals or pullbacks on a 5-minute chart, especially within key trading sessions.
- Entry and Exit Points: Highlighted bars can serve as potential entry points for traders looking to capitalize on short-term directional changes or continuation patterns.
- Combine with Other Indicators: Consider pairing this tool with momentum indicators or trendlines to confirm the signals, providing a comprehensive analysis framework.
Default Parameters:
- Limited Range: 4 Pips
- High/Low Directionality: 3 Pips
- Open/Close Proximity: 4 Pips
- Inside Bar Tolerance: 3 Pips
- Session Alerts: Enabled for European, American, and London Close sessions
- Time Shift: Default 6 (adjustable to align with different time zones)
This indicator is specifically optimized for Yen pairs on 5-minute charts due to its pip calculation.

Candlesticks Patterns [TradingFinder] Pin Bar Hammer Shooting🔵 Introduction
Truly, the title "TradingView" doesn't do justice to this excellent website, and that's why I've written about its crucial aspect. In this indicator, the identification of all candlesticks known as "Pin bars" is explored.
These candlesticks include the following:
- Hammer : A Pin bar formed at the end of a bearish trend, with its body being either bearish or bullish.
- Shooting Star : Formed at the end of a bullish trend, with its body being either bearish or bullish.
- Hanging Man : Formed during an upward trend, characterized by a candle with a lower shadow.
- Inverted Hammer : Formed during a downward trend, characterized by a candle with an upper shadow.
🟣 Important : For ease of use, we refer to these four candlestick patterns as Pin Bars and categorize them into the main friends "Bullish" and "Bearish."
🟣 Important : In all sources, Hanging Man and Inverted Hammer are referred to as "Reversal candles." However, in reality, whenever they appear after breaking a significant area (Break Out), we expect these candles to signal a continuation of the trend and confirmation in the direction of the trend.
🟣 Important : One of the best signs of market manipulation and entry by market giants is the "Ice Berg." So, it provides one of the best trading opportunities.
🔵 Reason for Creation
Many traders, especially volume traders, use Pin bars as confirmation and enter the market after their occurrence. In this indicator, all four patterns are identified and displayed in a colored candle format, using "triangle" and "circle."
When they are evident on the chart, directly or by drawing a horizontal line, they give us good alerts for reversal or continuation areas.
🔵 Information Table
1. Red circle: Pin bars formed in a downtrend.
2. Blue circle: Bullish Pin bars formed in an uptrend.
3. Black triangle: Bearish Pin bar candle in an uptrend.
4. Blue triangle: Bullish Pin bar candle in a downtrend.
🔵 Settings
Trend Detection Period: A special feature that considers smaller or larger fluctuations. If individual price waves need to be considered, use lower numbers; if the overall trend direction is desired, use larger numbers (e.g., 5-7 or higher). This precisely sets the Zigzag or Pivot format, not displayed but considered in the indicator calculation.
Trend Effect : By changing the Trend Effect status to "Off," all Pin bars, whether bullish or bearish, are displayed regardless of the current market trend. If the status remains "On," only Pin bars in the direction of the main market trend are shown.
🟣 Important : Black triangles "Number 3" and blue triangles "Number 4" displayed in the information table section, as explained in the "Information Table" section.
Show Bullish Pin Bar : When set to "Yes," displays bullish Pin bars; when set to "No," does not display them.
Show Bearish Pin Bar : When set to "Yes," allows the display of bearish Pin bars; when set to "No," does not display them.
Bullish Pin Bar Setting : Using the "Ratio Lower Shadow to Body" and "Ratio Lower Shadow to Higher Shadow" settings, you can customize your bullish Pin bar candles. Larger numbers impose stricter conditions for identifying bullish Pin bars.
Bearish Pin Bar Setting : Using the "Ratio Higher Shadow to Body" and "Ratio Higher Shadow to Lower Shadow" settings, you can customize your bearish Pin bar candles. Larger numbers impose stricter conditions for identifying bearish Pin bars.
Show Info Table : Allows the display or non-display of the information table (located at the bottom of the page and on the right side).
🔵 How to Use
At the end of a downtrend, look for "Hammer" candles, easily identified one by one.
To identify the "Shooting Star" candle pattern at the end of an uptrend; expect a price reversal in the downtrend.
For trades in the downward direction, wait for the formation of an "Inverted Hammer" Pin bar.
And finally, in an uptrend, where a "Hanging Man" candle can form.
🔵 Features
For better visualization, triangles and circles are used above the candles, but they can be easily removed. All Pin bars are displayed in color with the following meanings:
- Black-bodied candle: Inverted Hammer
- Turquoise blue candle: Hammer
- Pink candle: Hanging Man
- Red candle: Shooting Star
🟣 Important : The capability to detect the powerful two-candle pattern "Tweezer Top" at the end of an uptrend emerges by forming two "Shooting Star" candles side by side.
Similarly, the two-candle pattern "Tweezer Bottom" is created at the end of a downtrend with the formation of two "Hammer" candles side by side. To identify the "Tweezer" pattern, make sure the settings in the "Trend Effect" section are set to "Off."
🟣 Auxiliary Indicators
During the start of trading sessions such as Asia, London, and New York, where the highest liquidity exists, alongside this indicator, you can use the Trading Sessions indicator.
Sessions
The combination of Order Blocks "-OB" and "+OB" with candles is one of the best trading methods. The indicator that identifies order blocks, along with this indicator, can yield remarkable results in the success of Pin bar candles.
Order Blocks Finder
The trading toolset "TFlab" presents this indicator. To benefit from all indicators, we invite you to visit our page " TFlab Scripts ".

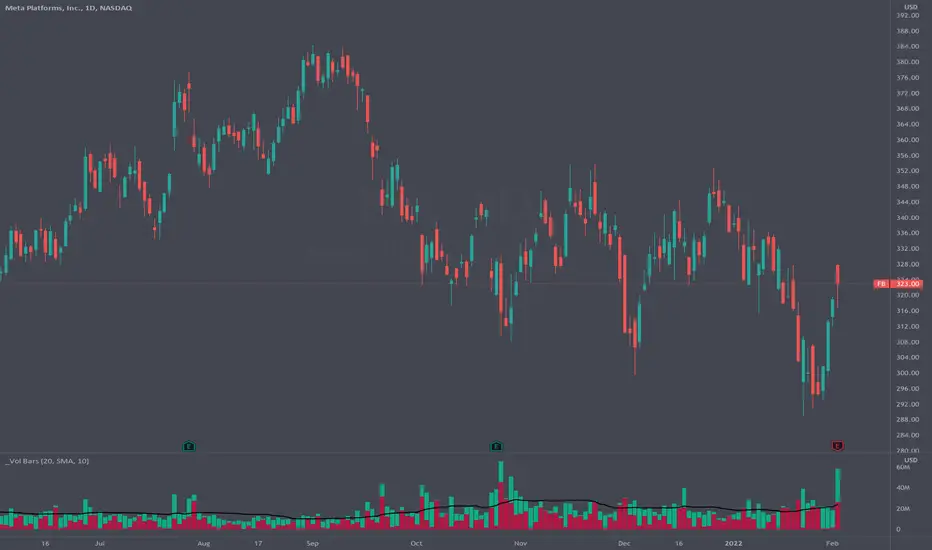
Volume Pressure BarsDescription
This indicator transforms the normal volume bars into buying and selling segments. This allows the user to easily see how much buying and selling pressure is occurring on any given timeframe. The buying and selling pressure values are calculated using the following equations:
buyingPressure = volume * (close - low) / (high - low)
sellingPressure = volume * (high - close) / (high - low)
Moving Average Line
Also included in this indicator is the optional moving average line. This allows the user to easily see if volume is above or below the average line. All aspects of the moving average line can be adjusted. The line can be toggled on & off, the length of the moving average can be adjusted, the mathematical smoothing function can be chosen, and the color & style of the line can be configured.
Scaling
If the volume pressure bars are displayed on the same “pane” as the price candles, then the volume bars can be scaled up or down. In the Input settings check the “Scale Bars” checkbox. Then increase the “Scaling Factor” number to make all of the volume bars smaller (to allow more room on your chart) or decrease the number to make the volume bars bigger.
IMPORTANT NOTE #1: scaling only works when the volume pressure bars are in the same pane as the price candles. If the volume pressures bars are in their own pane, then the “Scale Bars” toggle has no effect.
IMPORTANT NOTE #2: if the volume pressure bars are in the same pane as the price candles then there will be a sizable gap between the bottom of the volume bars and the time axis on the TradingView chart. This IS NOT a bug in this indicators code. The gap IS a bug in the TradingView platform that affects all volume indicators besides the default volume indicator that comes with each blank chart. To remove the gap then move the “_Vol Bars” indicator to its own pane above or below the main pain.
Volume Numbers
In Pine Script there is not a true stacked bar chart plot. What the author has to use are multiple bar charts that are in front and behind each other. This gives the impression that the bars are truly stacked because the selling pressure is always smaller than the total volume on any given bar. There is no issue to visually look at the bars and see their heights but if the user used their cursor to hover on a bar to get the actual volume pressure values it leads to issues. To address this problem the author has created a third invisible bar called “Buy Vol Label” that is the buy pressure volume value. Thus when the user hovers the cursor over a bar the first value (from left to right) is the total volume for the bar, the second value is the sell pressure, the third value is the buy pressure, and the fourth value (if toggled on) is the moving average value.
quantized pin bar indicator with ATRAbstract
This script computes the strength of pin bars.
This script uses the corrent and the previous two bars to compute the strength of pin bars.
The strength of pin bars can be also comared with average true range, so we can evaluate those pin bars are strong or weak.
Introduction
Pin bar is a popular price action trading strategy.
It is based on quick price rejection.
Most of existing pin bar scripts only determine if a bar is a pin bar or not.
However, evaluating the strength of pin bars is important.
If price rejection is too weak, it is difficult to trigger trend reversal.
If a pin bar is too strong, we may enter the trade too late and cannot have good profit.
In this script, it provides a method to compute to strength of pin bars.
After the strength of pin bars are quantized, they can compare with average true range, price range and trend strength, which can help us to determine where are worthy for us to open trades.
Computation
Bullish hammer : current low is lower than ( previous high or current open ) and current close.
Bearish gravestone : current high is higher than ( previous low or current open ) and current close.
Bullish engulfing and harami : ( current low or previous low ) is lower than ( previous 2nd high or previous open ) and current close.
Bearish engulfing and harami : ( current high or previous high ) is higher than ( previous 2nd low or previous open ) and current close.
Parameters
Smoothing : the type of computing average.
Length of ATR : determines the number of true ranges for computing average true range.
ATR multiplier line : the threshould that a pin bar is strong enough. For example, if this value is 0.5, it means a pin bar with 0.5*atr or more is considered a strong pin bar.
one direction pinbar : set to 1 if you want the strength of bullish pin bars and bearish pin bars are cancelled. Set to 0 if you want to keep both strength of bullish pin bars and bearish pin bars; in this case, you may need to change the plot style to make both strength visible.
Trading Suggestions
Evaluate the strength of trend against pin bars. After all, a single reverse pin bar may be too weak to reverse the trend.
Timeframe : if atr is higher than 4*spread, the timeframe is high enough. However, if strong pin bars appear too frequent or price range is too small, going to higher fimeframe may be more safe.
Entry and exit : according to personal flavors.
Conclusion
The strength of pin bars can be quantized.
With this indicator, we can find more potential pin bars which human eyes and binary pattern detectors were leaked.
In my opinion, 0.5*atr is the most suitable streng of a pin bar for my trade entry but I still need to consider the direction of the trend.
You are welcome to share your settings and related trading strategy.
References
Most of related knowledge can be searched from the internet.
I cannot say the exact references because they may violate the rules of Tradingview.

Volume Weighted Intra Bar LR KurtosisThis indicator analyzes market character by decomposing total
Excess Kurtosis ("Fat Tails") of a SINGLE BAR into four distinct,
interpretable components based on a Linear Regression model.
Key Features:
1. **Intra-Bar LR Kurtosis Decomposition:** For each bar on the chart,
the indicator analyzes the underlying price action on a smaller
timeframe ('Intra-Bar Timeframe'). It fits a Linear Regression
line through the intra-bar data to decompose the 4th Moment:
- **Trend Kurtosis (Gold):** Peakedness of the regression line
itself. High values indicate the price path within the bar
moves in sudden jumps, steps, or gaps (discontinuous path).
- **Residual Kurtosis (Red):** Excess Kurtosis of the noise
around the regression line. Captures "Hidden Tail Risk" or
extreme outliers within the bar relative to the trend.
- **Within-Bar Kurtosis (Blue):** Fat tails derived from the
microstructure of individual intra-bar candles.
- **Interaction Variance (Dark Grey):** The comovement of variance
and mean deviations (volatility clustering relative to trend).
- **Interaction Skewness (Darker Grey):** The comovement of skewness
and mean deviations (asymmetry relative to trend).
2. **Visual Decomposition Logic:** Total Excess Kurtosis is the
primary metric displayed. Since statistical moments are additive,
this indicator calculates the *exact* Total Kurtosis and partitions
the columns based on the Law of Total Moments.
3. **Dual Display Modes:** The indicator offers two modes to
visualize this decomposition:
- **Absolute Mode:** Plots the *total* kurtosis as a
stacked column chart. Stacking logic groups components to
ensure visual clarity of the magnitude.
- **Relative Mode:** Plots the direct *contribution ratio*
(proportion) of each component relative to the total sum,
ideal for identifying the dominant driver (Trend vs. Noise).
4. **Calculation Options:**
- **Normalization:** An optional 'Normalize' setting
transforms inputs into logarithmic space, analyzing the
kurtosis of *returns* rather than absolute prices.
- **Volume Weighting:** An option (`Volume weighted`) applies
volume weighting to all regression and moment calculations,
emphasizing high-participation moves.
5. **Kurtosis Cycle Analysis:**
- **Pivot Detection:** Includes a built-in pivot detector
that identifies significant turning points (peaks/valleys) in
the *total* kurtosis line. (Note: This is only visible
in 'Absolute Mode').
- **Flexible Pivot Algorithms:** Supports various underlying
mathematical models for pivot detection provided by the
core library.
6. **Note on Confirmation (Lag):** Pivot signals are confirmed
using a lookback method. A pivot is only plotted *after*
the `Pivot Right Bars` input has passed, which introduces
an inherent lag.
7. **Multi-Timeframe (MTF) Capability:**
- **MTF Analysis Lines:** The entire intra-bar analysis can be
run on a higher timeframe (using the `Timeframe` input),
with standard options to handle gaps (`Fill Gaps`) and
prevent repainting (`Wait for...`).
- **Limitation:** The Pivot detection (`Calculate Pivots`) is
**disabled** if a Higher Timeframe (HTF) is selected.
8. **Integrated Alerts:** Includes comprehensive alerts for:
- Kurtosis magnitude (High Positive / High Negative).
- Character changes (Trend Jumps vs. Noise Outliers).
- Total Kurtosis pivot (High/Low) detection.
**Caution: Real-Time Data Behavior (Intra-Bar Repainting)**
This indicator uses high-resolution intra-bar data. As a result, the
values on the **current, unclosed bar** (the real-time bar) will
update dynamically as new intra-bar data arrives. This behavior is
normal and necessary for this type of analysis. Signals should only
be considered final **after the main chart bar has closed.**
---
**DISCLAIMER**
1. **For Informational/Educational Use Only:** This indicator is
provided for informational and educational purposes only. It does
not constitute financial, investment, or trading advice, nor is
it a recommendation to buy or sell any asset.
2. **Use at Your Own Risk:** All trading decisions you make based on
the information or signals generated by this indicator are made
solely at your own risk.
3. **No Guarantee of Performance:** Past performance is not an
indicator of future results. The author makes no guarantee
regarding the accuracy of the signals or future profitability.
4. **No Liability:** The author shall not be held liable for any
financial losses or damages incurred directly or indirectly from
the use of this indicator.
5. **Signals Are Not Recommendations:** The alerts and visual signals
(e.g., crossovers) generated by this tool are not direct
recommendations to buy or sell. They are technical observations
for your own analysis and consideration.

Volume Weighted Intra Bar KurtosisThis indicator analyzes market sentiment by providing a detailed
view of Excess Kurtosis ("Fat Tails"). It uses data from a lower,
intra-bar timeframe to separate the total kurtosis of a single bar
into distinct, interpretable components.
Key Features:
1. **Intra-Bar Kurtosis Decomposition:** For each bar on the chart,
the indicator analyzes the underlying price action on a smaller
timeframe ('Intra-Bar Timeframe'). Unlike Variance, the Fourth
Central Moment (Kurtosis) decomposes into three parts:
- **Between-Bar Kurtosis (Gold):** Peakedness of the price
path *between* the intra-bar candles. High values indicate
that the macro movement happened in jumps or gaps rather
than a smooth progression.
- **Within-Bar Kurtosis (Blue):** Fat tails derived from the
microstructure (extreme wicks) *inside* the intra-bar candles.
- **Interaction Variance (Dark Grey):** The comovement of variance
and mean deviations (volatility clustering relative to trend).
- **Interaction Skewness (Darker Grey):** The comovement of skewness
and mean deviations (asymmetry relative to trend).
2. **Visual Decomposition Logic:** Total Excess Kurtosis is the
primary metric displayed. Since Kurtosis coefficients are not
linearly additive, this indicator calculates the *exact* Total
Kurtosis and partitions the columns based on the additive
Fourth Moment Decomposition (`M4Tot = M4Btw + M4Wtn + M4Int`).
3. **Dual Display Modes:** The indicator offers two modes to
visualize this information:
- **Absolute Mode:** Plots the *total* kurtosis as a
stacked column chart, showing the *absolute magnitude* of
tail risk and the contribution of each component.
- **Relative Mode:** Plots the components as a 100% stacked
column chart (scaled from 0 to 1), focusing purely on the
*energy ratio* of the components.
4. **Calculation Options:**
- **Normalization:** An optional 'Normalize' setting
calculates an **Exponential Regression Curve** (log-space),
making the analysis suitable for comparing assets with
different scales (e.g., BTC vs EURUSD).
- **Volume Weighting:** An option (`Volume weighted`) applies
volume weighting to all mean and moment calculations.
5. **Kurtosis Cycle Analysis:**
- **Pivot Detection:** Includes a built-in pivot detector
that identifies significant turning points (peaks/valleys) in
the *total* kurtosis line. (Note: This is only visible
in 'Absolute Mode').
- **Flexible Pivot Algorithms:** Supports various underlying
mathematical models for pivot detection provided by the
core library.
6. **Note on Confirmation (Lag):** Pivot signals are confirmed
using a lookback method. A pivot is only plotted *after*
the `Pivot Right Bars` input has passed, which introduces
an inherent lag.
7. **Multi-Timeframe (MTF) Capability:**
- **MTF Analysis Lines:** The entire intra-bar analysis can be
run on a higher timeframe (using the `Timeframe` input),
with standard options to handle gaps (`Fill Gaps`) and
prevent repainting (`Wait for...`).
- **Limitation:** The Pivot detection (`Calculate Pivots`) is
**disabled** if a Higher Timeframe (HTF) is selected.
8. **Integrated Alerts:** Includes alerts for:
- Kurtosis magnitude (High Positive / High Negative).
- Kurtosis character changes/emerging/fading.
- Total Kurtosis pivot (High/Low) detection.
**Caution: Real-Time Data Behavior (Intra-Bar Repainting)**
This indicator uses high-resolution intra-bar data. As a result, the
values on the **current, unclosed bar** (the real-time bar) will
update dynamically as new intra-bar data arrives. This behavior is
normal and necessary for this type of analysis. Signals should only
be considered final **after the main chart bar has closed.**
---
**DISCLAIMER**
1. **For Informational/Educational Use Only:** This indicator is
provided for informational and educational purposes only. It does
not constitute financial, investment, or trading advice, nor is
it a recommendation to buy or sell any asset.
2. **Use at Your Own Risk:** All trading decisions you make based on
the information or signals generated by this indicator are made
solely at your own risk.
3. **No Guarantee of Performance:** Past performance is not an
indicator of future results. The author makes no guarantee
regarding the accuracy of the signals or future profitability.
4. **No Liability:** The author shall not be held liable for any
financial losses or damages incurred directly or indirectly from
the use of this indicator.
5. **Signals Are Not Recommendations:** The alerts and visual signals
(e.g., crossovers) generated by this tool are not direct
recommendations to buy or sell. They are technical observations
for your own analysis and consideration.

Volume Weighted Intra Bar LR SkewnessThis indicator analyzes market character by decomposing total
skewness (asymmetry) of a SINGLE BAR into four distinct,
interpretable components based on a Linear Regression model.
Key Features:
1. **Intra-Bar LR Skewness Decomposition:** For each bar on the chart,
the indicator analyzes the underlying price action on a smaller
timeframe ('Intra-Bar Timeframe'). It fits a Linear Regression
line through the intra-bar data to decompose the 3rd Moment:
- **Trend Skewness (Green/Red):** Asymmetry originating from
the slope of the intra-bar regression line. Indicates if the
price path within the bar is geometrically trend-driven.
- **Residual Skewness (Yellow):** Asymmetry of the noise
around the regression line. Captures "Tail Risk" or sudden
shocks within the bar that deviate from the main path.
- **Within-Bar Skewness (Blue):** Asymmetry derived from the
microstructure of individual intra-bar candles.
- **Interaction Skewness (Dark Grey):** Asymmetry caused by
the correlation between price levels and volatility within
the bar (e.g., volatility expanding as price drops).
2. **Visual Decomposition Logic:** Total Skewness is the
primary metric displayed. Since statistical moments are additive,
this indicator calculates the *exact* Total Skewness and partitions
the columns based on the Law of Total Moments.
3. **Dual Display Modes:** The indicator offers two modes to
visualize this decomposition:
- **Absolute Mode:** Plots the *total* skewness as a
stacked column chart. Stacking logic groups components with
the same sign to ensure visual clarity.
- **Relative Mode:** Plots the direct *contribution ratio*
(proportion) of each component relative to the total sum,
ideal for identifying the dominant driver (Trend vs. Noise).
4. **Calculation Options:**
- **Normalization:** An optional 'Normalize' setting
transforms inputs into logarithmic space, analyzing the
skewness of *returns* rather than absolute prices.
- **Volume Weighting:** An option (`Volume weighted`) applies
volume weighting to all regression and moment calculations,
emphasizing high-participation moves.
5. **Skewness Cycle Analysis:**
- **Pivot Detection:** Includes a built-in pivot detector
that identifies significant turning points (peaks/valleys) in
the *total* skewness line. (Note: This is only visible
in 'Absolute Mode').
- **Flexible Pivot Algorithms:** Supports various underlying
mathematical models for pivot detection provided by the
core library.
6. **Note on Confirmation (Lag):** Pivot signals are confirmed
using a lookback method. A pivot is only plotted *after*
the `Pivot Right Bars` input has passed, which introduces
an inherent lag.
7. **Multi-Timeframe (MTF) Capability:**
- **MTF Analysis Lines:** The entire intra-bar analysis can be
run on a higher timeframe (using the `Timeframe` input),
with standard options to handle gaps (`Fill Gaps`) and
prevent repainting (`Wait for...`).
- **Limitation:** The Pivot detection (`Calculate Pivots`) is
**disabled** if a Higher Timeframe (HTF) is selected.
8. **Integrated Alerts:** Includes comprehensive alerts for:
- Skewness magnitude (High Positive / High Negative).
- Character changes (Trend vs. Noise dominance).
- Total Skewness pivot (High/Low) detection.
**Caution: Real-Time Data Behavior (Intra-Bar Repainting)**
This indicator uses high-resolution intra-bar data. As a result, the
values on the **current, unclosed bar** (the real-time bar) will
update dynamically as new intra-bar data arrives. This behavior is
normal and necessary for this type of analysis. Signals should only
be considered final **after the main chart bar has closed.**
---
**DISCLAIMER**
1. **For Informational/Educational Use Only:** This indicator is
provided for informational and educational purposes only. It does
not constitute financial, investment, or trading advice, nor is
it a recommendation to buy or sell any asset.
2. **Use at Your Own Risk:** All trading decisions you make based on
the information or signals generated by this indicator are made
solely at your own risk.
3. **No Guarantee of Performance:** Past performance is not an
indicator of future results. The author makes no guarantee
regarding the accuracy of the signals or future profitability.
4. **No Liability:** The author shall not be held liable for any
financial losses or damages incurred directly or indirectly from
the use of this indicator.
5. **Signals Are Not Recommendations:** The alerts and visual signals
(e.g., crossovers) generated by this tool are not direct
recommendations to buy or sell. They are technical observations
for your own analysis and consideration.

Volume Weighted Intra Bar SkewnessThis indicator analyzes market sentiment by providing a detailed
view of skewness (asymmetry). It uses data from a lower, intra-bar
timeframe to separate the total skewness of a single bar into
distinct, interpretable components.
Key Features:
1. **Intra-Bar Skewness Decomposition:** For each bar on the chart,
the indicator analyzes the underlying price action on a smaller
timeframe ('Intra-Bar Timeframe'). Unlike Variance, the Third
Central Moment (Skewness) decomposes into three parts:
- **Between-Bar Skewness (Gold):** Asymmetry of the price
path *between* the intra-bar candles. Indicates if the macro
movements within the bar accelerated in one direction.
- **Within-Bar Skewness (Blue):** Asymmetry of the
microstructure (wicks vs. tails) *inside* the intra-bar candles.
- **Interaction Skewness (Grey):** The component arising from
the comovement of local means and local variances (e.g.,
does volatility increase when price drops?).
2. **Visual Decomposition Logic:** Total Skewness is the
primary metric displayed. Since Skewness coefficients are not
linearly additive, this indicator calculates the *exact* Total
Skewness and partitions the columns based on the additive
Third Moment Decomposition (`M3Tot = M3Btw + M3Wtn + M3Int`).
3. **Dual Display Modes:** The indicator offers two modes to
visualize this information:
- **Absolute Mode:** Plots the *total* skewness as a
stacked column chart, showing the *absolute magnitude* of
asymmetry and the contribution of each component.
- **Relative Mode:** Plots the components as a 100% stacked
column chart (scaled from 0 to 1), focusing purely on the
*energy ratio* of the components.
4. **Calculation Options:**
- **Normalization:** An optional 'Normalize' setting
calculates an **Exponential Regression Curve** (log-space),
making the analysis suitable for comparing assets with
different scales (e.g., BTC vs EURUSD).
- **Volume Weighting:** An option (`Volume weighted`) applies
volume weighting to all mean and moment calculations.
5. **Skewness Cycle Analysis:**
- **Pivot Detection:** Includes a built-in pivot detector
that identifies significant turning points (highs and lows) in
the *total* skewness line. (Note: This is only visible
in 'Absolute Mode').
- **Flexible Pivot Algorithms:** Supports various underlying
mathematical models for pivot detection provided by the
core library.
6. **Note on Confirmation (Lag):** Pivot signals are confirmed
using a lookback method. A pivot is only plotted *after*
the `Pivot Right Bars` input has passed, which introduces
an inherent lag.
7. **Multi-Timeframe (MTF) Capability:**
- **MTF Analysis Lines:** The entire intra-bar analysis can be
run on a higher timeframe (using the `Timeframe` input),
with standard options to handle gaps (`Fill Gaps`) and
prevent repainting (`Wait for...`).
- **Limitation:** The Pivot detection (`Calculate Pivots`) is
**disabled** if a Higher Timeframe (HTF) is selected.
8. **Integrated Alerts:** Includes alerts for:
- Skewness magnitude (High Positive / High Negative).
- Skewness character changes/emerging/fading.
- Total Skewness pivot (High/Low) detection.
**Caution: Real-Time Data Behavior (Intra-Bar Repainting)**
This indicator uses high-resolution intra-bar data. As a result, the
values on the **current, unclosed bar** (the real-time bar) will
update dynamically as new intra-bar data arrives. This behavior is
normal and necessary for this type of analysis. Signals should only
be considered final **after the main chart bar has closed.**
---
**DISCLAIMER**
1. **For Informational/Educational Use Only:** This indicator is
provided for informational and educational purposes only. It does
not constitute financial, investment, or trading advice, nor is
it a recommendation to buy or sell any asset.
2. **Use at Your Own Risk:** All trading decisions you make based on
the information or signals generated by this indicator are made
solely at your own risk.
3. **No Guarantee of Performance:** Past performance is not an
indicator of future results. The author makes no guarantee
regarding the accuracy of the signals or future profitability.
4. **No Liability:** The author shall not be held liable for any
financial losses or damages incurred directly or indirectly from
the use of this indicator.
5. **Signals Are Not Recommendations:** The alerts and visual signals
(e.g., crossovers) generated by this tool are not direct
recommendations to buy or sell. They are technical observations
for your own analysis and consideration.

Volume Weighted Intra Bar CorrelationThis indicator analyzes market character by providing a detailed
view of correlation. It uses data from a lower, intra-bar timeframe
to separate the total correlation of a single bar into two distinct
components.
Key Features:
1. **Intra-Bar Correlation Decomposition:** For each bar on the chart,
the indicator analyzes the underlying price action on a smaller
timeframe ('Intra-Bar Timeframe') and quantifies two types of correlation:
- **Between-Bar Correlation (Directional):** Calculated from price
movements *between* the intra-bar candles. This component
represents the **macro-movement** correlation within the main bar.
- **Within-Bar Correlation (Non-Directional):** Calculated from
price fluctuations *inside* each intra-bar candle. This
component represents the **microstructure/noise** correlation.
2. **Visual Decomposition Logic:** Total Correlation is the
primary metric displayed. Since Correlation Coefficients are not
linearly additive, this indicator plots the *exact* Total
Correlation and partitions the area underneath based on the
Covariance Ratio. This ensures the displayed total correlation
remains mathematically accurate while showing relative composition.
3. **Dual Display Modes:** The indicator offers two modes to
visualize this information:
- **Absolute Mode:** Plots the *total* correlation as a
stacked column chart, showing the *absolute magnitude* of
correlation and the contribution of each component.
- **Relative Mode:** Plots the components as a 100% stacked
column chart (scaled from 0 to 1), focusing purely on the
*energy ratio* of 'between-bar' (macro) and 'within-bar' (micro)
correlation.
4. **Calculation Options:**
- **Normalization:** An optional 'Normalize' setting
calculates an **Exponential Regression Curve** (log-space),
making the analysis suitable for comparing assets with
different scales (e.g., BTC vs EURUSD).
- **Volume Weighting:** An option (`Volume weighted`) applies
volume weighting to all mean and covariance calculations.
5. **Correlation Cycle Analysis:**
- **Pivot Detection:** Includes a built-in pivot detector
that identifies significant turning points (highs and lows) in
the *total* correlation line. (Note: This is only visible
in 'Absolute Mode').
- **Flexible Pivot Algorithms:** Supports various underlying
mathematical models for pivot detection provided by the
core library.
6. **Note on Confirmation (Lag):** Pivot signals are confirmed
using a lookback method. A pivot is only plotted *after*
the `Pivot Right Bars` input has passed, which introduces
an inherent lag.
7. **Multi-Timeframe (MTF) Capability:**
- **MTF Analysis Lines:** The entire intra-bar analysis can be
run on a higher timeframe (using the `Timeframe` input),
with standard options to handle gaps (`Fill Gaps`) and
prevent repainting (`Wait for...`).
- **Limitation:** The Pivot detection (`Calculate Pivots`) is
**disabled** if a Higher Timeframe (HTF) is selected.
8. **Integrated Alerts:** Includes alerts for:
- Correlation magnitude (High Positive / High Inverse).
- Correlation character changes/emerging/fading.
- Total Correlation pivot (High/Low) detection.
**Caution: Real-Time Data Behavior (Intra-Bar Repainting)**
This indicator uses high-resolution intra-bar data. As a result, the
values on the **current, unclosed bar** (the real-time bar) will
update dynamically as new intra-bar data arrives. This behavior is
normal and necessary for this type of analysis. Signals should only
be considered final **after the main chart bar has closed.**
---
**DISCLAIMER**
1. **For Informational/Educational Use Only:** This indicator is
provided for informational and educational purposes only. It does
not constitute financial, investment, or trading advice, nor is
it a recommendation to buy or sell any asset.
2. **Use at Your Own Risk:** All trading decisions you make based on
the information or signals generated by this indicator are made
solely at your own risk.
3. **No Guarantee of Performance:** Past performance is not an
indicator of future results. The author makes no guarantee
regarding the accuracy of the signals or future profitability.
4. **No Liability:** The author shall not be held liable for any
financial losses or damages incurred directly or indirectly from
the use of this indicator.
5. **Signals Are Not Recommendations:** The alerts and visual signals
(e.g., crossovers) generated by this tool are not direct
recommendations to buy or sell. They are technical observations
for your own analysis and consideration.

Inside/Outside Bars---
Inside/Outside Bars Detector
This indicator identifies and visualizes Inside Bars and Outside Bars (Engulfing Bars) on your chart, helping traders spot potential breakout and consolidation patterns.
What are Inside/Outside Bars?
• Outside Bars (Outer Bars): Candles that break BOTH the high AND low of the previous candle. These represent periods of increased volatility and potential trend continuation or reversal. Marked with red triangle arrows by default.
• Inside Bars (Inner Bars): Candles where NEITHER the high NOR low breaks the previous candle's range. These represent consolidation and often precede significant price moves. Marked with orange triangle arrows by default.
Features:
✓ Visual arrows above bars for easy identification
✓ Fixed pixel-size arrows that remain visible at any chart zoom level
✓ Statistics table showing counts of outer bars, inner bars, and total bars analyzed
✓ Fully customizable with multiple settings
Customization Options:
• Toggle outer bars and inner bars independently
• Customize arrow colors for each pattern
• Show/hide the statistics table
• Adjust calculation bars (1000 default, max 5000)
• Set to 0 to analyze all available bars up to 5000
How to Use:
Inside bars often indicate consolidation before a breakout, while outside bars suggest increased volatility and potential momentum shifts. Use these patterns in conjunction with your trading strategy to
identify entry/exit points or to confirm trend direction.
---

NY Session Bar Counter & Bar painterThe NY Session Bar Counter is a high-visibility technical utility that provides an automated, sequential count of every candle during the New York session (09:30 to 16:00 EST). Unlike standard session highlighters, this tool numbers each bar starting from the market open, allowing traders to identify specific "time-of-day" windows with surgical precision.
This script is specifically engineered for traders who follow setups based on specific bar numbers (e.g., the Bar 17 reversal, the Bar 36 lunch-power-hour, or the final EOD flush).
🚀 Key Features
Precision Timing: Automatically resets every day at 09:30 AM New York time, regardless of your local timezone settings.
Multi-Timeframe Logic: Optimized to work seamlessly on 1m, 5m, 15m, and 30m charts without breaking the daily count.
Historical & Replay Compatibility: Unlike many session tools, this script is fully compatible with Bar Replay and displays historical data across several days (up to 500 labels).
Special Bar Highlighting: Includes a "Paint Bar" feature that allows you to choose a specific bar number (e.g., Bar 17) and automatically color the candle body for instant visual recognition.
Customizable Display: Filter for Odd/Even numbers to reduce chart clutter and adjust font size, color, and position (Above/Below bar).
💡 Why It Is Useful
In the modern trading environment, the market moves in cycles of liquidity and volatility that are often tied to specific times. This script is useful because:
Standardization: It provides a common language for traders. Instead of saying "the 10:50 AM candle," traders can refer to "Bar 17" (on a 5m chart), which is faster and more consistent.
Backtesting Accuracy: When reviewing past days or using Bar Replay, you can easily identify if your strategy triggers at the same relative time every day.
Visual Discipline: By highlighting a "Target Bar," you can train your eyes to wait for specific time windows before looking for a setup, helping to prevent overtrading during low-probability hours.
Operational Efficiency: It removes the manual work of counting bars from the open, allowing you to focus entirely on price action and order flow.
How to Use
Install the script on any intraday timeframe (best on 5m or 15m).
Adjust Lookback: Use the settings to determine how many historical days you want to view.
Identify Patterns: Use the "Special Bar Highlight" to mark the bar where your strategy most frequently triggers.

Filter Bar1. Indicator Name
Filter Bar
2. One-line Introduction
A trend-aware bar coloring system that visualizes market direction and strength through adaptive transparency based on regression scoring.
3. General Overview
Filter Bar+ is a minimalist but powerful trend visualization tool that colors chart bars according to market direction and momentum strength.
It analyzes the linear regression trend alignment over a specified lookback period and uses a pairwise comparison algorithm to determine whether the market is in a bullish, bearish, or neutral state.
The result is a "trend score" that gets normalized to reflect trend intensity (0~1).
Bar colors are then dynamically updated using the specified bullish or bearish base colors, where higher intensity results in more opaque (darker) bars, and weaker trends lead to lighter, faded tones.
If no strong trend is detected, bars are shown in gray, signaling indecision or neutrality.
The strength of this indicator lies in its simplicity—it doesn’t draw lines, waves, or shapes, but overlays insight directly onto the chart through smart color cues.
It’s particularly effective as a background filter for price action traders, scalpers, and anyone who prefers clean charts but still wants embedded directional context.
4. Key Advantages
🎨 Adaptive Bar Coloring
Bar color opacity increases with trend strength, offering instant visual confirmation without clutter.
📊 Quantified Trend Direction
Uses a regression-based scoring system to reliably detect uptrends, downtrends, or sideways markets.
⚖️ Customizable Sensitivity
Parameters like lookback period and tolerance percentage give users full control over signal responsiveness.
🧼 Clean Chart Presentation
No lines, shapes, or overlays—just color-coded bars that blend into your existing chart setup.
🚀 Lightweight & Fast
Minimal computational load ensures it works smoothly even on lower-end devices or multiple chart setups.
🔒 Secure Internal Logic
Algorithm is neatly encapsulated and optimized, with no critical logic exposed.
📘 Indicator User Guide
📌 Basic Concept
Filter Bar+ evaluates trend direction and strength using a pairwise comparison of linear regression values.
The result determines whether the market is bullish, bearish, or neutral, and adjusts bar colors accordingly.
It visually amplifies the current market state without drawing any indicators on the chart.
⚙️ Settings Explained
Lookback Period: Number of bars used to compare regression values
Range Tolerance (%): Minimum score required to label a trend as bullish or bearish
Regression Source: Data input used for regression (default: close)
Linear Regression Length: Period for generating the base regression line
Bull/Bear Base Colors: Choose colors to represent bullish or bearish bars
📈 Buy Timing Example
Bars are green (or user-set bullish color) and becoming more vivid
Indicates a strengthening bullish trend; helpful when used alongside breakout confirmation or support zones
📉 Sell Timing Example
Bars turn red (or your custom bearish color) with increasing opacity
Signals growing bearish pressure; acts as confirmation during short setups or breakdowns
🧪 Recommended Use Cases
Combine with volume, RSI, or price action setups for direction filtering
Ideal for clean chart strategies where visual simplicity is preferred
Use as a confirmation layer to reduce noise in sideways markets
🔒 Precautions
This is a visual filter, not a signal generator—use alongside other strategies for entries/exits
In choppy markets, bars may flicker between colors—adjust sensitivity as needed
Works best when you already have a directional thesis and want to validate it visually
Always test settings for your asset/timeframe before applying in live trades

Volume Weighted Intra Bar LR Standard DeviationThis indicator analyzes market character by providing a detailed view of volatility. It applies a Linear Regression model to intra-bar price action, dissecting the total volatility of each bar into three distinct components.
Key Features:
Three-Component Volatility Decomposition: By analyzing a lower timeframe ('Intra-Bar Timeframe'), the indicator separates each bar's volatility into:
Trend Volatility (Green/Red): Volatility explained by the intra-bar linear regression slope (Momentum).
Residual Volatility (Yellow): Volatility from price oscillating around the intra-bar trendline (Mean-Reversion).
Within-Bar Volatility (Blue): Volatility derived from the range of each intra-bar candle (Noise/Choppiness).
Layered Column Visualization: The indicator plots these components as a layered column chart. The size of each colored layer visually represents the dominance of each volatility character.
Dual Display Modes: The indicator offers two modes to visualize this decomposition:
Absolute Mode: Displays the total standard deviation as the column height, showing the absolute magnitude of volatility and the contribution of each component.
Normalized Mode: Displays the components as a 100% stacked column chart (scaled from 0 to 1), focusing purely on the percentage ratio of Trend, Residual, and Noise.
Calculation Options:
Statistical Model: The 'Estimate Bar Statistics' option (enabled by default) uses a statistical model ('Estimator') to perform the decomposition. (Assumption: In this mode, the Source input is ignored, and an estimated mean for each bar is used instead).
Normalization: An optional 'Normalize Volatility' setting calculates an Exponential Regression Curve (log-space).
Volume Weighting: An option (Volume weighted) applies volume weighting to all intra-bar calculations.
Multi-Component Pivot Detection: Includes a pivot detector that identifies significant turning points (highs and lows) in both the Total Volatility and the Trend Volatility Ratio. (Note: These pivots are only plotted when 'Plot Mode' is set to 'Absolute').
Note on Confirmation (Lag): Pivot signals are confirmed using a lookback method. A pivot is only plotted after the Pivot Right Bars input has passed, which introduces an inherent lag.
Multi-Timeframe (MTF) Capability:
MTF Analysis: The entire intra-bar analysis can be run on a higher timeframe (using the Timeframe input), with standard options to handle gaps (Fill Gaps) and prevent repainting (Wait for...).
Limitation: The Pivot detection (Calculate Pivots) is disabled if a Higher Timeframe (HTF) is selected.
Integrated Alerts: Includes 9 comprehensive alerts for:
Volatility character changes (e.g., 'Character Change from Noise to Trend').
Dominant character emerging (e.g., 'Bullish Trend Character Emerging').
Total Volatility pivot (High/Low) detection.
Trend Volatility pivot (High/Low) detection.
Caution! Real-Time Data Behavior (Intra-Bar Repainting) This indicator uses high-resolution intra-bar data. As a result, the values on the current, unclosed bar (the real-time bar) will update dynamically as new intra-bar data arrives. This behavior is normal and necessary for this type of analysis. Signals should only be considered final after the main chart bar has closed.
DISCLAIMER
For Informational/Educational Use Only: This indicator is provided for informational and educational purposes only. It does not constitute financial, investment, or trading advice, nor is it a recommendation to buy or sell any asset.
Use at Your Own Risk: All trading decisions you make based on the information or signals generated by this indicator are made solely at your own risk.
No Guarantee of Performance: Past performance is not an indicator of future results. The author makes no guarantee regarding the accuracy of the signals or future profitability.
No Liability: The author shall not be held liable for any financial losses or damages incurred directly or indirectly from the use of this indicator.
Signals Are Not Recommendations: The alerts and visual signals (e.g., crossovers) generated by this tool are not direct recommendations to buy or sell. They are technical observations for your own analysis and consideration.

Range Bar Gaps DetectorRange Bar Gaps Detector
Overview
The Range Bar Gaps Detector identifies price gaps across multiple range bar sizes (12, 24, 60, and 120) on any trading instrument, helping traders spot potential support/resistance zones or breakout opportunities. Designed for Pine Script v6, this indicator detects gaps on range bars and exports data for use in companion scripts like Range Bar Gaps Overlap, making it ideal for multi-timeframe gap analysis.
Key Features
Multi-Range Gap Detection: Identifies gaps on 12, 24, 60, and 120-range bars, capturing both bullish (gap up) and bearish (gap down) price movements.
Customizable Sensitivity: Includes a user-defined minimum deviation (default: 10% of 14-period SMA) for 12-range gaps to filter out noise.
7-Day Lookback: Automatically prunes gaps older than 7 days to focus on recent, relevant price levels.
Data Export: Serializes up to 10 gaps per range (tops, bottoms, start bars, highest/lowest prices, and age) for seamless integration with overlap analysis scripts.
Debugging Support: Plots gap counts and aggregation data in the Data Window for easy verification of detected gaps.
How It Works
The indicator aggregates price movements to simulate higher range bars (24, 60, 120) from a base range bar chart. It detects gaps when the price jumps significantly between bars, ensuring gaps meet the minimum deviation threshold for 12-range bars. Gaps are stored in arrays, serialized for external use, and pruned after 7 days to maintain efficiency.
Usage
Add to your range bar chart (e.g., 12-range) to detect gaps across multiple ranges.
Use alongside the Range Bar Gaps Overlap indicator to visualize gaps and their overlaps as boxes on the chart.
Check the Data Window to confirm gap counts and sizes for each range (12, 24, 60, 120).
Adjust the "Minimal Deviation (%) for 12-Range" input to control gap detection sensitivity.
Settings
Minimal Deviation (%) for 12-Range: Set the minimum gap size for 12-range bars (default: 10% of 14-period SMA).
Range Sizes: Fixed at 24, 60, and 120 for higher range bar aggregation.
Notes
Ensure the script is published under your TradingView username (e.g., GreenArrow2005) for use with companion scripts.
Best used on range bar charts to maintain consistent gap detection.
For advanced overlap analysis, pair with the Range Bar Gaps Overlap indicator to highlight zones where gaps from different ranges align.
Ideal For
Traders seeking to identify key price levels for support/resistance or breakout strategies.
Multi-timeframe analysts combining gap data across various range bar sizes.
Developers building custom indicators that leverage gap data for advanced charting.

TPO[Fixed Range, Anchored, Bars Back]TPO Bars Back, Fixed Range and Anchored
Overview
The TPO Profile (Time Price Opportunity Profile) is a powerful market profile indicator that displays the amount of time price spent at different levels during a specified period. Unlike traditional volume profile indicators that show volume distribution, TPO Profile shows time distribution , providing insights into where price has spent the most time and identifying key support and resistance levels.
Key Advantages Over TradingView's Built-in TPO
Simplified Composite Creation : Automatically creates TPO profiles for any time range without manual split/merge operations
Instant Value Area Calculation : Immediately shows Value Area, POC, VAH, and VAL for your selected period
No Manual Assembly Required : TradingView's native TPO requires you to manually split sessions and merge them to create composites - this indicator does it automatically
Flexible Time Ranges : Create composites for any custom time period (multiple days, weeks, specific events) with a few clicks
Real-time Composite Updates : Anchor mode creates live composites that update as new data arrives
Multiple Composite Analysis : Easily compare different time periods without the tedious manual process
Key Features
Core Functionality
Time-Based Analysis : Shows time spent at each price level rather than volume
Configurable Time Blocks : Use any timeframe for TPO counting (30min, 1H, 4H, etc.)
Multiple Price Levels : Adjustable from 5 to 200 levels for granular analysis
Point of Control (POC) : Automatically identifies the price level with highest time activity
Value Area Calculation : Shows the price range containing 70% (configurable) of time activity
Automatic Composite Generation : Creates multi-session composites without manual intervention
Three Operating Modes
1. Bars Back Mode
Analyzes the last N bars from the current bar
Perfect for recent market activity analysis
Range: 10-500 bars
Use Case : Intraday analysis, recent session review
2. Fixed Range Mode
Analyzes a specific time period between start and end times
Ideal for historical analysis of specific events
Creates perfect composites for multi-day periods
Use Case : Earnings periods, news events, specific trading sessions, weekly/monthly composites
3. Anchor Mode (NEW)
Starts from a specific time and extends to the current bar
Dynamically updates as new bars form
Perfect for building live composites from any starting point
Use Case : Live session monitoring, event-based analysis from a specific point, growing composites
Visual Elements
TPO Bars
Horizontal bars showing time distribution at each price level
Longer bars = more time spent at that level
Color-coded to distinguish Value Area from outlying levels
Point of Control (POC)
Red line marking the price level with highest time activity
Most significant support/resistance level
Configurable line style (Solid/Dashed/Dotted) and width
Value Area High/Low (VAH/VAL)
Green and Orange lines marking the boundaries of the Value Area
Shows the price range containing the specified percentage of time activity
Optional display with customizable line styles
Single Print Detection
Identifies price levels touched by only one time block
Display options: Lines or Boxes
Purple color highlighting these significant levels
Often act as strong support/resistance in future trading
Customization Options
Time Block Configuration
Block Time : Choose timeframe for TPO counting (30min, 1H, 4H, etc.)
Allows analysis at different time granularities
Higher timeframes = broader perspective, Lower timeframes = finer detail
Visual Styling
Line Styles : Solid, Dashed, or Dotted for all line elements
Line Widths : 1-5 pixels for POC, VAH, and VAL lines
Colors : Fully customizable colors for all elements
Transparency : Adjustable transparency for better chart readability
Label Management
Show/Hide Labels : Toggle POC, VAH, VAL labels
Font Sizes : Tiny, Small, Normal, Large, Huge
Label Positioning : 8 different position options relative to lines
Offset Controls : Fine-tune label positioning
Line Extension
Level Offset Right : Controls how far lines extend
Smart extension logic:
Value ≤ 0: Infinite extension (extend.right)
Value ≥ 1: Extends exactly N bars ahead
Trading Applications
Support & Resistance
POC often acts as strong support/resistance
Value Area boundaries provide key levels
Single prints frequently become significant levels
Market Structure Analysis
Identify areas of price acceptance (thick TPO bars)
Spot areas of price rejection (thin TPO bars)
Understand where market participants are comfortable trading
Composite Profile Analysis
Create multi-day, weekly, or monthly composites instantly
Compare different composite periods without manual work
Analyze longer-term price acceptance levels
Build composites around specific events or announcements
Session Analysis
Monitor intraday session development in real-time
Compare different sessions (London, New York, Asia)
Track how profiles change throughout the trading day
Build live composites across multiple sessions
Event Analysis
Use Fixed Range mode for earnings, news events
Use Anchor mode to track price development from specific events
Compare pre/post event price acceptance levels
Create event-based composites automatically
Input Parameters
Mode Selection
Mode : Bars Back | Fixed Range | Anchor
Bars Back : Number of bars to analyze (10-500)
Start Time : Beginning time for Fixed Range and Anchor modes
End Time : Ending time for Fixed Range mode only
Analysis Configuration
Block Time : Timeframe for TPO blocks (e.g., "30" for 30-minute blocks)
TPO Levels : Number of price levels (5-200)
Value Area % : Percentage for Value Area calculation (50-95%)
Display Options
Show POC : Display Point of Control line
Show Value Area : Display Value Area box
Show VAH/VAL Lines : Display Value Area boundary lines
Show Single Prints : Display single print detection
Single Print Style : Lines or Boxes
Styling Controls
Colors : TPO, POC, Value Area, VAH, VAL, Single Print colors
Line Styles : POC, VAH, VAL line styles
Line Widths : POC, VAH, VAL line widths
Labels : Show/hide, font size, position, offset controls
Technical Details
Calculation Method
Divides the price range into equal levels based on TPO Levels setting
For each time block, determines which price levels it crosses
Adds +1 count to each crossed level
Identifies POC as the level with highest count
Calculates Value Area by expanding from POC until target percentage is reached
Performance Considerations
Historical data limited to prevent buffer overflow errors
Smart bounds checking for different timeframes
Optimized cleanup routines to prevent drawing object accumulation
Pine Script Version
Built on Pine Script v6
Uses modern Pine Script best practices
Efficient array handling and drawing object management
Best Practices
Timeframe Selection
Block Time = Chart Timeframe : Traditional TPO approach
Block Time > Chart Timeframe : Smoother, broader perspective
Block Time < Chart Timeframe : More granular, detailed analysis
Level Count Guidelines
Low levels (10-20) : Better for swing trading, major levels
High levels (50-100) : Better for scalping, precise entries
Very high levels (100+) : For very detailed analysis
Mode Selection
Bars Back : Daily analysis, recent activity
Fixed Range : Historical events, specific periods, manual composites
Anchor : Live monitoring, event-based analysis, growing composites
Composite Creation Workflow
Select Fixed Range or Anchor mode
Set your desired start time (and end time for Fixed Range)
Adjust TPO Levels for desired granularity
Enable VAH/VAL lines to see Value Area boundaries
The composite profile generates automatically with all key levels
This indicator eliminates the tedious manual process of creating composite TPO profiles in TradingView. Instead of splitting sessions and manually merging them, you get instant composite analysis with automatic Value Area calculation, POC identification, and single print detection. The combination of time-based analysis, multiple operating modes, and extensive customization options makes it a powerful tool for understanding market structure and price acceptance levels across any time period.

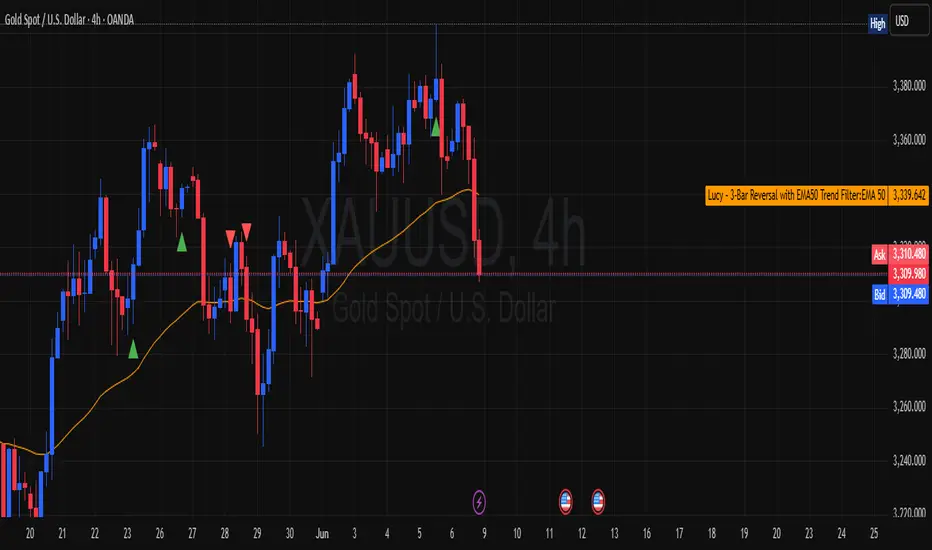
Lucy – 3-Bar Reversal with EMA50 Trend Filter📛 Lucy – 3-Bar Reversal with EMA50 Trend Filter
Purpose:
To detect and highlight bullish and bearish 3-bar reversal patterns on the chart, but only when they align with the dominant trend, defined by the EMA 50.
✅ How It Works
🟢 Bullish 3-Bar Reversal (Buy Setup):
Bar 1 is bearish (close < open)
Bar 2 makes a lower low than Bar 1
Bar 3 is bullish (close > open) and closes above Bar 2’s high
Price must be above EMA 50 (trend filter)
✅ Result: Shows a green triangle below the bar
🔴 Bearish 3-Bar Reversal (Sell Setup):
Bar 1 is bullish (close > open)
Bar 2 makes a higher high than Bar 1
Bar 3 is bearish (close < open) and closes below Bar 2’s low
Price must be below EMA 50
✅ Result: Shows a red triangle above the bar
📊 What It Plots:
🔼 Green triangle below bullish signal bar
🔽 Red triangle above bearish signal bar
🟠 Orange line = EMA50 (trend filter)
🔔 Built-in Alerts:
You’ll get an alert if:
A bullish reversal pattern forms above EMA50
A bearish reversal pattern forms below EMA50
🧠 Use Cases:
Great for trend-following traders who want clean, price-action entries
Works well on intraday (15m/1h) or swing (4h/daily) timeframes
Can be used for manual entries, or converted to strategy for automation
Hippo Battlefield - Bulls VS Bears 20 bars## Hippo Battlefield – Bulls VS Bears (20 Bars)
**What it is**
A multi-dimensional momentum-and-sentiment oscillator that combines classic Bull/Bear Power with ATR- or peak-normalization, then layers on RSI and MACD-derived metrics into:
1. **A colored bar series** showing net Bull+Bear Power strength over the last 20 bars,
2. **A dynamic table** of each of those 20 BBP values (grouped into four 5-bar “quartals”), with symbols, per-bar change, and rolling averages, and
3. **A composite “Weighted BBP” histogram** blending normalized RSI, MACD, and BBP into a single view.
---
### Key Inputs
- **Length (EMA)** – look-back for the underlying EMA (default 60)
- **Normalization Length** – look-back window for peak-normalization (default 60)
- **Use ATR for Norm.** – toggle ATR-based normalization vs. highest-abs(BBP)
- **Show Tables** – toggle the bottom-right 21×11 grid of raw and average BBP values
---
### What You See
#### 1. Colored Bars (Overlay = false)
- Bars are colored by normalized BBP intensity:
- Extreme Bull (≥+10): deep blue
- Strong Bull (+5 to +10): green/yellow
- Weak Bull (+0 to +5): dark green
- Weak Bear (–0 to –5): dark red
- Strong Bear (–5 to –10): pink/red
- Extreme Bear (<–10): magenta
#### 2. Bottom-Right Table (20 Bars of Data)
- Divided into four columns (0–4, 5–9, 10–14, 15–19 bars ago) and one “average” row.
- Each cell shows:
1. Bar index (1–20),
2. Normalized BBP value (to four decimals),
3. Direction symbol (↑/↓/=),
4. Bar-to-bar change (± value),
5. A separator “|”.
- At the very bottom, each column’s 5-bar average is displayed as “Avg: X.XXXX” with a dot marker.
#### 3. Top-Center Mini-Table
- When ≥20 bars have elapsed, shows the date at 20 bars ago and the average BBP across the full 20-bar window.
#### 4. Normalized RSI Line
- Rescales the classic 14-period RSI into a –20…+20 band to align with BBP.
#### 5. MACD Lines (Hidden) & Composite Histogram
- MACD and signal lines are calculated but not plotted by default.
- A “Weighted BBP” histogram combines:
- 20% normalized RSI,
- 20% average of (MACD + signal + normalized BBP),
- 60% normalized BBP
- Plotted as columns, color-coded by strength using the same palette as the main bars.
#### 6. Middle Reference Line
- A horizontal zero line to anchor over/under-zero readings.
---
### How to Use It
- **Trend confirmation**: Strong blue/green bars alongside a rising histogram suggest bull conviction; strong reds/magentas signal bear dominance.
- **Divergence spotting**: Watch for price making new highs/lows while BBP or the histogram fails to follow.
- **Quartal analysis**: The 5-bar group averages can reveal whether recent momentum is accelerating or waning.
- **Cross-indicator weighting**: Because RSI, MACD, and raw BBP all feed into the final histogram, you get a smoothed, blended view of momentum shifts.
---
**Tip:** Tweak the EMA and normalization length to suit your preferred timeframe (e.g. shorter for intraday scalps, longer for swing trades). Enable/disable the table if you prefer a cleaner pane.

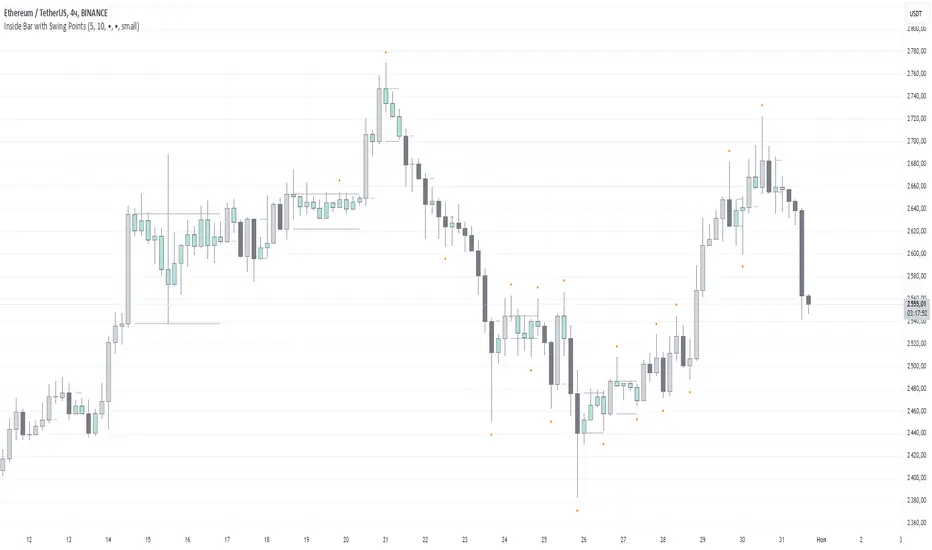
Inside Bar with Swing PointsSwing Points with Inside Bar
This script combines swing point analysis with an inside bar pattern visualization, merging essential concepts to identify and visualize key price levels and potential trend reversals. This is especially useful for traders looking to understand price action through swing levels and reactions within inside bar boundaries, making it effective for short-term trend analysis and reversal zone identification.
Script Features:
Swing Point Analysis:
The script identifies swing points based on fractals with a configurable number of bars, allowing for a choice between three and five bars, helping traders fine-tune sensitivity to price movements.
Swing points are visualized as labels, highlighting potential reversal or continuation zones in the price chart.
Inside Bar Visualization:
Inside bars are defined as bars where both the high and low are contained within the previous bar. These often signal consolidation before a potential breakout.
The script displays boundaries of the mother bar (the initial bar encompassing inside bars) and colors candles accordingly, highlighting those within these boundaries.
This feature helps traders focus on price areas where a breakout or trend shift may occur.
Utility and Application:
The script enables traders to visualize inside bars and swing points, which is particularly useful for short-term traders focused on reversal or trend continuation strategies.
Combining swing point analysis with inside bar identification offers a unique approach, helping traders locate key consolidation zones that may precede significant price moves.
This provides not only strong support and resistance levels but also insights into probable breakout points.
How to Use the Script:
Set the number of bars for swing point analysis (3 or 5) to adjust fractal sensitivity.
Enable mother bar boundary visualization and color indication for inside bars to easily spot consolidation patterns.
Pay attention to areas with multiple swing points and inside bars, as these often signal potential reversal or breakout zones.
This script offers flexible tools for analyzing price movements through both swing analysis and consolidation zone identification, aiding decision-making under uncertainty and enhancing market structure understanding.
Three-Bar Reversal SignalThis indicator is a simple setup of Three Bar Reversal. Logic of the code is as below.
Rules :
Long Setup
Bar 1 closes down
Low of Bar 2 is below the low of Bar 1 (and Bar 3)
Bar 3 closes above the high of both Bar 1 and Bar 2
Buy at the close of Bar 3
Short Setup
Bar 1 closes up
High of Bar 2 is above the high of Bar 1 (and Bar 3)
Bar 3 closes below the low of both Bar 1 and Bar 2
Sell at the close of Bar 3

3-Bar (Outside Bar) Scanner with Table Display# 3-Bar (Outside Bar) Scanner with Table Display
## Overview
The **3-Bar (Outside Bar) Scanner with Table Display** is a custom TradingView indicator designed for traders who utilize **The Strat** methodology. This indicator scans for **3-bar (Outside Bar)** patterns across multiple symbols and displays the results in a convenient table format directly on your chart.
## Purpose
- **Efficient Multi-Symbol Scanning**: Monitor up to four symbols simultaneously for 3-bar patterns without the need to switch between charts.
- **Real-Time Updates**: The table dynamically updates with new price data, providing immediate insights into potential trading opportunities.
- **Visual Clarity**: Displays whether a 3-bar is bullish ("3 Up") or bearish ("3 Down"), helping you quickly interpret market sentiment.
## How It Works
- **Data Retrieval**: The indicator uses `request.security()` to fetch high, low, open, and close prices for the specified symbols and timeframe.
- **3-Bar Detection**:
- **Outside Bar Criteria**: Checks if the current candle's high is higher than the previous candle's high and the current low is lower than the previous low.
- **Direction Determination**:
- **"3 Up"**: If the candle closes higher than it opens (bullish candle).
- **"3 Down"**: If the candle closes lower than it opens (bearish candle).
- **Table Display**:
- The table shows the **Symbol**, **Timeframe**, and **State** ("3 Up", "3 Down", or blank if no pattern detected).
- Customizable colors and positioning to fit your chart's aesthetics.
## Best Use Cases
- **Rapid Market Analysis**: Ideal for traders needing a quick overview of multiple assets for potential 3-bar setups.
- **Strategic Decision-Making**: Helps identify key reversal or continuation patterns in alignment with **The Strat** principles.
- **Scalable Monitoring**: By utilizing TradingView's multi-chart layouts, you can expand monitoring beyond four symbols.
## Instructions for Use
### Adding the Indicator to Your Chart
1. **Copy the Code**: Use the provided Pine Script code for the indicator.
2. **Create a New Indicator**:
- In TradingView, click on **Pine Editor** at the bottom of the platform.
- Paste the code into the editor.
3. **Save and Add to Chart**:
- Click **Save** and give your indicator a name.
- Click **Add to Chart** to apply it.
### Customizing the Inputs
- **Symbols**:
- **Symbol 1**: Leave blank to use the current chart's symbol or enter a specific symbol (e.g., `AAPL`).
- **Symbol 2 to Symbol 4**: Enter additional symbols or leave them blank.
- **Timeframe**: Select your desired timeframe (e.g., `D` for Daily, `60` for 60-minute).
- **Table Colors**:
- Customize header and data colors for better visibility against your chart background.
### Interpreting the Table
- **Symbol**: Displays the symbol without the exchange prefix for clarity.
- **Timeframe**: Shows the timeframe applied to the analysis.
- **State**:
- **"3 Up"**: A bullish outside bar where the candle closed higher than it opened.
- **"3 Down"**: A bearish outside bar where the candle closed lower than it opened.
- **Blank**: No 3-bar pattern detected on the latest candle.
### Monitoring More Than Four Symbols
- **Multi-Chart Layout**:
- Use TradingView's multi-chart feature to display multiple charts within a single workspace.
- Apply the indicator to each chart. For example:
- **Four-Chart Grid**: Monitor up to 16 symbols by setting up four charts, each with the indicator tracking four symbols.
- **Steps**:
1. Arrange your workspace into a multi-chart layout.
2. Add the indicator to each chart.
3. Input different symbols into the indicator on each chart.
## Example Usage
Suppose you want to monitor the following symbols on a Daily timeframe:
- **Symbol 1**: *(Leave blank to use the current chart's symbol, e.g., `SPY`)*
- **Symbol 2**: `AAPL`
- **Symbol 3**: `TSLA`
- **Symbol 4**: `AMZN`
After adding the indicator and entering these symbols:
- **SPY**: The table shows "3 Up" in the State column, indicating a bullish outside bar.
- **AAPL**: No 3-bar pattern detected; the State column is blank.
- **TSLA**: The table shows "3 Down," indicating a bearish outside bar.
- **AMZN**: The table shows "3 Up," indicating another bullish outside bar.
This setup allows you to quickly assess which symbols are exhibiting significant patterns that may warrant further analysis or action.
## Notes
- **Customization**: Feel free to adjust the table's position and colors to suit your preferences.
- **Limitations**:
- Be aware of TradingView's limitations on `request.security()` calls, which may vary based on your subscription plan.
- The indicator is designed to monitor up to four symbols per instance due to these limitations.
- **Scalability**:
- By using multi-chart layouts, you can effectively monitor more symbols without overloading a single chart.
- This approach allows you to scale up your monitoring capabilities to fit your trading strategy.
## Conclusion
The **3-Bar (Outside Bar) Scanner with Table Display** is a valuable tool for traders who utilize **The Strat** methodology. It streamlines the process of identifying key 3-bar patterns across multiple symbols and timeframes, enhancing your ability to make informed trading decisions quickly.
By integrating this indicator into your trading routine, you can:
- Stay alert to significant market movements.
- Reduce the time spent manually scanning charts.
- Increase efficiency in executing your trading strategy.
---
Feel free to share this indicator with the Strat community. Feedback and suggestions are welcome to further enhance its functionality. Happy trading!

EagleVision.V33 - Inside Pin Bar EagleVision.V33 is a specialized indicator designed for traders who focus on price action. It detects and highlights the Inside Pin Bar candle pattern, a key signal that can indicate potential market reversals or trend continuations. This tool is invaluable for traders who rely on precise candlestick patterns to make data-driven decisions.
Features:
• Customizable Pattern Highlighting: EagleVision.V33 allows traders to choose custom colors to highlight Inside Pin Bar patterns directly on the chart. This makes identifying critical trading signals straightforward, even in busy market conditions.
• Pin Bar Candle Customization: Beyond just highlighting, the indicator enables users to change the color of the detected pin bar itself, ensuring that crucial patterns are immediately visible and easy to track.
• Versatile Timeframe Application: The indicator can be applied across various timeframes, from intraday (1 minute, 5 minutes) to longer-term charts (daily, weekly). Users can easily switch between timeframes within the settings, making it adaptable to different trading strategies.
• Enhanced Visual Clarity with Background Highlighting: For traders who prefer additional emphasis, EagleVision.V33 offers an option to apply a background color that highlights the entire region where the Inside Pin Bar pattern is detected.
How It Works:
• Inside Bar Identification: The indicator first identifies an Inside Bar, where a candle’s high and low fall within the range of the preceding candle (the mother bar). This is a foundational pattern in price action trading.
• Pin Bar Detection: It then checks if the candle is a Pin Bar, characterized by a small body and a prominent wick (either upper or lower), which typically signals potential market turning points.
• Pattern Highlighting & Visualization: Upon detecting both conditions (Inside Bar and Pin Bar), EagleVision.V33 highlights the pattern using customizable shapes and colors, and optionally applies a background shade to further enhance visibility.
Use Cases:
• Reversals at Key Levels: The Inside Pin Bar pattern often appears at significant support or resistance levels, signaling potential reversals. EagleVision.V33 helps traders spot these opportunities early.
• Trend Continuations: In trending markets, this pattern can confirm the continuation of a trend, providing traders with the confidence to hold positions or enter new ones.
Customization Options:
• Pattern Highlight Color: Choose a distinct color for the label or shape that marks the Inside Pin Bar pattern, making it stand out against other chart elements.
• Pin Bar Candle Color: Customize the color of the Pin Bar itself, ensuring that it is immediately recognizable on the chart.
• Background Highlighting: Optionally apply a background color to the chart area where the pattern is detected, further enhancing visual clarity and making it easier to spot potential trading opportunities.
Why EagleVision.V33 Stands Out:
EagleVision.V33 is not just another pattern detection tool; it’s engineered for precision and clarity, with highly customizable features that cater to the unique needs of price action traders. By combining both Inside Bar and Pin Bar detection, it offers a powerful edge, providing traders with actionable insights directly on their charts.
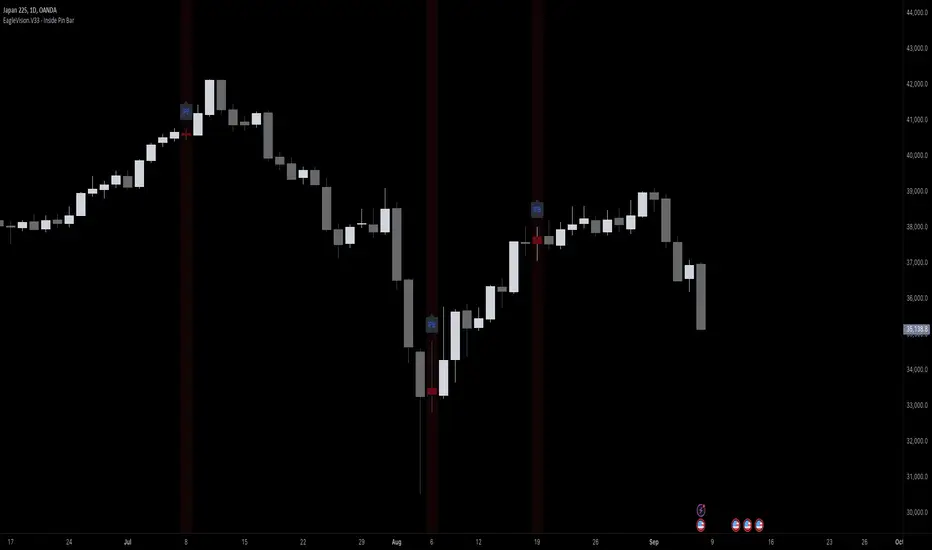
Inside Bar Setup [as]Inside Bar Setup Indicator Description
The **Inside Bar Setup ** indicator is a powerful tool for traders to identify and visualize inside bar patterns on their charts. An inside bar pattern occurs when the current candle's high is lower than the previous candle's high, and the current candle's low is higher than the previous candle's low. This pattern can indicate a potential breakout or a continuation of the existing trend.
Key Features:
1. **Highlight Inside Bar Patterns:**
- The indicator highlights inside bar patterns with distinct colors for bullish and bearish bars. Bullish inside bars are colored with the user-defined bull bar color (default lime), and bearish inside bars are colored with the user-defined bear bar color (default maroon).
2. **Marking Mother Candle High and Low:**
- The high and low of the mother candle (the candle preceding the inside bar) are marked with horizontal lines. The high is marked with a green line, and the low is marked with a red line.
- These levels are labeled as "Range High" and "Range Low" respectively, with the labels displayed a few bars to the right for clarity. The labels have a semi-transparent background for better visibility.
3. **Target Levels:**
- The indicator calculates and plots potential target levels (T1 and T2) for both long and short positions based on user-defined multipliers of the mother candle's range.
- For long positions, T1 and T2 are plotted above the mother candle's high.
- For short positions, T1 and T2 are plotted below the mother candle's low.
- These target levels are optional and can be toggled on or off via the input settings.
4. **Customizable Inputs:**
- **Colors:**
- Bull Bar Color: Customize the color for bullish inside bars.
- Bear Bar Color: Customize the color for bearish inside bars.
- **Long Targets:**
- Show Long T1: Toggle the display of the first long target.
- Show Long T2: Toggle the display of the second long target.
- Long T1: Multiplier for the first long target above the mother candle's high.
- Long T2: Multiplier for the second long target above the mother candle's high.
- **Short Targets:**
- Show Short T1: Toggle the display of the first short target.
- Show Short T2: Toggle the display of the second short target.
- Short T1: Multiplier for the first short target below the mother candle's low.
- Short T2: Multiplier for the second short target below the mother candle's low.
5. **New Day Detection:**
- The indicator detects the start of a new day and clears the inside bar arrays, ensuring that the pattern detection is always current.
#### Usage:
- Add the indicator to your TradingView chart.
- Customize the inputs to match your trading strategy.
- Watch for highlighted inside bars to identify potential breakout opportunities.
- Use the marked range highs and lows, along with the calculated target levels, to plan your trades.
This indicator is ideal for traders looking to capitalize on inside bar patterns and their potential breakouts. It provides clear visual cues and customizable settings to enhance your trading decisions.
Note:
This indicator is based on famous 15 min inside bar strategy shared by Subashish Pani on his youtube channel Power of stocks. Please watch his videos to use this indicator for best results.
