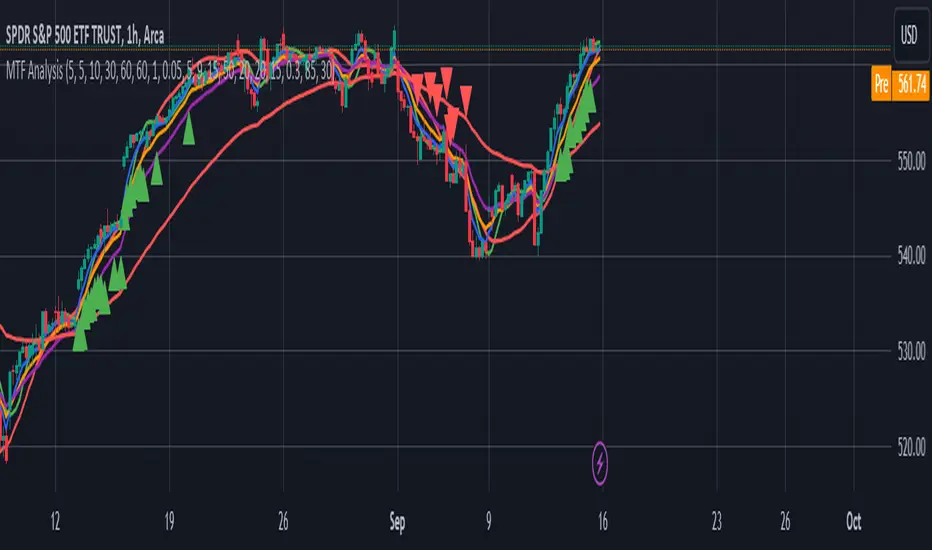
coates moving averages (cma)This indicator uses three moving averages:
2 period low simple ma
2 period high simple ma
9 period least squares ma
The trend is determined by the angle of the moving averages, current close relative the the 9 least squares ma (lsm) and the current close relative to the prior two periods high and low.
When there are consecutive closes inside the prior two candles high and low then a range is signaled:
In ranges the buy zone is between the lowest low and the lowest close of the current range. The sell zone is between the highest high and the highest close. The zones are adjusted as long as the new close is within the prior two candles range:
When price closes above the 2 high ma and the 9 lsm then a bull trend is signaled if all moving averages are angled upward (as seen at #4 in the chart above and #1 the chart below ). If the 9 lsm and / or the 2 low ma continue to angle downward, following a close above the 2 high ma and 9 lsm, then a prolonged range or reversal is expected (#2 in the chart below):
During a bull trend the buy zone is between the 2 low ma and the 9 lsm. The profit target is the 2 high ma:
During dip buying opportunities price should resist closing below the 9 lsm. If there is one close below the 9 lsm then it is a canary in the coalmine that tells us to proceed with caution. This will often signal a range, based on the conditions outlined above. To avoid a prolonged range, or reversal, price needs to immediately react in the direction of the prevailing trend:
If the moving averages are angled down and the most recent close is below the 2 low ma and 9 lsm then trend is fully bearish:
During a bear trend the short zone is between the 2 high ma and 9 lsm. The profit target is the 2 low ma:
When the 2 high ma angles down and the 2 low ma angles up while price closes inside both mas then it indicates a cma squeeze:
Volatility is expected in the direction of the breakout following the squeeze. In this situation traps / shakeouts are common. If there is a wick outside the cma, with a close inside, then it indicates a trap / shakeout. If there is a close outside the 2 high / low ma then it signals a breakout.
A trend is considered balanced when the 9 lsm is roughly equidistant from the 2 low and 2 high mas. If the 9 lsm crosses the 2 high or 2 low ma then it signals exhaustion / imbalance.
For a stop loss I use the prior three periods low, for bull trends, and the prior three periods high for bear trends. I would expect other reliable stops, such as the parabolic sar or bill williams fractal, to be effective as well. The default moving averages should be very effective on all timeframes and assets classes, however this indicator was developed for bitcoin with a focus on higher timeframes such as the 4h, daily and weekly.
As with any other technical indicator there will be bad signals. Proceed with caution and never risk more than you are willing to lose.
חפש סקריפטים עבור "bear"
VPA ANALYSIS VPA Analysis provide the indications for various conditions as per the Volume Spread Analysis concept. The various legends are provided below
LEGEND DETAILS
UT1 - Upthrust Bar: This will be widespread Bar on high Volume closing on the low. This normally happens after an up move. Here the smart money move the price to the High and then quickly brings to the Low trapping many retail trader who rushed into in order not to miss the bullish move. This is a bearish Signal
UT2 -Upthrust Bar Confirmation: A widespread Down Bar following a Upthrust Bar. This confirms the weakness of the Upthrust Bar. Expect the stock to move down
Confirms . This is a Bearish Signal
PUT - Pseudo Upthrust: An Upthrust Bar in bar action but the volume remains average. This still indicates weakness. Indicate Possible Bearishness
PUC -Pseudo Upthrust Confirmation: widespread Bar after a pseudo–Upthrust Bar confirms the weakness of the Pseudo Upthrust Bar
Confirms Bearishness
BC - Buying Climax: A very wide Spread bar on ultra-High Volume closing at the top. Such a Bar indicates the climatic move in an uptrend. This Bar traps many retailers as the uptrend ends and reverses quickly. Confirms Bearishness
TC - Trend Change: This Indicates a possible Trend Change in an uptrend. Indicates Weakness
SEC- Sell Condition: This bar indicates confluence of some bearish signals. Possible end of Uptrend and start of Downtrend soon. Bearish Signal
UT - Upthrust Condition: When multiple bearish signals occur, the legend is printed in two lines. The Legend “UT” indicates that an upthrust condition is present. Bearish Signal
ND - No demand in uptrend: This bar indicates that there is no demand. In an uptrend this indicates weakness. Bearish Signal
ND - No Demand: This bar indicates that there is no demand. This can occur in any part of the Trend. In all place other than in an uptrend this just indicates just weakness
ED - Effort to Move Down: Widespread Bar closing down on High volume or above average volume . The smart money is pushing the prices down. Bearish Signal
EDF - Effort to Move Down Failed: Widespread / above average spread Bar closing up on High volume or above average volume appearing after ‘Effort to move down” bar.
This indicates that the Effort to move the pries down has failed. Bullish signal
SV - Stopping Volume: A high volume medium to widespread Bar closing in the upper middle part in a down trend indicates that smart money is buying. This is an indication that the down trend is likely to end soon. Indicates strength
ST1 - Strength Returning 1: Strength seen returning after a down trend. High volume adds to strength. Indicates Strength
ST2 - Strength Returning 2: Strength seen returning after a down trend. High volume adds to strength.
BYC - Buy Condition: This bar indicates confluence of some bullish signals Possible end of downtrend and start of uptrend soon. Indicates Strength
EU - Effort to Move Up: Widespread Bar closing up on High volume or above average volume . The smart money is pushing the prices up. Bullish Signal
EUF - Effort to Move Up Failed: Widespread / above average spread Bar closing down on High volume or above average volume appearing after ‘Effort to move up” bar.
This indicates that the Effort to move the pries up has failed. Bearish Signal
LVT- Low Volume Test: A low volume bar dipping into previous supply area and closing in the upper part of the Bar. A successful test is a positive sign. Indicates Strength
ST(after a LVT ) - Strength after Successful Low Volume Test: An up Bar closing near High after a Test confirms strength. Bullish Signal
RUT - Reverse Upthrust Bar: This will be a widespread Bar on high Volume closing on the high is a Down Trend. Here the buyers have become active and move the prices from the low to High. The down Move is likely to end and up trend likely to start soon. indicates Strength
NS - No supply Bar: This bar indicates that there is no supply. This is a sign of strength especially in a down trend. Indicates strength
ST - Strength Returns: When multiple bullish signals occur, the legend is printed in two lines. The Legend “ST” indicates that an condition of strength other than the condition mentioned in the second line is present. Bullish Signals
BAR COLORS
Green- Bullish / Strength
Red - Bearish / weakness
Blue / White - Sentiment Changing from bullish to Bearish and Vice Versa
[blackcat] L1 Composite RSI Trend OscillatorLevel: 1
Background
The Relative Strength Index (RSI) is a technical indicator for analyzing financial markets. It is intended to represent the current and historical strength or weakness of a trading pair or a market based on the closing prices of a last trading period.
Function
L1 Composite RSI Trend Oscillator utilizes candles to indicate trend. E.g. yellow candles for bull and fuchsia candles for bear. NOTE: it is inverted to RSI from bull bear perspective. Colorful RSI with yellow indicating bull and fuchsia indicating bear.
Key Signal
lwr1 --> trend oscillator fast line (lwr1 >= lwr2 for bear)
lwr2 --> trend oscillator slow line (lwr1 < lwr2 for bull)
botzone --> bottom zone indicates oversold with green
topzone --> top zone indicates overbought with red
longentry --> long entry signal
shortentry --> short entry signal
Pros and Cons
Pros:
1. combines both the benefit of RSI response and trend oscillator candles
2. divergence can be observed easily
Cons:
1. It may satruate for extreme conditions of long and short.
2. Not accurate for long and short entries and need filtering out noise and fake signal.
Remarks
NA
Readme
In real life, I am a prolific inventor. I have successfully applied for more than 60 international and regional patents in the past 12 years. But in the past two years or so, I have tried to transfer my creativity to the development of trading strategies. Tradingview is the ideal platform for me. I am selecting and contributing some of the hundreds of scripts to publish in Tradingview community. Welcome everyone to interact with me to discuss these interesting pine scripts.
The scripts posted are categorized into 5 levels according to my efforts or manhours put into these works.
Level 1 : interesting script snippets or distinctive improvement from classic indicators or strategy. Level 1 scripts can usually appear in more complex indicators as a function module or element.
Level 2 : composite indicator/strategy. By selecting or combining several independent or dependent functions or sub indicators in proper way, the composite script exhibits a resonance phenomenon which can filter out noise or fake trading signal to enhance trading confidence level.
Level 3 : comprehensive indicator/strategy. They are simple trading systems based on my strategies. They are commonly containing several or all of entry signal, close signal, stop loss, take profit, re-entry, risk management, and position sizing techniques. Even some interesting fundamental and mass psychological aspects are incorporated.
Level 4 : script snippets or functions that do not disclose source code. Interesting element that can reveal market laws and work as raw material for indicators and strategies. If you find Level 1~2 scripts are helpful, Level 4 is a private version that took me far more efforts to develop.
Level 5 : indicator/strategy that do not disclose source code. private version of Level 3 script with my accumulated script processing skills or a large number of custom functions. I had a private function library built in past two years. Level 5 scripts use many of them to achieve private trading strategy.
Divergence RSI [mado]Divergence screener for OBV RSI
Regular Bullish: "D" navy label
Hidden Bullish: "H" navy label
Regular Bearish: "D" red label
Hidden Bearish: "H" red label
Divergence Stoch RSI[mado]Divergence screener for Stoch RSI
Regular Bullish: "D" navy label
Hidden Bullish: "H" navy label
Regular Bearish: "D" red label
Hidden Bearish: "H" red label
Divergence RVI[mado]Divergence screener for RVI
Regular Bullish: "D" navy label
Hidden Bullish: "H" navy label
Regular Bearish: "D" red label
Hidden Bearish: "H" red label
Divergence OBV RSI[mado]Divergence screener for OBV RSI
Regular Bullish: "D" navy label
Hidden Bullish: "H" navy label
Regular Bearish: "D" red label
Hidden Bearish: "H" red label
Divergence MFI[mado]Divergence screener for MFI
Regular Bullish: "D" navy label
Hidden Bullish: "H" navy label
Regular Bearish: "D" red label
Hidden Bearish: "H" red label
Divergence MACD [mado]Divergence screener for MACD
Regular Bullish: "D" navy label
Hidden Bullish: "H" navy label
Regular Bearish: "D" red label
Hidden Bearish: "H" red label
Divergence LinerRegressionSlope[mado]Divergence screener for LinerRegressionSlope
Regular Bullish: "D" navy label
Hidden Bullish: "H" navy label
Regular Bearish: "D" red label
Hidden Bearish: "H" red label
Divergence KlingerVolumeOscillator [mado]Divergence screener for KVO
Regular Bullish: "D" navy label
Hidden Bullish: "H" navy label
Regular Bearish: "D" red label
Hidden Bearish: "H" red label
Divergence CCI [mado]Divergence screener for CCI
Regular Bullish: "D" navy label
Hidden Bullish: "H" navy label
Regular Bearish: "D" red label
Hidden Bearish: "H" red label
Divergence Awesome Oscillator [mado]Divergence screener for Awesome Oscillator
Regular Bullish: "D" navy label
Hidden Bullish: "H" navy label
Regular Bearish: "D" red label
Hidden Bearish: "H" red label
Elder impulse system with double exponential moving average dema
This version of impulse uses the double exponential moving average instead of the typical ema both to calculate macd and the moving slow and fast moving average that are plotted.
The impulse system :
The Impulse System combines two simple but powerful indicators.
One measures market inertia, the other its momentum. When both
point in the same direction, they identify an impulse worth following.
We get an entry signal when both indicators get in gear.
The Impulse System uses an exponential moving average to find
uptrends and downtrends. When the EMA rises, it shows that inertia
favors the bulls. When EMA falls, inertia works for the bears. The sec-
ond component is MACD-Histogram, an oscillator whose slope reflects
changes of power among bulls or bears. When MACD-Histogram rises,
it shows that bulls are becoming stronger. When it falls, it shows that
bears are growing stronger.
The Impulse System flags those bars where both the inertia and the
momentum point in the same direction. When both the EMA and
MACD-Histogram rise, they show that bulls are roaring and the uptrend
is accelerating.
MACD Zero lag impulse systemThis version of impulse uses the double exponential moving average instead of the typical ema.
The impulse system :
The Impulse System combines two simple but powerful indicators.
One measures market inertia, the other its momentum. When both
point in the same direction, they identify an impulse worth following.
We get an entry signal when both indicators get in gear.
The Impulse System uses an exponential moving average to find
uptrends and downtrends. When the EMA rises, it shows that inertia
favors the bulls. When EMA falls, inertia works for the bears. The sec-
ond component is MACD-Histogram, an oscillator whose slope reflects
changes of power among bulls or bears. When MACD-Histogram rises,
it shows that bulls are becoming stronger. When it falls, it shows that
bears are growing stronger.
The Impulse System flags those bars where both the inertia and the
momentum point in the same direction. When both the EMA and
MACD-Histogram rise, they show that bulls are roaring and the uptrend
is accelerating.
Elder impulse system with barcolor + Safezone stops + emasThe impulse system :
The Impulse System combines two simple but powerful indicators.
One measures market inertia, the other its momentum. When both
point in the same direction, they identify an impulse worth following.
We get an entry signal when both indicators get in gear.
The Impulse System uses an exponential moving average to find
uptrends and downtrends. When the EMA rises, it shows that inertia
favors the bulls. When EMA falls, inertia works for the bears. The sec-
ond component is MACD-Histogram, an oscillator whose slope reflects
changes of power among bulls or bears. When MACD-Histogram rises,
it shows that bulls are becoming stronger. When it falls, it shows that
bears are growing stronger.
The Impulse System flags those bars where both the inertia and the
momentum point in the same direction. When both the EMA and
MACD-Histogram rise, they show that bulls are roaring and the uptrend
is accelerating.
The SafeZone Stop :
Once in a trade, where should you put your stop? This is one of the
hardest questions in technical analysis. After answering it, you’ll face
an even harder one—when and where to move that stop with the pas-
sage of time. Put a stop too close and it’ll get whacked by some mean-
ingless intraday swing. Put it too far, and you’ll have very skimpy
protection.
The Parabolic System, described in Trading for a Living, tried to
tackle this problem by moving stops closer to the market each day,
accelerating whenever a stock or a commodity reached a new extreme.
The trouble with Parabolic was that it kept moving even if the market
stayed flat and often got hit by meaningless noise.
SafeZone trails prices with stops tight enough to protect
capital but remote enough to keep clear of most random fluctuations.
Engineers design filters to suppress noise and allow the signal to come
through. If the trend is the signal, then the countertrend motion is the
noise. When the trend is up, we can define noise as that part of each
day’s range that protrudes below the previous day’s low. When the trend
is down, we can define noise as that part of each day’s range that pro-
trudes above the previous day’s high. SafeZone measures market noise
and places stops at a multiple of noise level away from the market.
We can make our lookback period 100 days or so if we want to aver-
age long-term market behavior.
SafeZone offers an original approach to placing stops. It monitors
changes in prices and adapts stops to the current levels of activity. It
places stops at individually tailored distances rather than at obvious
support and resistance levels.
Absolute Strength MTF IndicatorIntroduction
The non-signal version of the absolute strength indicator from fxcodebase.com requested by ernie76 . This indicator originally from mt4 aim to estimate the bullish/bearish force of the market by using various methods.
The Indicator
Two lines are plotted, a bull line (blue) representing the bullish/buying force and a bear one (red) representing the bearish/selling force, when the bull line is greater than the bear line the market is considered to be strongly bullish, else strongly bearish.
The indicator use various method, Rsi, stochastic, adx. The Rsi method is the one by default.
The stochastic method is less reactive but smoother
The Adx method is way different, while the other two methods make the bull and bear lines somewhat uncorrelated, the adx method focus more on the overall market strength than individual buyer/seller strength.
The smoothing method use 3 different filters, SMA, EMA and LSMA, LSMA is more reactive than the two previous one while EMA is just more computer efficient.
It is possible to use price data of different time frames for the calculation of the indicator.
Stochastic method with 4 hour price close as source.
Conclusion
A classic indicator who can be derived into a lot of ways using a more adaptive architecture or recursion. Hope you find it a use :)
A big thanks to ernie76 for the request and the support/testing of the indicator
Feel free to pm me for any request.
Ichimoku Kinko Hyo: Basic StrategyIchimoku Kinko Hyo: Basic Strategy
Entry/Exit orders are placed when three basic signals are triggered.
Ichimoku Signals:
1) Tenkan-Sen/Kijun-Sen Cross
Bullish: Tenkan-Sen is above the Kijun-Sen.
Bearish: Tenkan-Sen is below the Kijun-Sen.
2) Chikou-Span Cross
Bullish: Chikou-Span is above the close of 26 bars ago.
Bearish: Chikou-Span is below the close of 26 bars ago.
3) Price versus Kumo Cloud
Bullish: Close is above the Kumo Cloud.
Bearish: Close is below the Kumo Cloud.
Notes:
1) Long-only or short-only direction is feasible by checkbox. Stop and reverse strategy is taken by default.
2) Built-in Ichimoku indicator is strictly wrong because of counting one extra bar for all Ichimoku components.
Including the current bar like moving average is correct way in Japan. This problem is fixed in my script.
Unreached Highs/Lows Oscillator [LuxAlgo]The Unreached Highs/Lows Oscillator highlights the amount of unreached high/low prices as a percentage over time, helping visualize trend strength and momentum from bullish and bearish market participants.
🔶 USAGE
This indicator measures the strength of directional price movements, helping traders visualize the strength of both the bullish and bearish market participants.
When prices are moving up with strength, the price structure will not come back to retest previous lows. Therefore, unreached lows keep adding up.
When prices are moving down with strength, they will not retest previous highs; therefore, unreached highs keep adding up.
As we can see on the chart, high readings of unreached highs (red) and low readings of unreached lows (green) are considered bearish, and a downtrend in price confirms this bias. Conversely, high readings of unreached lows and low readings of unreached highs are considered bullish. On the chart, this is reflected as an uptrend.
Additionally, the oscillator can reveal significant breakouts on the chart, with unreached highs or lows decreasing rapidly indicating that a large number of highs/lows have been reached.
Due to the oscillator being normalized, overbought and oversold levels are included.
In this gold chart, we have different examples of how to use the tool in conjunction with price behavior to understand the market. Let's dissect it step by step:
1. Uptrend: Bullish readings are above 80, and bearish readings are below 20. The market is trending up.
2. Range: Mixed readings around 50 for both bullish and bearish; the market is ranging.
3. Uptrend: The same as before. Bullish above 80 and bearish below 20.
4. Pullback: A bullish dip below 80 to 50 and a bearish reading below 20 indicates a pullback.
5. Range: Mixed readings. In this case, it is bullish above and below 80 and bearish above and below 20. The market is ranging.
6. Uptrend: Bullish above 80 and bearish below 20; the market keeps moving up.
7. Pullback: Bullish dips below 80 and bearish rises to 50 indicate a pullback.
8. Uptrend: As before, bullish is above 80 and bearish is below 20; the market is trending up.
This Bitcoin chart shows how to use extreme readings of 0 and 100 to detect potential reversals. When both readings are at extreme opposites, we set the threshold level at 100 and 0 instead of the default levels of 80 and 20 to better identify these areas.
As we can see, extreme readings at points 1 and 5 identify major reversals that lead to a change in trend. Extreme readings at points 2, 3, 4, and 6 identify minor reversals that do not lead to a change in trend.
From the settings panel, traders can adjust the length parameter. A smaller value measures smaller price movements, while a larger value measures larger price movements. A length value of 20 is used by default.
The chart shows how different values affect bullish and bearish measures.
🔶 SETTINGS
Length: Select the maximum number of highs and lows to be used.
🔹 Style
Bullish: Select a color for unreached lows.
Bearish: Select a color for unreached highs.
Top Threshold: Select the top threshold level and color. Enable the Auto feature to choose the default color.
Bottom Threshold: Select the bottom threshold level and color. Enable the Auto feature to choose the default color.
Order Blocks INDIBOT 3D | INDIBOT ABO SALTAN 11 //@version=6
indicator("Order Blocks INDIBOT 3D | INDIBOT ABO SALTAN ", overlay = true,
max_boxes_count = 500, max_labels_count = 500, max_lines_count = 500, max_polylines_count = 100, max_bars_back = 5000)
//#region CONSTANTS
// Core constants that control stored OB capacity and label size.
const int MAX_STORED_OBS = 50
const int retestSize = 4
//#endregion
//#region INPUTS
// Core user controls for OB behavior, volume delta, 3D style and alerts.
grpOB = "ORDER BLOCKS"
swingLen = input.int(5, "Swing Length", minval = 1, group = grpOB, inline = "sw", display = display.none)
bullObColor = input.color(color.new(color.teal, 55), "", group = grpOB, inline = "sw")
bearObColor = input.color(color.new(color.red, 55), "", group = grpOB, inline = "sw")
invMethod = input.string("Wick", "Invalidation", options = , group = grpOB, display = display.none)
showNearestX = input.int(3, "Show Nearest", minval = 1, maxval = 20, group = grpOB, display = display.none)
extendZones = input.int(10, "Extend Zones", minval = 0, group = grpOB,
tooltip = "This will extend the zones by X candles.", display = display.none)
showRetestLbl = input.bool(true, "Retest Labels", group = grpOB, inline = "tog")
hideInvalid = input.bool(true, "Hide Invalidated Zones", group = grpOB, inline = "tog")
grpVD = "VOLUME DELTA"
vdEnable = input.bool(true, "Enable", group = grpVD, inline = "vd")
vdBullColor = input.color(color.new(color.teal, 65), "", group = grpVD, inline = "vd")
vdBearColor = input.color(color.new(color.red, 65), "", group = grpVD, inline = "vd")
vd3D = input.bool(true, "3D", group = grpVD, inline = "3d", tooltip = "Adds 3D-style depth faces.") and vdEnable
vd3DDepth = input.int(5, "", group = grpVD, inline = "3d", minval = 1, maxval = 5, display = display.none)
displayStyle = input.string("Vertical", "Display Style", options = , group = grpVD,
tooltip = "Horizontal: split shown top/bottom.\nVertical: split shown left/right across the zone.", display = display.none)
vdTfIn = input.timeframe("", "Volume Delta Timeframe", group = grpVD,
tooltip = "Lower timeframe used to estimate delta")
showTotalVol = input.bool(true, "Display Total Volume", group = grpVD,
tooltip = "Displays total volume (Bull+Bear) from the active delta source.", inline = "vd2") and vdEnable
showDeltaPct = input.bool(true, "Show Delta %", group = grpVD, inline = "vd2",
tooltip = "Shows bullish vs bearish volume split.\nIf selected TF is lower than chart TF, uses LTF data; otherwise uses chart TF.") and vdEnable
vdTextColor = input.color(color.white, "", group = grpVD, inline = "vd2")
grpAL = "ALERTS"
alBullOB = input.bool(true, "Bullish Order Block", group = grpAL, inline = "oba")
alBearOB = input.bool(true, "Bearish Order Block", group = grpAL, inline = "oba")
alBullRetest = input.bool(true, "Bullish OB Retest", group = grpAL, inline = "obr")
alBearRetest = input.bool(true, "Bearish OB Retest", group = grpAL, inline = "obr")
//#endregion
//#region TYPES
// Custom structs for order blocks and 3D poly drawing.
type PolyParams
array points
color lineColor
color fillColor
int lineWidth
type ObRec
int leftIndex
int leftTime
int createdIndex
int createdTime
float top
float bottom
bool isBull
bool active
bool retested
int retestIndex
int retestTime
int invalidIndex
int invalidTime
float bullVol
float bearVol
float totalVol
float bullPct
float bearPct
bool hasDelta
type RetestRec
int barIndex
bool isBull
int obLeftIndex
int obCreatedIndex
//#endregion
//#region GENERIC HELPERS
// Small utilities: clearing drawings, geometry helpers, nearest-OB picking.
method clearAll(array bx, array pl, array lb) =>
if bx.size() > 0
for i = 0 to bx.size() - 1
bx.get(i).delete()
bx.clear()
if pl.size() > 0
for i = 0 to pl.size() - 1
pl.get(i).delete()
pl.clear()
if lb.size() > 0
for i = 0 to lb.size() - 1
lb.get(i).delete()
lb.clear()
// Builds a simple side face for 3D-style boxes using chart points.
method sideBox(array pts, int x, float btm, float top, float depthY, int widthX) =>
pts.unshift(chart.point.from_index(x, btm))
pts.unshift(chart.point.from_index(x + widthX, btm + depthY))
pts.unshift(chart.point.from_index(x + widthX, top + depthY))
pts.unshift(chart.point.from_index(x, top))
pts.unshift(chart.point.from_index(x, btm))
// Returns true if a candle's high/low intersects the OB zone.
touchesZone(float zTop, float zBot, float cHigh, float cLow) =>
cHigh >= zBot and cLow <= zTop
// Distance from price to zone in price units, used to rank nearest zones.
zoneDistance(float px, float zTop, float zBot) =>
px > zTop ? px - zTop : px < zBot ? zBot - px : 0.0
// Inserts a distance+index pair into a sorted list, capped at kMax.
method insertBest(array dists, array idxs, float dist, int idx, int kMax) =>
if dists.size() == 0
dists.push(dist)
idxs.push(idx)
else
int pos = dists.size()
if dists.size() > 0
for j = 0 to dists.size() - 1
if dist < dists.get(j)
pos := j
break
dists.insert(pos, dist)
idxs.insert(pos, idx)
while dists.size() > kMax
dists.pop()
idxs.pop()
// Picks the k nearest bull/bear OBs to current price (optionally including invalid).
pickNearest(array store, bool wantBull, int kMax, bool includeInvalid) =>
array dists = array.new_float()
array idxs = array.new_int()
if store.size() > 0
for i = 0 to store.size() - 1
ObRec ob = store.get(i)
if ob.isBull == wantBull
bool ok = includeInvalid ? true : ob.active
if ok
float dist = zoneDistance(close, ob.top, ob.bottom)
dists.insertBest(idxs, dist, i, kMax)
idxs
formatVol(float v) =>
str.tostring(v, format.volume)
//#endregion
//#region VOLUME ENGINE (CHART OR LOWER TF)
// Per-bar total / bull / bear volume
tfSec(string tf) =>
timeframe.in_seconds(tf)
int chartSec = tfSec(timeframe.period)
int srcSec = tfSec(vdTfIn)
bool useLtf = not na(chartSec) and not na(srcSec) and srcSec < chartSec
getBarVols() =>
float tot = na
float bull = na
float bear = na
if not useLtf or vdTfIn == ""
float v = volume
bool up = close > open
bool dn = close < open
tot := v
bull := up ? v : 0.0
bear := dn ? v : 0.0
else
array oArr = request.security_lower_tf(syminfo.tickerid, vdTfIn, open)
array cArr = request.security_lower_tf(syminfo.tickerid, vdTfIn, close)
array vArr = request.security_lower_tf(syminfo.tickerid, vdTfIn, volume)
float tSum = 0.0
float bSum = 0.0
float sSum = 0.0
int n = array.size(vArr)
if n > 0
for i = 0 to n - 1
float v2 = array.get(vArr, i)
float o2 = array.get(oArr, i)
float c2 = array.get(cArr, i)
tSum += v2
if c2 > o2
bSum += v2
else if c2 < o2
sSum += v2
tot := tSum
bull := bSum
bear := sSum
= getBarVols()
//#endregion
//#region POC ENGINE (MOST-TOUCHED PRICE + VOLUME)
// Finds a POC between swing and BOS, then aggregates volume.
findMostTouchedPrice(int fromIdx, int toIdx, int nBins) =>
int span = toIdx - fromIdx
if span <= 0 or na(fromIdx) or na(toIdx)
else
float minP = 1e10
float maxP = -1e10
for idx = fromIdx to toIdx
int rel = bar_index - idx
if rel >= 0
float lo = low
float hi = high
if not na(lo) and not na(hi)
if lo < minP
minP := lo
if hi > maxP
maxP := hi
if not (minP < maxP)
else
float step = (maxP - minP) / nBins
step := step <= 0 ? syminfo.mintick : step
array diffCnt = array.new_float(nBins, 0.0)
for idx = fromIdx to toIdx
int rel2 = bar_index - idx
if rel2 >= 0
float lo2 = low
float hi2 = high
if not na(lo2) and not na(hi2)
int sBin = int(math.floor((lo2 - minP) / step))
int eBin = int(math.floor((hi2 - minP) / step))
sBin := sBin < 0 ? 0 : sBin > nBins - 1 ? nBins - 1 : sBin
eBin := eBin < 0 ? 0 : eBin > nBins - 1 ? nBins - 1 : eBin
float cStart = diffCnt.get(sBin)
diffCnt.set(sBin, cStart + 1.0)
if eBin + 1 < nBins
float cEnd = diffCnt.get(eBin + 1)
diffCnt.set(eBin + 1, cEnd - 1.0)
int bestBin = 0
float bestCnt = 0.0
float runCnt = 0.0
for i = 0 to nBins - 1
runCnt += diffCnt.get(i)
if runCnt > bestCnt
bestCnt := runCnt
bestBin := i
float poc = minP + (bestBin + 0.5) * step
// Aggregates total / bull / bear volume at a single price level (POC) for a range.
volumeAtPrice(int fromIdx, int toIdx, float poc) =>
int touches = 0
float totVol = 0.0
float bullVol = 0.0
float bearVol = 0.0
int span = toIdx - fromIdx
if not na(poc) and span >= 0
for step = 0 to span
int idx = toIdx - step
int rel = bar_index - idx
if rel >= 0
float lo = low
float hi = high
if not na(lo) and not na(hi) and lo <= poc and hi >= poc
touches += 1
float vTot = barTotVol
float vBull = barBullVol
float vBear = barBearVol
if not na(vTot)
totVol += vTot
if not na(vBull)
bullVol += vBull
if not na(vBear)
bearVol += vBear
// Wrapper: find POC first, then compute volume at that POC for the BOS range.
calcMostTouchedPriceVol(int fromIdx, int toIdx, int nBins) =>
= findMostTouchedPrice(fromIdx, toIdx, nBins)
= volumeAtPrice(fromIdx, toIdx, poc)
//#endregion
//#region ORDER BLOCK ENGINE (POC-BASED)
// Detects swing highs/lows, confirms BOS, anchors OB at first POC touch.
var array obs = array.new()
var array obRetests = array.new()
var int lastBullRetestBar = na
var int lastBearRetestBar = na
var float shPrice = na
var int shIdx = na
var float slPrice = na
var int slIdx = na
bool evNewBullOB = false
bool evNewBearOB = false
bool evBullRetest = false
bool evBearRetest = false
float ph = ta.pivothigh(high, swingLen, swingLen)
float pl = ta.pivotlow(low, swingLen, swingLen)
if not na(ph)
shPrice := ph
shIdx := bar_index - swingLen
if not na(pl)
slPrice := pl
slIdx := bar_index - swingLen
bool bosBearNow = not na(slPrice) and bar_index > slIdx and close < slPrice and close >= slPrice
bool bosBullNow = not na(shPrice) and bar_index > shIdx and close > shPrice and close <= shPrice
bool bosBear = bosBearNow
bool bosBull = bosBullNow
// Precompute BOS ranges and POC stats in global scope
int bosIdxBear = bar_index - 1
int fromIdxBear = slIdx
int toIdxBear = bosIdxBear
= calcMostTouchedPriceVol(fromIdxBear, toIdxBear, 40)
int bosIdxBull = bar_index - 1
int fromIdxBull = shIdx
int toIdxBull = bosIdxBull
= calcMostTouchedPriceVol(fromIdxBull, toIdxBull, 40)
// Keeps OB array trimmed to recent history and limits max stored OBs.
pruneObs() =>
int minLeft = math.max(0, bar_index - 4999)
if obs.size() > 0
for i = obs.size() - 1 to 0
ObRec ob = obs.get(i)
if ob.leftIndex < minLeft
obs.remove(i)
while obs.size() > MAX_STORED_OBS
bool removed = false
if obs.size() > 0
for j = obs.size() - 1 to 0
ObRec ob2 = obs.get(j)
if not ob2.active
obs.remove(j)
removed := true
break
if not removed and obs.size() > 0
obs.pop()
// Creates and seeds an OB record using a POC-anchored candle and BOS volumes.
addObFromPoc(int baseIdx, float top, float bottom, bool isBull, float totSeed, float bullSeed, float bearSeed, int createdIdx) =>
int offLeft = bar_index - baseIdx
int offCreated = bar_index - createdIdx
int leftTime = time
int createdTm = time
float tot = totSeed
float bVol = bullSeed
float sVol = bearSeed
bool hasDelta = tot > 0.0
float bullPct = hasDelta ? math.round((bVol / tot) * 100.0) : 50.0
float bearPct = hasDelta ? 100.0 - bullPct : 50.0
obs.unshift(ObRec.new(baseIdx, leftTime, createdIdx, createdTm, top, bottom, isBull,
true, false, na, na, na, na, bVol, sVol, tot, bullPct, bearPct, hasDelta))
pruneObs()
// Returns true if a proposed zone overlaps any active OB
obOverlapsActive(float zoneTop, float zoneBottom) =>
float zTop = math.max(zoneTop, zoneBottom)
float zBot = math.min(zoneTop, zoneBottom)
bool overlaps = false
if obs.size() > 0
for i = 0 to obs.size() - 1
ObRec ob = obs.get(i)
if ob.active
float oTop = math.max(ob.top, ob.bottom)
float oBot = math.min(ob.top, ob.bottom)
bool rangeOverlap = zTop >= oBot and zBot <= oTop
if rangeOverlap
overlaps := true
break
overlaps
// Returns true if there is a price gap between anchorIdx and bosIdx.
hasGapBetween(int anchorIdx, int bosIdx, bool isBull) =>
bool gap = false
int fromIdx = math.min(anchorIdx, bosIdx)
int toIdx = math.max(anchorIdx, bosIdx)
if toIdx - fromIdx >= 1
for absIdx = fromIdx + 1 to toIdx
int relNow = bar_index - absIdx
int relPrev = relNow + 1
if relNow >= 0 and relPrev >= 0
float hiPrev = high
float loPrev = low
float hiNow = high
float loNow = low
if not na(hiPrev) and not na(loPrev) and not na(hiNow) and not na(loNow)
if isBull
if loNow > hiPrev
gap := true
break
else
if hiNow < loPrev
gap := true
break
gap
// Bearish BOS → Bearish OB
if bosBear
int bosIdx = bosIdxBear
int fromIdx = fromIdxBear
int toIdx = toIdxBear
if not na(pocB) and touchesB > 0 and not na(fromIdx) and not na(toIdx)
int spanB = toIdx - fromIdx
int bestIdx = na
float runMaxHigh = na
if spanB >= 0
for step = 0 to spanB
int idx = toIdx - step
int rel = bar_index - idx
if rel >= 0
float lo = low
float hi = high
if not na(lo) and not na(hi)
runMaxHigh := na(runMaxHigh) ? hi : math.max(runMaxHigh, hi)
bool touches = lo <= pocB and hi >= pocB
if touches and hi == runMaxHigh
bestIdx := idx
bool gapLeg = not na(bestIdx) ? hasGapBetween(bestIdx, bosIdx, false) : false
if not na(bestIdx) and not gapLeg
int relBest = bar_index - bestIdx
float top = high
float bottom = low
if not obOverlapsActive(top, bottom)
addObFromPoc(bestIdx, top, bottom, false, totVolB, bullVolB, bearVolB, bosIdx)
evNewBearOB := true
slPrice := na
slIdx := na
// Bullish BOS → Bullish OB
if bosBull
int bosIdx2 = bosIdxBull
int fromIdx2 = fromIdxBull
int toIdx2 = toIdxBull
if not na(pocH) and touchesH > 0 and not na(fromIdx2) and not na(toIdx2)
int spanH = toIdx2 - fromIdx2
int bestIdx2 = na
float runMinLow = na
if spanH >= 0
for step = 0 to spanH
int idx2 = toIdx2 - step
int rel2 = bar_index - idx2
if rel2 >= 0
float lo2 = low
float hi2 = high
if not na(lo2) and not na(hi2)
runMinLow := na(runMinLow) ? lo2 : math.min(runMinLow, lo2)
bool touches = lo2 <= pocH and hi2 >= pocH
if touches and lo2 == runMinLow
bestIdx2 := idx2
bool gapLeg2 = not na(bestIdx2) ? hasGapBetween(bestIdx2, bosIdx2, true) : false
if not na(bestIdx2) and not gapLeg2
int relBest2 = bar_index - bestIdx2
float top2 = high
float bottom2 = low
if not obOverlapsActive(top2, bottom2)
addObFromPoc(bestIdx2, top2, bottom2, true, totVolH, bullVolH, bearVolH, bosIdx2)
evNewBullOB := true
shPrice := na
shIdx := na
// Invalidation and retest detection for existing OBs.
if obs.size() > 0
for i = 0 to obs.size() - 1
ObRec ob = obs.get(i)
if ob.active
bool invalid = false
int invIdx = na
int invTime = na
if ob.isBull
if invMethod == "Wick"
invalid := low < ob.bottom
invIdx := bar_index
invTime := time
else
if bar_index > 0
invalid := close < ob.bottom
invIdx := bar_index - 1
invTime := time
else
if invMethod == "Wick"
invalid := high > ob.top
invIdx := bar_index
invTime := time
else
if bar_index > 0
invalid := close > ob.top
invIdx := bar_index - 1
invTime := time
if invalid
ob.active := false
ob.invalidIndex := invIdx
ob.invalidTime := invTime
bool retestPrev = false
int retestBar = na
int retestTm = na
if bar_index > 0
if ob.isBull
bool opensAbovePrev = open > ob.top
bool closesAbovePrev = close > ob.top
bool wickTouchesPrev = low <= ob.top and low >= ob.bottom
retestPrev := opensAbovePrev and closesAbovePrev and wickTouchesPrev
else
bool opensBelowPrev = open < ob.bottom
bool closesBelowPrev = close < ob.bottom
bool wickTouchesPrev = high >= ob.bottom and high <= ob.top
retestPrev := opensBelowPrev and closesBelowPrev and wickTouchesPrev
if retestPrev
retestBar := bar_index - 1
retestTm := time
if retestPrev and not na(retestBar) and retestBar > ob.createdIndex
ob.retested := true
ob.retestIndex := retestBar
ob.retestTime := retestTm
int lastSideBar = ob.isBull ? lastBullRetestBar : lastBearRetestBar
bool canLog = na(lastSideBar) or retestBar - lastSideBar >= 4
if canLog
obRetests.unshift(RetestRec.new(retestBar, ob.isBull, ob.leftIndex, ob.createdIndex))
if ob.isBull
evBullRetest := true
lastBullRetestBar := retestBar
else
evBearRetest := true
lastBearRetestBar := retestBar
obs.set(i, ob)
//#endregion
//#region DRAW ENGINE (ZONES + VOLUME + 3D)
// Handles all boxes, polylines and labels for OBs and 3D faces.
bool showVD = vdEnable
bool isVert = displayStyle == "Vertical"
bool isHorz = not isVert
float dayAtr = ta.atr(14)
var array allBoxes = array.new()
var array allPolys = array.new()
var array allLabels = array.new()
drawPoly(PolyParams pp) =>
if not na(pp) and not na(pp.points) and pp.points.size() > 0
allPolys.unshift(polyline.new(points = pp.points, line_color = pp.lineColor, fill_color = pp.fillColor))
method pushBox(array store, box b) =>
store.unshift(b)
method pushLabel(array store, label l) =>
store.unshift(l)
// Chooses base colors for OB zones depending on vdEnable and bull/bear type.
obColors(ObRec ob) =>
color bullCol = vdEnable ? vdBullColor : bullObColor
color bearCol = vdEnable ? vdBearColor : bearObColor
color baseCol = ob.isBull ? bullCol : bearCol
color faded = ob.active ? baseCol : color.new(baseCol, 85)
// Computes right-most bar index for drawing an OB, considering extension and invalidation.
obRightIndex(ObRec ob) =>
int activeRight = bar_index + extendZones
if ob.active
activeRight
else
na(ob.invalidIndex) ? activeRight : ob.invalidIndex
// Draws the main OB zone box on the chart.
drawObZoneBox(ObRec ob, color faded) =>
int xR = obRightIndex(ob)
int xL = ob.leftIndex
int minBar = bar_index - 4999
if xL < minBar
xL := minBar
xR := math.max(xR, xL)
box bx = box.new(left = xL, right = xR, top = ob.top, bottom = ob.bottom, xloc = xloc.bar_index, bgcolor = faded, border_color = na, border_width = 0)
allBoxes.pushBox(bx)
// Draws a retest marker (triangle) when price revisits an OB.
drawRetestLabels(array bullAct, array bearAct, array bullInv, array bearInv) =>
int ret = 0
if showRetestLbl and obRetests.size() > 0
int minBar = bar_index - 4999
int lastBullLbl = na
int lastBearLbl = na
for i = obRetests.size() - 1 to 0
RetestRec r = obRetests.get(i)
if r.barIndex < minBar or r.barIndex > bar_index
RetestRec _trash = obRetests.remove(i)
else
bool hasDisplayedParent = false
if r.isBull
if bullAct.size() > 0
for j = 0 to bullAct.size() - 1
ObRec ob = obs.get(bullAct.get(j))
if ob.leftIndex == r.obLeftIndex and ob.createdIndex == r.obCreatedIndex
hasDisplayedParent := true
break
if not hasDisplayedParent and not hideInvalid and bullInv.size() > 0
for j = 0 to bullInv.size() - 1
ObRec ob = obs.get(bullInv.get(j))
if ob.leftIndex == r.obLeftIndex and ob.createdIndex == r.obCreatedIndex
hasDisplayedParent := true
break
else
if bearAct.size() > 0
for j = 0 to bearAct.size() - 1
ObRec ob = obs.get(bearAct.get(j))
if ob.leftIndex == r.obLeftIndex and ob.createdIndex == r.obCreatedIndex
hasDisplayedParent := true
break
if not hasDisplayedParent and not hideInvalid and bearInv.size() > 0
for j = 0 to bearInv.size() - 1
ObRec ob = obs.get(bearInv.get(j))
if ob.leftIndex == r.obLeftIndex and ob.createdIndex == r.obCreatedIndex
hasDisplayedParent := true
break
if not hasDisplayedParent
continue
int age = bar_index - r.barIndex
if age >= 0 and age <= 4999
if r.isBull
if not na(lastBullLbl) and r.barIndex - lastBullLbl < 3
continue
lastBullLbl := r.barIndex
else
if not na(lastBearLbl) and r.barIndex - lastBearLbl < 3
continue
lastBearLbl := r.barIndex
float yPrice = close
color baseCol = r.isBull ? bullObColor : bearObColor
st = r.isBull ? label.style_triangleup : label.style_triangledown
yl = r.isBull ? yloc.belowbar : yloc.abovebar
label newLbl = label.new(r.barIndex, yPrice, "", xloc = xloc.bar_index, yloc = yl, style = st,
color = color.new(baseCol, 0), textcolor = color.new(baseCol, 0), size = retestSize, force_overlay = true)
allLabels.pushLabel(newLbl)
ret
// Returns geometry used for volume overlay and 3D top view.
obGeom(ObRec ob) =>
int rawL = ob.leftIndex
int rawR = obRightIndex(ob)
int minBar = bar_index - 4999
int xL = math.max(rawL, minBar)
int xR = math.max(rawR, xL)
int widthX = vd3DDepth
int xR2 = xR + widthX
float yT = ob.top
float yB = ob.bottom
float h = yT - yB
// Converts bull/bear percentages into display strings (if enabled).
deltaTexts(float bullPct, float bearPct) =>
string bullTxt = showDeltaPct ? str.tostring(bullPct) + "%" : ""
string bearTxt = showDeltaPct ? str.tostring(bearPct) + "%" : ""
// Draws a text label with total volume on the right-bottom corner of the OB.
drawTotalVolLabel(int xL, int xR, float yT, float yB, float h, float total) =>
if showTotalVol
int cx = xR - 1
if cx < xL
cx := xL
float cy = yB + h * 0.25
string txt = formatVol(total)
label lb = label.new(cx, cy, txt, xloc = xloc.bar_index, style = label.style_label_right,
textcolor = vdTextColor, color = #ffffff00, size = size.small, force_overlay = true)
allLabels.pushLabel(lb)
// Fills the OB with bull/bear split either vertically or horizontally.
drawDeltaFills(int xL, int xR, float yT, float yB, float h, float bullPct, string bullTxt, string bearTxt) =>
color bullCol = vdEnable ? vdBullColor : bullObColor
color bearCol = vdEnable ? vdBearColor : bearObColor
if isVert
int splitX = xL + int((xR - xL) * (bullPct / 100.0))
splitX := xR - xL >= 2 ? math.max(xL + 1, math.min(xR - 1, splitX)) : xL
box bBull = box.new(xL, yT, splitX, yB, xloc = xloc.bar_index, bgcolor = bullCol, border_width = 0, text = bullTxt, text_color = vdTextColor, text_size = size.small)
box bBear = box.new(splitX, yT, xR, yB, xloc = xloc.bar_index, bgcolor = bearCol, border_width = 0, text = bearTxt, text_color = vdTextColor, text_size = size.small)
allBoxes.pushBox(bBull)
allBoxes.pushBox(bBear)
else
float midY = yB + h * (bullPct / 100.0)
box bBull = box.new(xL, midY, xR, yB, xloc = xloc.bar_index, bgcolor = bullCol, border_width = 0, text = bullTxt, text_color = vdTextColor, text_size = size.small)
box bBear = box.new(xL, yT, xR, midY, xloc = xloc.bar_index, bgcolor = bearCol, border_width = 0, text = bearTxt, text_color = vdTextColor, text_size = size.small)
allBoxes.pushBox(bBull)
allBoxes.pushBox(bBear)
// Track first visible bar index for 3D top face clipping.
var int leftVisIdx = na
if na(leftVisIdx) and time >= chart.left_visible_bar_time
leftVisIdx := bar_index
// Draws the 3D front faces and top faces based on bull/bear split and style.
drawDelta3D(int xL, int xR, int widthX, int xR2, float yT, float yB, float h, float bullPct) =>
color bullCol = vdEnable ? vdBullColor : bullObColor
color bearCol = vdEnable ? vdBearColor : bearObColor
float depthY = dayAtr * (0.1 * vd3DDepth)
int visibleLeft = na(leftVisIdx) ? xL : math.max(xL, leftVisIdx)
int visibleRight = xR
if isHorz
float midY = yB + h * (bullPct / 100.0)
if bullPct > 0
array ptsFrontBull = array.new()
ptsFrontBull.sideBox(xR, yB, midY, depthY, widthX)
drawPoly(PolyParams.new(ptsFrontBull, color.new(chart.fg_color, 90), color.new(bullCol, 70), 1))
if bullPct < 100
array ptsFrontBear = array.new()
ptsFrontBear.sideBox(xR, midY, yT, depthY, widthX)
drawPoly(PolyParams.new(ptsFrontBear, color.new(chart.fg_color, 90), color.new(bearCol, 70), 1))
if visibleRight > visibleLeft
array ptsTop = array.new()
ptsTop.unshift(chart.point.from_index(visibleRight + widthX, yT + depthY))
ptsTop.unshift(chart.point.from_index(visibleLeft + widthX, yT + depthY))
ptsTop.unshift(chart.point.from_index(visibleLeft, yT))
ptsTop.unshift(chart.point.from_index(visibleRight, yT))
ptsTop.unshift(chart.point.from_index(visibleRight + widthX, yT + depthY))
drawPoly(PolyParams.new(ptsTop, color.new(chart.fg_color, 90), color.new(bearCol, 70), 1))
else
array ptsFront = array.new()
ptsFront.sideBox(xR, yB, yT, depthY, widthX)
drawPoly(PolyParams.new(ptsFront, color.new(chart.fg_color, 90), color.new(bearCol, 70), 1))
if visibleRight > visibleLeft
float frac = bullPct / 100.0
int bullRight = visibleLeft + int((visibleRight - visibleLeft) * frac)
bullRight := math.max(visibleLeft, math.min(visibleRight, bullRight))
if bullPct > 0 and bullRight > visibleLeft
array ptsTopBull = array.new()
ptsTopBull.unshift(chart.point.from_index(bullRight + widthX, yT + depthY))
ptsTopBull.unshift(chart.point.from_index(visibleLeft + widthX, yT + depthY))
ptsTopBull.unshift(chart.point.from_index(visibleLeft, yT))
ptsTopBull.unshift(chart.point.from_index(bullRight, yT))
ptsTopBull.unshift(chart.point.from_index(bullRight + widthX, yT + depthY))
drawPoly(PolyParams.new(ptsTopBull, color.new(chart.fg_color, 90), color.new(bullCol, 70), 1))
if bullPct < 100 and visibleRight > bullRight
array ptsTopBear = array.new()
ptsTopBear.unshift(chart.point.from_index(visibleRight + widthX, yT + depthY))
ptsTopBear.unshift(chart.point.from_index(bullRight + widthX, yT + depthY))
ptsTopBear.unshift(chart.point.from_index(bullRight, yT))
ptsTopBear.unshift(chart.point.from_index(visibleRight, yT))
ptsTopBear.unshift(chart.point.from_index(visibleRight + widthX, yT + depthY))
drawPoly(PolyParams.new(ptsTopBear, color.new(chart.fg_color, 90), color.new(bearCol, 70), 1))
// Draws a full OB: zone, retest label, volume fill and 3D faces.
drawZoneAndVolume(ObRec ob) =>
= obColors(ob)
drawObZoneBox(ob, faded)
if showVD and ob.hasDelta
= obGeom(ob)
= deltaTexts(ob.bullPct, ob.bearPct)
drawTotalVolLabel(xL, xR, yT, yB, h, ob.totalVol)
drawDeltaFills(xL, xR, yT, yB, h, ob.bullPct, bullTxt, bearTxt)
if vd3D
drawDelta3D(xL, xR, widthX, xR2, yT, yB, h, ob.bullPct)
true
// Clear all previous drawings each bar before re-rendering current selection.
allBoxes.clearAll(allPolys, allLabels)
// Pick active and invalid OBs based on hideInvalid + showNearestX.
array bullActive = array.new_int()
array bearActive = array.new_int()
array bullInvalid = array.new_int()
array bearInvalid = array.new_int()
if hideInvalid
bullActive := pickNearest(obs, true, showNearestX, false)
bearActive := pickNearest(obs, false, showNearestX, false)
else
bullActive := pickNearest(obs, true, showNearestX, false)
bearActive := pickNearest(obs, false, showNearestX, false)
if obs.size() > 0
for i = 0 to obs.size() - 1
ObRec o = obs.get(i)
if not o.active
if o.isBull
bullInvalid.push(i)
else
bearInvalid.push(i)
if bearInvalid.size() > 0 and not hideInvalid
for i = 0 to bearInvalid.size() - 1
ObRec ob = obs.get(bearInvalid.get(i))
drawZoneAndVolume(ob)
if bearActive.size() > 0
for i = 0 to bearActive.size() - 1
ObRec ob = obs.get(bearActive.get(i))
drawZoneAndVolume(ob)
if bullInvalid.size() > 0 and not hideInvalid
for i = 0 to bullInvalid.size() - 1
ObRec ob = obs.get(bullInvalid.get(i))
drawZoneAndVolume(ob)
if bullActive.size() > 0
for i = 0 to bullActive.size() - 1
ObRec ob = obs.get(bullActive.get(i))
drawZoneAndVolume(ob)
// Draw all stored retest events on top of zones
drawRetestLabels(bullActive, bearActive, bullInvalid, bearInvalid)
//#endregion
//#region ALERTS
alertcondition(alBullOB and evNewBullOB, "Bullish Order Block", "New Bullish Order Block detected.")
alertcondition(alBearOB and evNewBearOB, "Bearish Order Block", "Bearish Order Block detected.")
alertcondition(alBullRetest and evBullRetest, "Bullish OB Retest", "Bullish Order Block retest.")
alertcondition(alBearRetest and evBearRetest, "Bearish OB Retest", "Bearish Order Block retest.")
if alBullOB and evNewBullOB
alert("Bullish Order Block detected.", alert.freq_once_per_bar)
if alBearOB and evNewBearOB
alert("Bearish Order Block detected.", alert.freq_once_per_bar)
if alBullRetest and evBullRetest
alert("Bullish Order Block retest.", alert.freq_once_per_bar)
if alBearRetest and evBearRetest
alert("Bearish Order Block retest.", alert.freq_once_per_bar)
// ==========================================================================================
// === Dashboard with Telegram Link ===
var table myTable = table.new(position.top_center, 1, 1, border_width=1, frame_color=color.black, bgcolor=color.white)
// Add Telegram Message to Dashboard
table.cell(myTable, 0, 0, "Join Telegram @STRATEGY INDIBOT", bgcolor=color.blue, text_color=color.white, text_size=size.normal)
ChannellerChanneller Pro - Multi-Pivot Regression Channels with Trend Validation
What This Indicator Does
Channeller Pro automatically detects and draws price channels by connecting multiple pivot points using linear regression rather than simply connecting two points. The indicator displays parallel support and resistance lines that define the current trend channel, along with an optional mid-line for mean reversion analysis.
Channels automatically appear when valid trend conditions are met and disappear when the trend structure breaks, keeping your chart clean and showing only actionable information.
---
How It Works (Methodology)
1. Multi-Pivot Linear Regression
Unlike simple channel indicators that connect only 2 pivot points, this indicator collects 3-5 pivot lows (for bullish channels) or pivot highs (for bearish channels) and calculates a least-squares linear regression line through them. This produces a statistically best-fit trendline that is more resistant to noise from a single errant pivot.
The regression calculation outputs:
- Slope: The angle/direction of the trend
- Intercept: The starting price level
- R² (coefficient of determination): A value from 0 to 1 measuring how well the pivot points align. Higher R² means the pivots form a cleaner, more reliable trendline. The default minimum is 0.70.
2. Higher-Low / Lower-High Pattern Validation
For a bullish channel to form, the indicator requires each successive pivot low to be higher than the previous pivot low (the definition of an uptrend). For bearish channels, each pivot high must be lower than the previous (downtrend structure). This filter prevents channels from forming during choppy, non-trending conditions.
3. ADX Trend Strength Filter
The indicator calculates the Average Directional Index (ADX) to measure trend strength. Channels only appear when ADX exceeds a user-defined threshold (default: 20). When ADX drops below this level, indicating the trend has weakened, channels automatically disappear. This prevents false channels during sideways/ranging markets.
4. Channel Width Calculation
Once the regression support line is established, the indicator finds the highest high (for bull channels) or lowest low (for bear channels) between the first and last pivot. A parallel line is drawn at this distance to form the opposite channel boundary.
5. Channel Respect Monitoring
The indicator tracks how price interacts with channel boundaries:
- Bounces: Price touches the boundary and reverses
- Pierces: Price closes beyond the boundary
If price pierces through a channel boundary multiple times, the channel is invalidated and removed, signaling the trend structure has broken.
---
How to Use This Indicator
Identifying Trends
- A green channel (bullish) indicates an uptrend with higher lows
- A red channel (bearish) indicates a downtrend with lower highs
- The R² value in the label shows channel quality (higher = more reliable)
Trading Applications
- Trend Following: Trade in the direction of the channel slope
- Support/Resistance: Use channel boundaries as potential reaction zones
- Mean Reversion: The optional mid-line (dashed) can serve as a target for pullback entries
- Breakout Preparation: When a channel disappears, it signals the prior trend structure has ended
Reading the Labels
- "BULL R²:0.85 (4 pivots)" means a bullish channel with 85% regression fit using 4 pivot points
- Orange-colored labels indicate weaker channels (R² between 0.70-0.85)
- Green/red labels indicate stronger channels (R² above 0.85)
---
Input Settings Explained
| Setting | Description |
|---------|-------------|
| Pivot Lookback Left/Right | Bars required on each side to confirm a pivot high/low |
| Min Pivots for Channel | Minimum pivot points required (more = stricter) |
| Max Pivots to Track | Maximum pivots stored (older pivots are dropped) |
| Min R² Score | Minimum regression quality (0.70 = 70% fit) |
| ADX Threshold | Minimum ADX value to show channels (20 = moderate trend) |
| Require HL/LH Pattern | Enforce higher-lows for bull, lower-highs for bear |
---
What Makes This Different
This indicator combines multiple validation layers that work together:
1. Regression vs. 2-point lines: More statistically robust trendlines
2. R² quality scoring: Quantifies how clean the trend structure is
3. Pattern validation: Ensures proper trend structure (HL/LH)
4. ADX filtering: Confirms trend exists before drawing channels
5. Auto-invalidation: Channels disappear when broken, not manually
These components create a self-cleaning channel system that only displays high-probability trend channels.
---
Alerts Available
- Bull/Bear Channel Formed
- Bull/Bear Channel Broken
- New Pivot High/Low Detected
SWING ATR BasedWhat does this indicator do?
1. It identifies Market Swings The script monitors price action to detect when a trend changes direction.
It uses ATR (Average True Range) to measure volatility, ensuring it doesn't get tricked by small, insignificant price movements.
To validate a change in direction (from bullish to bearish, or vice versa), it waits for the price to cover a specific distance (defined by the kRange parameter) and requires at least two significant candles.
2. It plots Support and Resistance zones As soon as a new high or low point is confirmed:
In Green (Bull): It draws a support line at the level of the last low.
In Red (Bear): It draws a resistance line at the level of the last high.
Auto-Cleaning: If the price breaks through a support line, the line turns gray and stops. The script only keeps active (unbroken) levels on the screen.
3. It calculates an "SGE Score" (Market State) This is the "brain" of the script. It assigns a rating to the current trend:
+2 (Bullish): The price has broken a resistance.
-2 (Bearish): The price has broken a support.
0 (Neutral): The market is indecisive (for example, after a break that contradicts the previous one).
Key Feature: This score has a "one-candle delay." It waits for the next candle to close before confirming a score change, which helps avoid reacting too quickly to false alerts.
4. It simplifies visual reading To keep your chart clean and readable:
It only highlights the 3 levels closest to the current price (those most likely to be hit soon).
It colors the chart candles directly: Green if the score is +2, Red if the score is -2, and Gray if it is neutral.
5. Dashboard In the top-right corner of your screen, it displays a permanent summary:
The current score (-2, 0, or 2).
The number of active supports and resistances.
Summary: This is a "smart" trend detector. Instead of just looking at whether the price is going up or down, it waits for the price to break important structural levels (confirmed by volatility) to tell you: "Caution, the structure has just shifted from bullish to bearish."
Recommended Settings:
kRange: 1.3 / 1.4
ATR Mult: 0.3 to 0.5
Script created with Claude AI.
HTB Reversal Pattern - RSI DivergenceHow this Script Works
Pivot Points: The script looks for "peaks" and "valleys" in the RSI indicator.
Divergence Logic: * Bullish: If the current price low is lower than the previous low, but the RSI low is higher than the previous RSI low, it indicates the selling pressure is fading despite the price drop.
Bearish: If the current price high is higher than the previous high, but the RSI high is lower than the previous RSI high, it suggests buying momentum is weakening.
The "Lookback" Offset: Because pivot points require a few bars to the right to be confirmed (defined by lbR), the labels will appear on the chart with a small delay (default is 5 bars). This is necessary to prevent "repainting" (signals that disappear after they appear).


