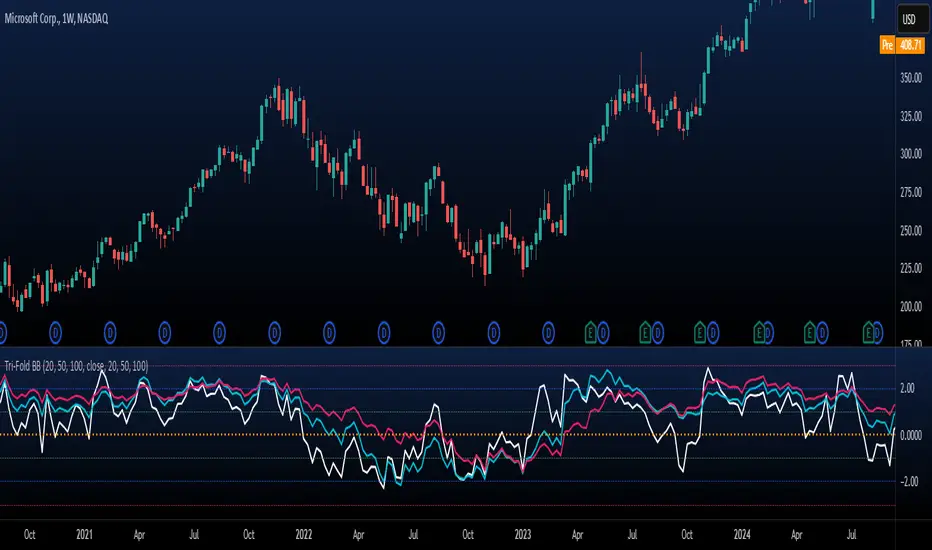
CRR Auto 50% Candle A line at 50% of the candle
If a candle is larger than the minimum size you define (minSizePerc),
then calculate the midpoint of the candle (midLevel) and draw a horizontal line:
From the current candle to 44 bars to the right (or the number you choose).
Green if the candle is bullish, red if it is bearish.
2. Signal arrows
If it's a large bullish candle → green arrow pointing up with the text “50”.
If it's a large bearish candle → red arrow pointing down with the text “50”.
3. What is it for?
It marks the 50% level of important candles, which is often:
A mitigation zone.
A level where the price usually returns before continuing.
An institutional equilibrium point.
🧠 In simple terms:
It detects strong candles, draws their 50% level into the future, and marks them with arrows indicating whether they are bullish or bearish. Ideal for SMC.
חפש סקריפטים עבור "bear"
CRR Nemesis Fear & Greed ProIt measures 4 market indicators:
ATR → volatility.
Relative Volume (rVOL) → whether there is more or less volume than average.
Price distance from the moving average (SMA 50) in ATR → how much the trend has extended.
Candlestick shape → size of the body and wicks (who is dominating, bulls or bears).
It calculates two scores (0–100):
Greed → when:
The candlestick is bullish,
The price is above the SMA 50 (uptrend),
There is a good body, good rVOL, the price is far from the average, high volatility,
A longer upper wick adds a little more.
Fear → when:
The candlestick is bearish,
The price is below the SMA 50 (downtrend),
Similarly: strong body, rVOL, distance from the average, volatility,
A longer lower wick adds a little more.
Both scores are smoothed with a 3-period EMA (greedSmoothed and fearSmoothed).
It determines the overall market sentiment (HUD):
ANGEL (greed dominates):
Greed ≥ 55 and Greed − Fear ≥ 10.
DEVIL (fear dominates):
Fear ≥ 55 and Fear − Greed ≥ 10.
If neither condition is met → NEUTRAL.
HUD on screen (table in the upper right corner):
Displays:
STATUS: ANGEL / DEVIL / NEUTRAL (with color).
FEAR: smoothed fear value.
GREED: smoothed greed value.
🧠 In simple terms:
It's a market sentiment engine: it combines volume, ATR, distance from the trend, and candlestick shape to tell you if the market is experiencing strong fear, strong greed, or is neutral, and displays it clearly in a HUD.
CRR Birgua HUD (HH-HL / LL-LH)CRR Birgua HUD (HH-HL / LL-LH) essentially does three things:
Detects price structure using pivots.
Marks highs as:
HH = Higher High
LH = Lower High
Marks lows as:
HL = Higher Low
LL = Lower Low
It uses a pivot length (pivotLen, default 3) to find these turning points.
Measures the “Birgua” (impulse correction).
In a downtrend:
When an LH appears, it measures how much the retracement rose from the last low to that LH.
In an uptrend:
When an HL appears, it measures how much the retracement fell from the last high to that HL.
It calculates two things:
% correction (birgua_lastPct)
ATR multiples (birgua_lastAtrMult)
It only considers it “valid” if:
% correction ≥ birgua_minBirguaPc (e.g., 25%)
ATR multiple ≥ birgua_minAtrMult (e.g., 0.5)
If valid: it labels it with OK; otherwise: SMALL.
Creates a HUD and a “Birgua Score.”
Calculates a Birgua Score (0–100):
Starts at 50.
If the last Birgua was at an HL (strong bullish), it increases from 50.
If it was at an LH (strong bearish), it decreases from 50.
It can draw a line at the bottom with this score if you enable Show Birgua Score.
At the top of the screen, it displays a HUD with:
Direction: BULL (HL), BEAR (LH), or NEUTRAL.
B: XX.X% (Birgua percentage).
ATR: X.XX (ATR multiples).
Strength: Strong / Weak / N/A based on the minimums you defined.
🧠 Quick Use:
HL + strong Birgua → probable bullish continuation.
LH + strong Birgua → probable bearish continuation.
The HUD summarizes whether the last correction was strong or weak and on which side (bull or bear).
Volatility Risk PremiumTHE INSURANCE PREMIUM OF THE STOCK MARKET
Every day, millions of investors face a fundamental question that has puzzled economists for decades: how much should protection against market crashes cost? The answer lies in a phenomenon called the Volatility Risk Premium, and understanding it may fundamentally change how you interpret market conditions.
Think of the stock market like a neighborhood where homeowners buy insurance against fire. The insurance company charges premiums based on their estimates of fire risk. But here is the interesting part: insurance companies systematically charge more than the actual expected losses. This difference between what people pay and what actually happens is the insurance premium. The same principle operates in financial markets, but instead of fire insurance, investors buy protection against market volatility through options contracts.
The Volatility Risk Premium, or VRP, measures exactly this difference. It represents the gap between what the market expects volatility to be (implied volatility, as reflected in options prices) and what volatility actually turns out to be (realized volatility, calculated from actual price movements). This indicator quantifies that gap and transforms it into actionable intelligence.
THE FOUNDATION
The academic study of volatility risk premiums began gaining serious traction in the early 2000s, though the phenomenon itself had been observed by practitioners for much longer. Three research papers form the backbone of this indicator's methodology.
Peter Carr and Liuren Wu published their seminal work "Variance Risk Premiums" in the Review of Financial Studies in 2009. Their research established that variance risk premiums exist across virtually all asset classes and persist over time. They documented that on average, implied volatility exceeds realized volatility by approximately three to four percentage points annualized. This is not a small number. It means that sellers of volatility insurance have historically collected a substantial premium for bearing this risk.
Tim Bollerslev, George Tauchen, and Hao Zhou extended this research in their 2009 paper "Expected Stock Returns and Variance Risk Premia," also published in the Review of Financial Studies. Their critical contribution was demonstrating that the VRP is a statistically significant predictor of future equity returns. When the VRP is high, meaning investors are paying substantial premiums for protection, future stock returns tend to be positive. When the VRP collapses or turns negative, it often signals that realized volatility has spiked above expectations, typically during market stress periods.
Gurdip Bakshi and Nikunj Kapadia provided additional theoretical grounding in their 2003 paper "Delta-Hedged Gains and the Negative Market Volatility Risk Premium." They demonstrated through careful empirical analysis why volatility sellers are compensated: the risk is not diversifiable and tends to materialize precisely when investors can least afford losses.
HOW THE INDICATOR CALCULATES VOLATILITY
The calculation begins with two separate measurements that must be compared: implied volatility and realized volatility.
For implied volatility, the indicator uses the CBOE Volatility Index, commonly known as the VIX. The VIX represents the market's expectation of 30-day forward volatility on the S&P 500, calculated from a weighted average of out-of-the-money put and call options. It is often called the "fear gauge" because it rises when investors rush to buy protective options.
Realized volatility requires more careful consideration. The indicator offers three distinct calculation methods, each with specific advantages rooted in academic literature.
The Close-to-Close method is the most straightforward approach. It calculates the standard deviation of logarithmic daily returns over a specified lookback period, then annualizes this figure by multiplying by the square root of 252, the approximate number of trading days in a year. This method is intuitive and widely used, but it only captures information from closing prices and ignores intraday price movements.
The Parkinson estimator, developed by Michael Parkinson in 1980, improves efficiency by incorporating high and low prices. The mathematical formula calculates variance as the sum of squared log ratios of daily highs to lows, divided by four times the natural logarithm of two, times the number of observations. This estimator is theoretically about five times more efficient than the close-to-close method because high and low prices contain additional information about the volatility process.
The Garman-Klass estimator, published by Mark Garman and Michael Klass in 1980, goes further by incorporating opening, high, low, and closing prices. The formula combines half the squared log ratio of high to low prices minus a factor involving the log ratio of close to open. This method achieves the minimum variance among estimators using only these four price points, making it particularly valuable for markets where intraday information is meaningful.
THE CORE VRP CALCULATION
Once both volatility measures are obtained, the VRP calculation is straightforward: subtract realized volatility from implied volatility. A positive result means the market is paying a premium for volatility insurance. A negative result means realized volatility has exceeded expectations, typically indicating market stress.
The raw VRP signal receives slight smoothing through an exponential moving average to reduce noise while preserving responsiveness. The default smoothing period of five days balances signal clarity against lag.
INTERPRETING THE REGIMES
The indicator classifies market conditions into five distinct regimes based on VRP levels.
The EXTREME regime occurs when VRP exceeds ten percentage points. This represents an unusual situation where the gap between implied and realized volatility is historically wide. Markets are pricing in significantly more fear than is materializing. Research suggests this often precedes positive equity returns as the premium normalizes.
The HIGH regime, between five and ten percentage points, indicates elevated risk aversion. Investors are paying above-average premiums for protection. This often occurs after market corrections when fear remains elevated but realized volatility has begun subsiding.
The NORMAL regime covers VRP between zero and five percentage points. This represents the long-term average state of markets where implied volatility modestly exceeds realized volatility. The insurance premium is being collected at typical rates.
The LOW regime, between negative two and zero percentage points, suggests either unusual complacency or that realized volatility is catching up to implied volatility. The premium is shrinking, which can precede either calm continuation or increased stress.
The NEGATIVE regime occurs when realized volatility exceeds implied volatility. This is relatively rare and typically indicates active market stress. Options were priced for less volatility than actually occurred, meaning volatility sellers are experiencing losses. Historically, deeply negative VRP readings have often coincided with market bottoms, though timing the reversal remains challenging.
TERM STRUCTURE ANALYSIS
Beyond the basic VRP calculation, sophisticated market participants analyze how volatility behaves across different time horizons. The indicator calculates VRP using both short-term (default ten days) and long-term (default sixty days) realized volatility windows.
Under normal market conditions, short-term realized volatility tends to be lower than long-term realized volatility. This produces what traders call contango in the term structure, analogous to futures markets where later delivery dates trade at premiums. The RV Slope metric quantifies this relationship.
When markets enter stress periods, the term structure often inverts. Short-term realized volatility spikes above long-term realized volatility as markets experience immediate turmoil. This backwardation condition serves as an early warning signal that current volatility is elevated relative to historical norms.
The academic foundation for term structure analysis comes from Scott Mixon's 2007 paper "The Implied Volatility Term Structure" in the Journal of Derivatives, which documented the predictive power of term structure dynamics.
MEAN REVERSION CHARACTERISTICS
One of the most practically useful properties of the VRP is its tendency to mean-revert. Extreme readings, whether high or low, tend to normalize over time. This creates opportunities for systematic trading strategies.
The indicator tracks VRP in statistical terms by calculating its Z-score relative to the trailing one-year distribution. A Z-score above two indicates that current VRP is more than two standard deviations above its mean, a statistically unusual condition. Similarly, a Z-score below negative two indicates VRP is unusually low.
Mean reversion signals trigger when VRP reaches extreme Z-score levels and then shows initial signs of reversal. A buy signal occurs when VRP recovers from oversold conditions (Z-score below negative two and rising), suggesting that the period of elevated realized volatility may be ending. A sell signal occurs when VRP contracts from overbought conditions (Z-score above two and falling), suggesting the fear premium may be excessive and due for normalization.
These signals should not be interpreted as standalone trading recommendations. They indicate probabilistic conditions based on historical patterns. Market context and other factors always matter.
MOMENTUM ANALYSIS
The rate of change in VRP carries its own information content. Rapidly rising VRP suggests fear is building faster than volatility is materializing, often seen in the early stages of corrections before realized volatility catches up. Rapidly falling VRP indicates either calming conditions or rising realized volatility eating into the premium.
The indicator tracks VRP momentum as the difference between current VRP and VRP from a specified number of bars ago. Positive momentum with positive acceleration suggests strengthening risk aversion. Negative momentum with negative acceleration suggests intensifying stress or rapid normalization from elevated levels.
PRACTICAL APPLICATION
For equity investors, the VRP provides context for risk management decisions. High VRP environments historically favor equity exposure because the market is pricing in more pessimism than typically materializes. Low or negative VRP environments suggest either reducing exposure or hedging, as markets may be underpricing risk.
For options traders, understanding VRP is fundamental to strategy selection. Strategies that sell volatility, such as covered calls, cash-secured puts, or iron condors, tend to profit when VRP is elevated and compress toward its mean. Strategies that buy volatility tend to profit when VRP is low and risk materializes.
For systematic traders, VRP provides a regime filter for other strategies. Momentum strategies may benefit from different parameters in high versus low VRP environments. Mean reversion strategies in VRP itself can form the basis of a complete trading system.
LIMITATIONS AND CONSIDERATIONS
No indicator provides perfect foresight, and the VRP is no exception. Several limitations deserve attention.
The VRP measures a relationship between two estimates, each subject to measurement error. The VIX represents expectations that may prove incorrect. Realized volatility calculations depend on the chosen method and lookback period.
Mean reversion tendencies hold over longer time horizons but provide limited guidance for short-term timing. VRP can remain extreme for extended periods, and mean reversion signals can generate losses if the extremity persists or intensifies.
The indicator is calibrated for equity markets, specifically the S&P 500. Application to other asset classes requires recalibration of thresholds and potentially different data sources.
Historical relationships between VRP and subsequent returns, while statistically robust, do not guarantee future performance. Structural changes in markets, options pricing, or investor behavior could alter these dynamics.
STATISTICAL OUTPUTS
The indicator presents comprehensive statistics including current VRP level, implied volatility from VIX, realized volatility from the selected method, current regime classification, number of bars in the current regime, percentile ranking over the lookback period, Z-score relative to recent history, mean VRP over the lookback period, realized volatility term structure slope, VRP momentum, mean reversion signal status, and overall market bias interpretation.
Color coding throughout the indicator provides immediate visual interpretation. Green tones indicate elevated VRP associated with fear and potential opportunity. Red tones indicate compressed or negative VRP associated with complacency or active stress. Neutral tones indicate normal market conditions.
ALERT CONDITIONS
The indicator provides alerts for regime transitions, extreme statistical readings, term structure inversions, mean reversion signals, and momentum shifts. These can be configured through the TradingView alert system for real-time monitoring across multiple timeframes.
REFERENCES
Bakshi, G., and Kapadia, N. (2003). Delta-Hedged Gains and the Negative Market Volatility Risk Premium. Review of Financial Studies, 16(2), 527-566.
Bollerslev, T., Tauchen, G., and Zhou, H. (2009). Expected Stock Returns and Variance Risk Premia. Review of Financial Studies, 22(11), 4463-4492.
Carr, P., and Wu, L. (2009). Variance Risk Premiums. Review of Financial Studies, 22(3), 1311-1341.
Garman, M. B., and Klass, M. J. (1980). On the Estimation of Security Price Volatilities from Historical Data. Journal of Business, 53(1), 67-78.
Mixon, S. (2007). The Implied Volatility Term Structure of Stock Index Options. Journal of Empirical Finance, 14(3), 333-354.
Parkinson, M. (1980). The Extreme Value Method for Estimating the Variance of the Rate of Return. Journal of Business, 53(1), 61-65.
🟡 GOLD 4H HUD v12 — Time-Safe Nuclear Edition🟡 GOLD 4H HUD v12 — Time-Safe Nuclear Edition
A full–scale Smart Money Concepts (SMC) analytics engine designed exclusively for XAUUSD on the 4-Hour timeframe.
This script combines market structure, liquidity, displacement, order blocks, imbalance, volume profile, SMT divergence, and institutional behavior modeling into a single unified HUD.
Built with a time-safe architecture, all structural elements (OB/FVG/Sweep) are stored by timestamp to minimize repainting and preserve event integrity.
📌 Core Features (12 Modules + Full HUD)
1 — Market Structure Engine
Automatically detects:
HH / HL / LH / LL
BOS (Break of Structure)
MSS (Market Structure Shift)
CHOCH (Change of Character)
Real swing pivots & trend state
2 — Sweep Engine (Liquidity Grab Detection)
Identifies institutional liquidity grabs:
Break + reclaim of highs/lows
ATR-filtered invalidation
Displacement-backed sweeps
3 — Time-Safe FVG Engine
Detects Bullish/Bearish Fair Value Gaps
ATR-tolerant FVG logic
Automatic right-extension
Auto-delete when filled or invalid
4 — Time-Safe Order Block Engine
Demand & Supply OB detection
Strength classification (Weak vs Strong)
FVG-overlap confirmation
Timestamp-locked (non-repainting)
5 — Volume Profile Engine (HVN / LVN / POC)
Real-time micro-profile:
High Volume Node (HVN)
Low Volume Node (LVN)
Point of Control (POC)
6 — SMT Engine (Gold vs DXY Divergence)
Smart Money Divergence built-in:
Bullish SMT
Bearish SMT
Directional confirmation with zero lag
7 — Displacement Engine
Measures institutional impulse:
Body-based impulse detection
Multi-leg continuation signals
FVG continuation moves
Generates displacement score
8 — Premium / Discount Model
Auto-classifies price into:
Discount (Buy zone)
Premium (Sell zone)
9 — SMC Trend Engine (Score-Based)
Combines 10+ factors:
Structure
FVG
OB power
Displacement
POC positioning
SMT conditions
Outputs:
BULL / BEAR / RANGE
Full scoring system
10 — Institutional Imbalance Model (IMB Engine)
Combines:
PD zones
Sweep direction
Displacement
SMT
OB strength
CHOCH/MSS
A complete institutional bias filter.
11 — Entry Engine (Signal Fusion Model)
Entry conditions fuse:
Sweep
CHOCH
Displacement
OB strength
FVG alignment
SMT confirmation
Also outputs:
Suggested SL/TP
Entry score
12 — Trendline Engine
Auto-draws:
HL → HL bullish trendlines
LH → LH bearish trendlines
+ Full Nuclear HUD
Displays:
Market structure
Trend direction
SMT / CHOCH / MSS
FVG / OB zones
HVN / LVN / POC
Liquidity strength
Entry model
Liquidity Magnet direction
SL/TP map
A complete institutional dashboard in one place.
⚠ Usage Requirement
This script is designed ONLY for the 4H timeframe.
✨ Summary
GOLD 4H HUD v12 — Time-Safe Nuclear Edition
is not just an indicator.
It is a full institutional-grade SMC analysis system, built specifically for Gold.
If you trade XAUUSD on the 4H timeframe —
this is your complete market intelligence HUD
Execution Heatmap v8 — Classic Blocks (Final Logic)This indicator visualizes real-time market context through a structured execution heatmap, representing multiple analytic dimensions in a compact on-chart panel. Designed for traders who rely on confluence-based decision making, it tracks the shifting behavior of price, volume, and structural regimes to help identify momentum shifts, exhaustion points, and directional conviction.
🔶 Overview
The Execution Heatmap v8 consolidates key elements from trend, volume, and momentum analysis into a single panel. Each row represents a core component of the execution model, colored dynamically to reflect bullish, bearish, neutral, or mixed states. The final block produces a BUY, SELL, or SELL-ALERT classification — fully aligned with the internal logic of the GOLDMASTER‑HUD framework.
🔸 Core Logic Components
VWAP Direction: Detects price bias relative to VWAP (overextended, below value, or neutral).
Impulse Engine: Evaluates momentum using RSI and MFI thresholds to determine directional energy.
Volume Surge: Highlights aggressive volume imbalances and determines the dominant side (bull or bear).
Fake Break Detection: Identifies false breakouts at recent swing extremes to flag potential reversals.
Regime Filter: Measures underlying trend structure using dual‑EMA alignment (20/50 EMA).
Pattern Recognition: Detects emerging HL (higher low) or LH (lower high) structures.
Structure Strength: Maps strong vs. weak structural phases based on regime and pattern alignment.
Final Signal Engine: Synthesizes all modules into actionable classifications:
BUY: Price structure supports trend continuation.
SELL‑ALERT: Early weakness or exhaustion detected within a strong up‑trend.
SELL: Confirmed reversal alignment (momentum, VWAP, volume, and structure all bearish).
WAIT: Caution when conditions remain inconclusive.
🟩🟥 Color‑Coded Heat Blocks
Each metric is represented as a colored cell:
Green: Bullish / upward bias
Red: Bearish / downward bias
Yellow: Neutral / weak / mixed
Dark gray: Undefined or transitional
⚙️ Customization
Adjustable panel position (bottom‑right, bottom‑left, top‑right, top‑left).
Non‑intrusive table layout optimized for overlaying on active charts.
Lightweight execution with minimal resource load, ideal for intraday use.
Volume Flow Anatomy [Kodexius]Volume Flow Anatomy is a dynamic, multi-dimensional volume map that reconstructs how buy, sell, and “stealth” activity is distributed across price rather than just across time. Instead of relying on a static, session-based volume profile, it uses an exponentially decaying memory of recent bars to build a constantly evolving “anatomy” of the auction, where each price level carries an adaptive history of order flow.
The script separates buy vs. sell pressure, adds a third “Stealth Flow” dimension for low-volume price movement (ease of movement / divergence), and automatically derives POC, Value Area, imbalances, absorption zones, and classic profile shapes (D, P, b, B). This gives the trader a compact but highly information-dense map on the right side of the chart to read control (buyers vs. sellers), structure (balanced vs. trending vs. double distribution), and key reaction levels (support/resistance born from flow, not just wicks).
🔹 Features
🔸 Dynamic Lookback with Decay
- The script computes an effective lookback N from the Decay Factor and caps it with Max Lookback.
- Higher decay keeps more history; lower decay emphasizes the most recent flow.
- The profile continuously adapts as new bars are printed.
🔸 Price-Bucketed Flow Map
Each bucket accumulates:
- Sell Flow (sell pressure)
- Buy Flow (buy pressure)
- Stealth Flow (low-volume price movement)
- Box width at each bucket is proportional to the relative intensity of that component.
🔸 Stealth Flow (Low-Volume Price Movement)
- Measures close to close movement relative to volume, emphasizing price movement that occurs on comparatively low volume.
- Helps reveal hidden participation, inefficient moves, and areas that may be vulnerable to re-tests or reversions.
🔸 POC & 70% Value Area (VA)
- Identifies the Point of Control (price bucket with the highest total volume) over the effective lookback.
- Builds a 70% Value Area by expanding from POC towards the nearest high volume neighbors until 70% of the total volume is included.
- POC is drawn as a line over the analyzed range; VA is displayed as a shaded band in the profile area.
🔸 Market Profile Shape Detection
Splits the profile vertically into three zones (bottom / middle / top) and compares their volume distribution.
Classifies structure as:
- D-Shape (Balanced)
- P-Shape (Short Covering)
- b-Shape (Long Liquidation)
- B-Shape (Double Distribution)
Displays a shape label with color coded bias for quick auction context interpretation.
🔸 Imbalance Zones & Absorption
Imbalance: detects buckets where Buy Flow or Sell Flow exceeds the opposite side by at least Imbalance Ratio.
Absorption: flags zones with high volume but low price “ease”, where price is not moving much despite significant volume.
Extends these levels into horizontal zones, marking potential support/resistance and trap areas.
Bullish Imbalance Zone :
Bearish Imbalance Zone :
Absorption Zone :
🔸 Range Context & On-Chart Legend
Draws a Range Box covering the dynamically determined lookback (N bars), with a label displaying the effective bar count.
A bottom-right legend summarizes:
- Color keys for Buy / Sell / Stealth
- POC / VA status
- Bullish vs. Bearish dominance percentage
- Profile shape classification
- Imbalance and Absorption conventions
🔹 Calculations
1. Dynamic Lookback & Price Buckets
int N = math.min(int(4 / (1 - decayFactor) - 1), maxHistory)
float priceHigh = ta.highest(high, N)
float priceLow = ta.lowest(low, N)
float bucketSize = (priceHigh - priceLow) / bucketCount
The effective lookback N is derived from the Decay Factor, using the approximation 4 / (1 - decay) to capture roughly 99% of the decayed influence, then capped with maxHistory to control performance. Over that adaptive range, the script finds the highest and lowest prices and divides the band into bucketCount equal slices (bucketSize). Each slice is a price bucket that will accumulate volume-flow information.
2. Exponentially Decayed Volume Allocation
addValue(array profile, float weight, float minPrice, float maxPrice) =>
for j = 0 to bucketCount - 1
float bucketMin = priceLow + j * bucketSize
float bucketMax = bucketMin + bucketSize
float overlapMin = math.max(minPrice, bucketMin)
float overlapMax = math.min(maxPrice, bucketMax)
float overlapRange = overlapMax - overlapMin
if overlapRange > 0
profile.set(j, profile.get(j) * decayFactor + weight * overlapRange)
This function is the core engine of the indicator. For a given price span and intensity, it checks every bucket for overlap, distributes the weight proportionally to the overlapping range, and before adding new value, decays the existing bucket content by decayFactor. This results in an exponentially weighted profile: recent activity dominates, while older levels retain a gradually fading footprint.
3. POC and 70% Value Area
array totalProfile = array.new(bucketCount, 0)
for j = 0 to bucketCount - 1
float total = sellProfile.get(j) + buyProfile.get(j)
totalProfile.set(j, total)
if total > eaMax
eaMax := total
int pocIdx = 0
float pocVal = 0.0
for j = 0 to bucketCount - 1
if totalProfile.get(j) > pocVal
pocVal := totalProfile.get(j)
pocIdx := j
float totalSum = totalProfile.sum()
float targetSum = totalSum * 0.70
int vaLow = pocIdx
int vaHigh = pocIdx
float currentSum = pocVal
while currentSum < targetSum and (vaLow > 0 or vaHigh < bucketCount - 1)
float lowVal = vaLow > 0 ? totalProfile.get(vaLow - 1) : 0.0
float highVal = vaHigh < bucketCount - 1 ? totalProfile.get(vaHigh + 1) : 0.0
First, totalProfile is built as the sum of buy and sell flow per bucket, and eaMax (the maximum total) is tracked for later normalization. The POC bucket (pocIdx) is simply the index with the highest totalProfile value.
To compute the 70% Value Area, the algorithm starts at the POC bucket and expands outward, each step adding either the upper or lower neighbor depending on which has more volume. This continues until the cumulative volume reaches 70% of totalSum. The result is a volume-driven VA, not necessarily symmetric around POC, which more accurately represents where the market has truly traded.
4. Market Profile Shape Classification
float volTopThird = 0.0
float volMidThird = 0.0
float volBotThird = 0.0
int thirdIdx = int(bucketCount / 3)
for j = 0 to bucketCount - 1
float val = totalProfile.get(j)
if j < thirdIdx
volBotThird += val
else if j < thirdIdx * 2
volMidThird += val
else
volTopThird += val
float totalVolShape = totalProfile.sum()
string shapeStr = "D-Shape (Balanced)"
if (volTopThird > totalVolShape * 0.20) and (volBotThird > totalVolShape * 0.20) and (volMidThird < totalVolShape * 0.50)
shapeStr := "B-Shape (Double Dist)"
else
if pocIdx > bucketCount * 0.5 and volTopThird > volBotThird * 1.3
shapeStr := "P-Shape (Short Covering)"
else if pocIdx < bucketCount * 0.5 and volBotThird > volTopThird * 1.3
shapeStr := "b-Shape (Long Liquidation)"
else
shapeStr := "D-Shape (Balanced)"
The profile is split into bottom, middle, and top thirds. The script compares how much volume is concentrated in each and combines that with the relative location of POC. If both extremes are heavy and the middle light, it labels a B-Shape (double distribution). If the POC is high and the top dominates the bottom, it’s a P-Shape (short covering). If the POC is low and the bottom dominates, it’s a b-Shape (long liquidation). Otherwise, it defaults to a D-Shape (balanced). This provides a quick, at-a-glance assessment of auction structure.
5. Imbalances, Absorption & Zones
bool isBuyImb = showImb and sVal > 0 and (bVal / sVal >= imbRatio)
bool isSellImb = showImb and bVal > 0 and (sVal / bVal >= imbRatio)
float volRatio = eaMax > 0 ? tVal / eaMax : 0
float stRatio = esmRange > 0 ? (stVal - esmMin) / esmRange : 1.0
bool isAbsorp = showAbsorp and volRatio > 0.6 and stRatio < 0.25
if showImbZone
if isSellImb
zoneBoxes.push(box.new(bar_index - N + 1, bucketHi, bar_index + 1, bucketLo, ...))
if isBuyImb
zoneBoxes.push(box.new(bar_index - N + 1, bucketHi, bar_index + 1, bucketLo, ...))
if isAbsorp
zoneBoxes.push(box.new(bar_index - N + 1, bucketHi, bar_index + 1, bucketLo, ...))
Imbalances are identified where one side’s volume (buy or sell) exceeds the other by at least Imbalance Ratio. These buckets are marked as buy or sell imbalance zones, indicating aggressive participation from one side.
Absorption is detected by combining a high volume ratio (volRatio) with a low normalized stealth ratio (stRatio). High volume with limited price movement suggests that opposing orders are absorbing flow at that level. Both imbalance and absorption buckets are extended into horizontal zones from the start of the lookback to the current bar, visually emphasizing key support/resistance and liquidity areas.
6. Building Buy, Sell & Stealth Profiles
sellProfile := array.new(bucketCount, 0)
buyProfile := array.new(bucketCount, 0)
stealthProfile := array.new(bucketCount, 0)
Three arrays are used to store Sell Flow, Buy Flow, and Stealth Flow. Bars are processed from oldest to newest so that decay is applied in correct chronological order. For each bar, a volume density (volume / range) is calculated and distributed across the candle range. Bull candles feed buyProfile, bear candles feed sellProfile.
Stealth Flow computes the close-to-close move between consecutive bars, scaled by 1 / (1 + volume). Big moves on low volume produce high stealth values, which are then allocated across the move’s price span into stealthProfile. This yields a three-layer profile per price level: directional volume and stealthy price movement.
Global Liquidity Index LITEGlobal Liquidity Index (GLI LITE) is an indicator that measures global liquidity by combining the balance sheets of major central banks (FED, ECB, PBOC, BOJ) and the M2 money supply of the world’s largest economies (USA, Europe, China, Japan).
Since liquidity directly influences the price of risk assets (BTC, NASDAQ, SPX, etc.), GLI is one of the most important macro signals for identifying market bull/bear regimes.
What the indicator shows:
GLI momentum line (green = liquidity expansion, orange = contraction)
Fast & Slow MA lines that define the liquidity trend
Bull/Bear background coloring
Green → global liquidity is expanding
Red → liquidity is tightening
Correlation between GLI and the asset price (e.g., BTC)
Macro trend panel (Bull / Bear / Neutral)
How to use the indicator:
Bull regime (Fast MA > Slow MA)
Liquidity is expanding and the market has a natural tailwind. Risk assets tend to perform better.
Bear regime (Fast MA < Slow MA)
Liquidity is tightening — higher risk, increased volatility, and more downside pressure.
GLI ↔ Price Correlation
If correlation is high (e.g., > 0.6), GLI can be an excellent leading indicator for price movement.
ATR/ADR MTF Projection ArrayATR/ADR MTF Projection Array
Overview
A powerful predictive tool that projects ATR (Average True Range) and ADR (Average Daily Range) levels as clean support and resistance arrays on your chart. Designed for traders who want to anticipate the high and low of the day using volatility-based projections with multi-timeframe confluence.
This indicator combines traditional ATR analysis with ICT-style ADR methodology, giving you institutional-grade level projections from a single, customizable tool.
Key Features
🎯 Dual Volatility Metrics
ATR Projections — Classic volatility-based levels with full multi-timeframe support
ADR Projections (ICT Style) — Average Daily Range levels using Inner Circle Trader methodology
Enable/disable each independently based on your trading preference
📊 Multi-Timeframe ATR Analysis
Plot ATR levels from up to 3 timeframes simultaneously (Daily, Weekly, Monthly or custom)
Each timeframe displays with distinct styling for easy identification
Perfect for confluence trading across multiple time horizons
⚡ ICT ADR Methodology
NY Midnight calculation mode (ICT standard) or Classic Daily
Key ICT levels built-in:
1/3 ADR (Judas Swing) — Critical manipulation level where fake moves often terminate
1/2 ADR — Mid-range reference
2/3 ADR — Trending day continuation target
100% ADR — Full daily range completion
150% ADR — Extension target for expansion days
Two projection modes: Static (from anchor) or Dynamic (from session high/low)
🔧 Flexible Anchor Points
Previous Close (default)
Daily Open
Weekly Open
Monthly Open
Session Open
📈 Range Completion Tracking
Real-time display of how much of the expected daily range has been consumed
Visual status indicator helps identify when the day's move may be exhausted
How To Use
For Bias Confirmation:
Establish your directional bias using your preferred method (trigger day, market structure, etc.)
Monitor the 1/3 ADR level during London/NY open for potential Judas Swing (manipulation move)
Target 2/3 to 100% ADR for your HOD/LOD objective
For Target Setting:
Use ATR levels as volatility-based profit targets
ADR 100% level often marks session extremes
When Range Used reaches 100%+, expect consolidation or reversal
For Multi-Timeframe Confluence:
Enable Weekly/Monthly ATR levels alongside Daily
Look for clustering of levels across timeframes for high-probability zones
Settings Guide
Master Controls — Toggle ATR/ADR systems and bull/bear levels independently
ATR Settings — Configure period, multiplier, anchor point, and select which timeframes to display
ATR Level Multipliers — Choose which projection levels to show (0.5x, 0.75x, 1.0x, 1.25x, 1.5x)
ADR Settings (ICT Style) — Select calculation mode (NY Midnight recommended), period (5 days is ICT standard), and projection mode
ADR Level Selection — Toggle individual ICT levels (1/3, 1/2, 2/3, 100%, 150%)
Visual Settings — Customize colors, line styles, labels, and info table position
Alerts Included
ATR 1.0x Bull/Bear Cross
ADR 1/3 Judas Swing Zone (Bull/Bear)
ADR 100% Range Completion (Bull/Bear)
BTC Fear & Greed Incremental StrategyIMPORTANT: READ SETUP GUIDE BELOW OR IT WON'T WORK
# BTC Fear & Greed Incremental Strategy — TradeMaster AI (Pure BTC Stack)
## Strategy Overview
This advanced Bitcoin accumulation strategy is designed for long-term hodlers who want to systematically take profits during greed cycles and accumulate during fear periods, while preserving their core BTC position. Unlike traditional strategies that start with cash, this approach begins with a specified BTC allocation, making it perfect for existing Bitcoin holders who want to optimize their stack management.
## Key Features
### 🎯 **Pure BTC Stack Mode**
- Start with any amount of BTC (configurable)
- Strategy manages your existing stack, not new purchases
- Perfect for hodlers who want to optimize without timing markets
### 📊 **Fear & Greed Integration**
- Uses market sentiment data to drive buy/sell decisions
- Configurable thresholds for greed (selling) and fear (buying) triggers
- Automatic validation to ensure proper 0-100 scale data source
### 🐂 **Bull Year Optimization**
- Smart quarterly selling during bull market years (2017, 2021, 2025)
- Q1: 1% sells, Q2: 2% sells, Q3/Q4: 5% sells (configurable)
- **NO SELLING** during non-bull years - pure accumulation mode
- Preserves BTC during early bull phases, maximizes profits at peaks
### 🐻 **Bear Market Intelligence**
- Multi-regime detection: Bull, Early Bear, Deep Bear, Early Bull
- Different buying strategies based on market conditions
- Enhanced buying during deep bear markets with configurable multipliers
- Visual regime backgrounds for easy market condition identification
### 🛡️ **Risk Management**
- Minimum BTC allocation floor (prevents selling entire stack)
- Configurable position sizing for all trades
- Multiple safety checks and validation
### 📈 **Advanced Visualization**
- Clean 0-100 scale with 2 decimal precision
- Three main indicators: BTC Allocation %, Fear & Greed Index, BTC Holdings
- Real-time portfolio tracking with cash position display
- Enhanced info table showing all key metrics
## How to Use
### **Step 1: Setup**
1. Add the strategy to your BTC/USD chart (daily timeframe recommended)
2. **CRITICAL**: In settings, change the "Fear & Greed Source" from "close" to a proper 0-100 Fear & Greed indicator
---------------
I recommend Crypto Fear & Greed Index by TIA_Technology indicator
When selecting source with this indicator, look for "Crypto Fear and Greed Index:Index"
---------------
3. Set your "Starting BTC Quantity" to match your actual holdings
4. Configure your preferred "Start Date" (when you want the strategy to begin)
### **Step 2: Configure Bull Year Logic**
- Enable "Bull Year Logic" (default: enabled)
- Adjust quarterly sell percentages:
- Q1 (Jan-Mar): 1% (conservative early bull)
- Q2 (Apr-Jun): 2% (moderate mid bull)
- Q3/Q4 (Jul-Dec): 5% (aggressive peak targeting)
- Add future bull years to the list as needed
### **Step 3: Fine-tune Thresholds**
- **Greed Threshold**: 80 (sell when F&G > 80)
- **Fear Threshold**: 20 (buy when F&G < 20 in bull markets)
- **Deep Bear Fear Threshold**: 25 (enhanced buying in bear markets)
- Adjust based on your risk tolerance
### **Step 4: Risk Management**
- Set "Minimum BTC Allocation %" (default 20%) - prevents selling entire stack
- Configure sell/buy percentages based on your position size
- Enable bear market filters for enhanced timing
### **Step 5: Monitor Performance**
- **Orange Line**: Your BTC allocation percentage (target: fluctuate between 20-100%)
- **Blue Line**: Actual BTC holdings (should preserve core position)
- **Pink Line**: Fear & Greed Index (drives all decisions)
- **Table**: Real-time portfolio metrics including cash position
## Reading the Indicators
### **BTC Allocation Percentage (Orange Line)**
- **100%**: All portfolio in BTC, no cash available for buying
- **80%**: 80% BTC, 20% cash ready for fear buying
- **20%**: Minimum allocation, maximum cash position
### **Trading Signals**
- **Green Buy Signals**: Appear during fear periods with available cash
- **Red Sell Signals**: Appear during greed periods in bull years only
- **No Signals**: Either allocation limits reached or non-bull year
## Strategy Logic
### **Bull Years (2017, 2021, 2025)**
- Q1: Conservative 1% sells (preserve stack for later)
- Q2: Moderate 2% sells (gradual profit taking)
- Q3/Q4: Aggressive 5% sells (peak targeting)
- Fear buying active (accumulate on dips)
### **Non-Bull Years**
- **Zero selling** - pure accumulation mode
- Enhanced fear buying during bear markets
- Focus on rebuilding stack for next bull cycle
## Important Notes
- **This is not financial advice** - backtest thoroughly before use
- Designed for **long-term holders** (4+ year cycles)
- **Requires proper Fear & Greed data source** - validate in settings
- Best used on **daily timeframe** for major trend following
- **Cash calculations**: Use allocation % and BTC holdings to calculate available cash: `Cash = (Total Portfolio × (1 - Allocation%/100))`
## Risk Disclaimer
This strategy involves active trading and position management. Past performance does not guarantee future results. Always do your own research and never invest more than you can afford to lose. The strategy is designed for educational purposes and long-term Bitcoin accumulation thesis.
---
*Developed by Sol_Crypto for the Bitcoin community. Happy stacking! 🚀*
Ultimate RSI [captainua]Ultimate RSI
Overview
This indicator combines multiple RSI calculations with volume analysis, divergence detection, and trend filtering to provide a comprehensive RSI-based trading system. The script calculates RSI using three different periods (6, 14, 24) and applies various smoothing methods to reduce noise while maintaining responsiveness. The combination of these features creates a multi-layered confirmation system that reduces false signals by requiring alignment across multiple indicators and timeframes.
The script includes optimized configuration presets for instant setup: Scalping, Day Trading, Swing Trading, and Position Trading. Simply select a preset to instantly configure all settings for your trading style, or use Custom mode for full manual control. All settings include automatic input validation to prevent configuration errors and ensure optimal performance.
Configuration Presets
The script includes preset configurations optimized for different trading styles, allowing you to instantly configure the indicator for your preferred trading approach. Simply select a preset from the "Configuration Preset" dropdown menu:
- Scalping: Optimized for fast-paced trading with shorter RSI periods (4, 7, 9) and minimal smoothing. Noise reduction is automatically disabled, and momentum confirmation is disabled to allow faster signal generation. Designed for quick entries and exits in volatile markets.
- Day Trading: Balanced configuration for intraday trading with moderate RSI periods (6, 9, 14) and light smoothing. Momentum confirmation is enabled for better signal quality. Ideal for day trading strategies requiring timely but accurate signals.
- Swing Trading: Configured for medium-term positions with standard RSI periods (14, 14, 21) and moderate smoothing. Provides smoother signals suitable for swing trading timeframes. All noise reduction features remain active.
- Position Trading: Optimized for longer-term trades with extended RSI periods (24, 21, 28) and heavier smoothing. Filters are configured for highest-quality signals. Best for position traders holding trades over multiple days or weeks.
- Custom: Full manual control over all settings. All input parameters are available for complete customization. This is the default mode and maintains full backward compatibility with previous versions.
When a preset is selected, it automatically adjusts RSI periods, smoothing lengths, and filter settings to match the trading style. The preset configurations ensure optimal settings are applied instantly, eliminating the need for manual configuration. All settings can still be manually overridden if needed, providing flexibility while maintaining ease of use.
Input Validation and Error Prevention
The script includes comprehensive input validation to prevent configuration errors:
- Cross-Input Validation: Smoothing lengths are automatically validated to ensure they are always less than their corresponding RSI period length. If you set a smoothing length greater than or equal to the RSI length, the script automatically adjusts it to (RSI Length - 1). This prevents logical errors and ensures valid configurations.
- Input Range Validation: All numeric inputs have minimum and maximum value constraints enforced by TradingView's input system, preventing invalid parameter values.
- Smart Defaults: Preset configurations use validated default values that are tested and optimized for each trading style. When switching between presets, all related settings are automatically updated to maintain consistency.
Core Calculations
Multi-Period RSI:
The script calculates RSI using the standard Wilder's RSI formula: RSI = 100 - (100 / (1 + RS)), where RS = Average Gain / Average Loss over the specified period. Three separate RSI calculations run simultaneously:
- RSI(6): Uses 6-period lookback for high sensitivity to recent price changes, useful for scalping and early signal detection
- RSI(14): Standard 14-period RSI for balanced analysis, the most commonly used RSI period
- RSI(24): Longer 24-period RSI for trend confirmation, provides smoother signals with less noise
Each RSI can be smoothed using EMA, SMA, RMA (Wilder's smoothing), WMA, or Zero-Lag smoothing. Zero-Lag smoothing uses the formula: ZL-RSI = RSI + (RSI - RSI ) to reduce lag while maintaining signal quality. You can apply individual smoothing lengths to each RSI period, or use global smoothing where all three RSIs share the same smoothing length.
Dynamic Overbought/Oversold Thresholds:
Static thresholds (default 70/30) are adjusted based on market volatility using ATR. The formula: Dynamic OB = Base OB + (ATR × Volatility Multiplier × Base Percentage / 100), Dynamic OS = Base OS - (ATR × Volatility Multiplier × Base Percentage / 100). This adapts to volatile markets where traditional 70/30 levels may be too restrictive. During high volatility, the dynamic thresholds widen, and during low volatility, they narrow. The thresholds are clamped between 0-100 to remain within RSI bounds. The ATR is cached for performance optimization, updating on confirmed bars and real-time bars.
Adaptive RSI Calculation:
An adaptive RSI adjusts the standard RSI(14) based on current volatility relative to average volatility. The calculation: Adaptive Factor = (Current ATR / SMA of ATR over 20 periods) × Volatility Multiplier. If SMA of ATR is zero (edge case), the adaptive factor defaults to 0. The adaptive RSI = Base RSI × (1 + Adaptive Factor), clamped to 0-100. This makes the indicator more responsive during high volatility periods when traditional RSI may lag. The adaptive RSI is used for signal generation (buy/sell signals) but is not plotted on the chart.
Overbought/Oversold Fill Zones:
The script provides visual fill zones between the RSI line and the threshold lines when RSI is in overbought or oversold territory. The fill logic uses inclusive conditions: fills are shown when RSI is currently in the zone OR was in the zone on the previous bar. This ensures complete coverage of entry and exit boundaries. A minimum gap of 0.1 RSI points is maintained between the RSI plot and threshold line to ensure reliable polygon rendering in TradingView. The fill uses invisible plots at the threshold levels and the RSI value, with the fill color applied between them. You can select which RSI (6, 14, or 24) to use for the fill zones.
Divergence Detection
Regular Divergence:
Bullish divergence: Price makes a lower low (current low < lowest low from previous lookback period) while RSI makes a higher low (current RSI > lowest RSI from previous lookback period). Bearish divergence: Price makes a higher high (current high > highest high from previous lookback period) while RSI makes a lower high (current RSI < highest RSI from previous lookback period). The script compares current price/RSI values to the lowest/highest values from the previous lookback period using ta.lowest() and ta.highest() functions with index to reference the previous period's extreme.
Pivot-Based Divergence:
An enhanced divergence detection method that uses actual pivot points instead of simple lowest/highest comparisons. This provides more accurate divergence detection by identifying significant pivot lows/highs in both price and RSI. The pivot-based method uses a tolerance-based approach with configurable constants: 1% tolerance for price comparisons (priceTolerancePercent = 0.01) and 1.0 RSI point absolute tolerance for RSI comparisons (pivotTolerance = 1.0). Minimum divergence threshold is 1.0 RSI point (minDivergenceThreshold = 1.0). It looks for two recent pivot points and compares them: for bullish divergence, price makes a lower low (at least 1% lower) while RSI makes a higher low (at least 1.0 point higher). This method reduces false divergences by requiring actual pivot points rather than just any low/high within a period. When enabled, pivot-based divergence replaces the traditional method for more accurate signal generation.
Strong Divergence:
Regular divergence is confirmed by an engulfing candle pattern. Bullish engulfing requires: (1) Previous candle is bearish (close < open ), (2) Current candle is bullish (close > open), (3) Current close > previous open, (4) Current open < previous close. Bearish engulfing is the inverse: previous bullish, current bearish, current close < previous open, current open > previous close. Strong divergence signals are marked with visual indicators (🐂 for bullish, 🐻 for bearish) and have separate alert conditions.
Hidden Divergence:
Continuation patterns that signal trend continuation rather than reversal. Bullish hidden divergence: Price makes a higher low (current low > lowest low from previous period) but RSI makes a lower low (current RSI < lowest RSI from previous period). Bearish hidden divergence: Price makes a lower high (current high < highest high from previous period) but RSI makes a higher high (current RSI > highest RSI from previous period). These patterns indicate the trend is likely to continue in the current direction.
Volume Confirmation System
Volume threshold filtering requires current volume to exceed the volume SMA multiplied by the threshold factor. The formula: Volume Confirmed = Volume > (Volume SMA × Threshold). If the threshold is set to 0.1 or lower, volume confirmation is effectively disabled (always returns true). This allows you to use the indicator without volume filtering if desired.
Volume Climax is detected when volume exceeds: Volume SMA + (Volume StdDev × Multiplier). This indicates potential capitulation moments where extreme volume accompanies price movements. Volume Dry-Up is detected when volume falls below: Volume SMA - (Volume StdDev × Multiplier), indicating low participation periods that may produce unreliable signals. The volume SMA is cached for performance, updating on confirmed and real-time bars.
Multi-RSI Synergy
The script generates signals when multiple RSI periods align in overbought or oversold zones. This creates a confirmation system that reduces false signals. In "ALL" mode, all three RSIs (6, 14, 24) must be simultaneously above the overbought threshold OR all three must be below the oversold threshold. In "2-of-3" mode, any two of the three RSIs must align in the same direction. The script counts how many RSIs are in each zone: twoOfThreeOB = ((rsi6OB ? 1 : 0) + (rsi14OB ? 1 : 0) + (rsi24OB ? 1 : 0)) >= 2.
Synergy signals require: (1) Multi-RSI alignment (ALL or 2-of-3), (2) Volume confirmation, (3) Reset condition satisfied (enough bars since last synergy signal), (4) Additional filters passed (RSI50, Trend, ADX, Volume Dry-Up avoidance). Separate reset conditions track buy and sell signals independently. The reset condition uses ta.barssince() to count bars since the last trigger, returning true if the condition never occurred (allowing first signal) or if enough bars have passed.
Regression Forecasting
The script uses historical RSI values to forecast future RSI direction using four methods. The forecast horizon is configurable (1-50 bars ahead). Historical data is collected into an array, and regression coefficients are calculated based on the selected method.
Linear Regression: Calculates the least-squares fit line (y = mx + b) through the last N RSI values. The calculation: meanX = sumX / horizon, meanY = sumY / horizon, denominator = sumX² - horizon × meanX², m = (sumXY - horizon × meanX × meanY) / denominator, b = meanY - m × meanX. The forecast projects this line forward: forecast = b + m × i for i = 1 to horizon.
Polynomial Regression: Fits a quadratic curve (y = ax² + bx + c) to capture non-linear trends. The system of equations is solved using Cramer's rule with a 3×3 determinant. If the determinant is too small (< 0.0001), the system falls back to linear regression. Coefficients are calculated by solving: n×c + sumX×b + sumX²×a = sumY, sumX×c + sumX²×b + sumX³×a = sumXY, sumX²×c + sumX³×b + sumX⁴×a = sumX²Y. Note: Due to the O(n³) computational complexity of polynomial regression, the forecast horizon is automatically limited to a maximum of 20 bars when using polynomial regression to maintain optimal performance. If you set a horizon greater than 20 bars with polynomial regression, it will be automatically capped at 20 bars.
Exponential Smoothing: Applies exponential smoothing with adaptive alpha = 2/(horizon+1). The smoothing iterates from oldest to newest value: smoothed = alpha × series + (1 - alpha) × smoothed. Trend is calculated by comparing current smoothed value to an earlier smoothed value (at 60% of horizon): trend = (smoothed - earlierSmoothed) / (horizon - earlierIdx). Forecast: forecast = base + trend × i.
Moving Average: Uses the difference between short MA (horizon/2) and long MA (horizon) to estimate trend direction. Trend = (maShort - maLong) / (longLen - shortLen). Forecast: forecast = maShort + trend × i.
Confidence bands are calculated using RMSE (Root Mean Squared Error) of historical forecast accuracy. The error calculation compares historical values with forecast values: RMSE = sqrt(sumSquaredError / count). If insufficient data exists, it falls back to calculating standard deviation of recent RSI values. Confidence bands = forecast ± (RMSE × confidenceLevel). All forecast values and confidence bands are clamped to 0-100 to remain within RSI bounds. The regression functions include comprehensive safety checks: horizon validation (must not exceed array size), empty array handling, edge case handling for horizon=1 scenarios, division-by-zero protection, and bounds checking for all array access operations to prevent runtime errors.
Strong Top/Bottom Detection
Strong buy signals require three conditions: (1) RSI is at its lowest point within the bottom period: rsiVal <= ta.lowest(rsiVal, bottomPeriod), (2) RSI is below the oversold threshold minus a buffer: rsiVal < (oversoldThreshold - rsiTopBottomBuffer), where rsiTopBottomBuffer = 2.0 RSI points, (3) The absolute difference between current RSI and the lowest RSI exceeds the threshold value: abs(rsiVal - ta.lowest(rsiVal, bottomPeriod)) > threshold. This indicates a bounce from extreme levels with sufficient distance from the absolute low.
Strong sell signals use the inverse logic: RSI at highest point, above overbought threshold + rsiTopBottomBuffer (2.0 RSI points), and difference from highest exceeds threshold. Both signals also require: volume confirmation, reset condition satisfied (separate reset for buy vs sell), and all additional filters passed (RSI50, Trend, ADX, Volume Dry-Up avoidance).
The reset condition uses separate logic for buy and sell: resetCondBuy checks bars since isRSIAtBottom, resetCondSell checks bars since isRSIAtTop. This ensures buy signals reset based on bottom conditions and sell signals reset based on top conditions, preventing incorrect signal blocking.
Filtering System
RSI(50) Filter: Only allows buy signals when RSI(14) > 50 (bullish momentum) and sell signals when RSI(14) < 50 (bearish momentum). This filter ensures you're buying in uptrends and selling in downtrends from a momentum perspective. The filter is optional and can be disabled. Recommended to enable for noise reduction.
Trend Filter: Uses a long-term EMA (default 200) to determine trend direction. Buy signals require price above EMA, sell signals require price below EMA. The EMA slope is calculated as: emaSlope = ema - ema . Optional EMA slope filter additionally requires the EMA to be rising (slope > 0) for buy signals or falling (slope < 0) for sell signals. This provides stronger trend confirmation by requiring both price position and EMA direction.
ADX Filter: Uses the Directional Movement Index (calculated via ta.dmi()) to measure trend strength. Signals only fire when ADX exceeds the threshold (default 20), indicating a strong trend rather than choppy markets. The ADX calculation uses separate length and smoothing parameters. This filter helps avoid signals during sideways/consolidation periods.
Volume Dry-Up Avoidance: Prevents signals during periods of extremely low volume relative to average. If volume dry-up is detected and the filter is enabled, signals are blocked. This helps avoid unreliable signals that occur during low participation periods.
RSI Momentum Confirmation: Requires RSI to be accelerating in the signal direction before confirming signals. For buy signals, RSI must be consistently rising (recovering from oversold) over the lookback period. For sell signals, RSI must be consistently falling (declining from overbought) over the lookback period. The momentum check verifies that all consecutive changes are in the correct direction AND the cumulative change is significant. This filter ensures signals only fire when RSI momentum aligns with the signal direction, reducing false signals from weak momentum.
Multi-Timeframe Confirmation: Requires higher timeframe RSI to align with the signal direction. For buy signals, current RSI must be below the higher timeframe RSI by at least the confirmation threshold. For sell signals, current RSI must be above the higher timeframe RSI by at least the confirmation threshold. This ensures signals align with the larger trend context, reducing counter-trend trades. The higher timeframe RSI is fetched using request.security() from the selected timeframe.
All filters use the pattern: filterResult = not filterEnabled OR conditionMet. This means if a filter is disabled, it always passes (returns true). Filters can be combined, and all must pass for a signal to fire.
RSI Centerline and Period Crossovers
RSI(50) Centerline Crossovers: Detects when the selected RSI source crosses above or below the 50 centerline. Bullish crossover: ta.crossover(rsiSource, 50), bearish crossover: ta.crossunder(rsiSource, 50). You can select which RSI (6, 14, or 24) to use for these crossovers. These signals indicate momentum shifts from bearish to bullish (above 50) or bullish to bearish (below 50).
RSI Period Crossovers: Detects when different RSI periods cross each other. Available pairs: RSI(6) × RSI(14), RSI(14) × RSI(24), or RSI(6) × RSI(24). Bullish crossover: fast RSI crosses above slow RSI (ta.crossover(rsiFast, rsiSlow)), indicating momentum acceleration. Bearish crossover: fast RSI crosses below slow RSI (ta.crossunder(rsiFast, rsiSlow)), indicating momentum deceleration. These crossovers can signal shifts in momentum before price moves.
StochRSI Calculation
Stochastic RSI applies the Stochastic oscillator formula to RSI values instead of price. The calculation: %K = ((RSI - Lowest RSI) / (Highest RSI - Lowest RSI)) × 100, where the lookback is the StochRSI length. If the range is zero, %K defaults to 50.0. %K is then smoothed using SMA with the %K smoothing length. %D is calculated as SMA of smoothed %K with the %D smoothing length. All values are clamped to 0-100. You can select which RSI (6, 14, or 24) to use as the source for StochRSI calculation.
RSI Bollinger Bands
Bollinger Bands are applied to RSI(14) instead of price. The calculation: Basis = SMA(RSI(14), BB Period), StdDev = stdev(RSI(14), BB Period), Upper = Basis + (StdDev × Deviation Multiplier), Lower = Basis - (StdDev × Deviation Multiplier). This creates dynamic zones around RSI that adapt to RSI volatility. When RSI touches or exceeds the bands, it indicates extreme conditions relative to recent RSI behavior.
Noise Reduction System
The script includes a comprehensive noise reduction system to filter false signals and improve accuracy. When enabled, signals must pass multiple quality checks:
Signal Strength Requirement: RSI must be at least X points away from the centerline (50). For buy signals, RSI must be at least X points below 50. For sell signals, RSI must be at least X points above 50. This ensures signals only trigger when RSI is significantly in oversold/overbought territory, not just near neutral.
Extreme Zone Requirement: RSI must be deep in the OB/OS zone. For buy signals, RSI must be at least X points below the oversold threshold. For sell signals, RSI must be at least X points above the overbought threshold. This ensures signals only fire in extreme conditions where reversals are more likely.
Consecutive Bar Confirmation: The signal condition must persist for N consecutive bars before triggering. This reduces false signals from single-bar spikes or noise. The confirmation checks that the signal condition was true for all bars in the lookback period.
Zone Persistence (Optional): Requires RSI to remain in the OB/OS zone for N consecutive bars, not just touch it. This ensures RSI is truly in an extreme state rather than just briefly touching the threshold. When enabled, this provides stricter filtering for higher-quality signals.
RSI Slope Confirmation (Optional): Requires RSI to be moving in the expected signal direction. For buy signals, RSI should be rising (recovering from oversold). For sell signals, RSI should be falling (declining from overbought). This ensures momentum is aligned with the signal direction. The slope is calculated by comparing current RSI to RSI N bars ago.
All noise reduction filters can be enabled/disabled independently, allowing you to customize the balance between signal frequency and accuracy. The default settings provide a good balance, but you can adjust them based on your trading style and market conditions.
Alert System
The script includes separate alert conditions for each signal type: buy/sell (adaptive RSI crossovers), divergence (regular, strong, hidden), crossovers (RSI50 centerline, RSI period crossovers), synergy signals, and trend breaks. Each alert type has its own alertcondition() declaration with a unique title and message.
An optional cooldown system prevents alert spam by requiring a minimum number of bars between alerts of the same type. The cooldown check: canAlert = na(lastAlertBar) OR (bar_index - lastAlertBar >= cooldownBars). If the last alert bar is na (first alert), it always allows the alert. Each alert type maintains its own lastAlertBar variable, so cooldowns are independent per signal type. The default cooldown is 10 bars, which is recommended for noise reduction.
Higher Timeframe RSI
The script can display RSI from a higher timeframe using request.security(). This allows you to see the RSI context from a larger timeframe (e.g., daily RSI on an hourly chart). The higher timeframe RSI uses RSI(14) calculation from the selected timeframe. This provides context for the current timeframe's RSI position relative to the larger trend.
RSI Pivot Trendlines
The script can draw trendlines connecting pivot highs and lows on RSI(6). This feature helps visualize RSI trends and identify potential trend breaks.
Pivot Detection: Pivots are detected using a configurable period. The script can require pivots to have minimum strength (RSI points difference from surrounding bars) to filter out weak pivots. Lower minPivotStrength values detect more pivots (more trendlines), while higher values detect only stronger pivots (fewer but more significant trendlines). Pivot confirmation is optional: when enabled, the script waits N bars to confirm the pivot remains the extreme, reducing repainting. Pivot confirmation functions (f_confirmPivotLow and f_confirmPivotHigh) are always called on every bar for consistency, as recommended by TradingView. When pivot bars are not available (na), safe default values are used, and the results are then used conditionally based on confirmation settings. This ensures consistent calculations and prevents calculation inconsistencies.
Trendline Drawing: Uptrend lines connect confirmed pivot lows (green), and downtrend lines connect confirmed pivot highs (red). By default, only the most recent trendline is shown (old trendlines are deleted when new pivots are confirmed). This keeps the chart clean and uncluttered. If "Keep Historical Trendlines" is enabled, the script preserves up to N historical trendlines (configurable via "Max Trendlines to Keep", default 5). When historical trendlines are enabled, old trendlines are saved to arrays instead of being deleted, allowing you to see multiple trendlines simultaneously for better trend analysis. The arrays are automatically limited to prevent memory accumulation.
Trend Break Detection: Signals are generated when RSI breaks above or below trendlines. Uptrend breaks (RSI crosses below uptrend line) generate buy signals. Downtrend breaks (RSI crosses above downtrend line) generate sell signals. Optional trend break confirmation requires the break to persist for N bars and optionally include volume confirmation. Trendline angle filtering can exclude flat/weak trendlines from generating signals (minTrendlineAngle > 0 filters out weak/flat trendlines).
How Components Work Together
The combination of multiple RSI periods provides confirmation across different timeframes, reducing false signals. RSI(6) catches early moves, RSI(14) provides balanced signals, and RSI(24) confirms longer-term trends. When all three align (synergy), it indicates strong consensus across timeframes.
Volume confirmation ensures signals occur with sufficient market participation, filtering out low-volume false breakouts. Volume climax detection identifies potential reversal points, while volume dry-up avoidance prevents signals during unreliable low-volume periods.
Trend filters align signals with the overall market direction. The EMA filter ensures you're trading with the trend, and the EMA slope filter adds an additional layer by requiring the trend to be strengthening (rising EMA for buys, falling EMA for sells).
ADX filter ensures signals only fire during strong trends, avoiding choppy/consolidation periods. RSI(50) filter ensures momentum alignment with the trade direction.
Momentum confirmation requires RSI to be accelerating in the signal direction, ensuring signals only fire when momentum is aligned. Multi-timeframe confirmation ensures signals align with higher timeframe trends, reducing counter-trend trades.
Divergence detection identifies potential reversals before they occur, providing early warning signals. Pivot-based divergence provides more accurate detection by using actual pivot points. Hidden divergence identifies continuation patterns, useful for trend-following strategies.
The noise reduction system combines multiple filters (signal strength, extreme zone, consecutive bars, zone persistence, RSI slope) to significantly reduce false signals. These filters work together to ensure only high-quality signals are generated.
The synergy system requires alignment across all RSI periods for highest-quality signals, significantly reducing false positives. Regression forecasting provides forward-looking context, helping anticipate potential RSI direction changes.
Pivot trendlines provide visual trend analysis and can generate signals when RSI breaks trendlines, indicating potential reversals or continuations.
Reset conditions prevent signal spam by requiring a minimum number of bars between signals. Separate reset conditions for buy and sell signals ensure proper signal management.
Usage Instructions
Configuration Presets (Recommended): The script includes optimized preset configurations for instant setup. Simply select your trading style from the "Configuration Preset" dropdown:
- Scalping Preset: RSI(4, 7, 9) with minimal smoothing. Noise reduction disabled, momentum confirmation disabled for fastest signals.
- Day Trading Preset: RSI(6, 9, 14) with light smoothing. Momentum confirmation enabled for better signal quality.
- Swing Trading Preset: RSI(14, 14, 21) with moderate smoothing. Balanced configuration for medium-term trades.
- Position Trading Preset: RSI(24, 21, 28) with heavier smoothing. Optimized for longer-term positions with all filters active.
- Custom Mode: Full manual control over all settings. Default behavior matches previous script versions.
Presets automatically configure RSI periods, smoothing lengths, and filter settings. You can still manually adjust any setting after selecting a preset if needed.
Getting Started: The easiest way to get started is to select a configuration preset matching your trading style (Scalping, Day Trading, Swing Trading, or Position Trading) from the "Configuration Preset" dropdown. This instantly configures all settings for optimal performance. Alternatively, use "Custom" mode for full manual control. The default configuration (Custom mode) shows RSI(6), RSI(14), and RSI(24) with their default smoothing. Overbought/oversold fill zones are enabled by default.
Customizing RSI Periods: Adjust the RSI lengths (6, 14, 24) based on your trading timeframe. Shorter periods (6) for scalping, standard (14) for day trading, longer (24) for swing trading. You can disable any RSI period you don't need.
Smoothing Selection: Choose smoothing method based on your needs. EMA provides balanced smoothing, RMA (Wilder's) is traditional, Zero-Lag reduces lag but may increase noise. Adjust smoothing lengths individually or use global smoothing for consistency. Note: Smoothing lengths are automatically validated to ensure they are always less than the corresponding RSI period length. If you set smoothing >= RSI length, it will be auto-adjusted to prevent invalid configurations.
Dynamic OB/OS: The dynamic thresholds automatically adapt to volatility. Adjust the volatility multiplier and base percentage to fine-tune sensitivity. Higher values create wider thresholds in volatile markets.
Volume Confirmation: Set volume threshold to 1.2 (default) for standard confirmation, higher for stricter filtering, or 0.1 to disable volume filtering entirely.
Multi-RSI Synergy: Use "ALL" mode for highest-quality signals (all 3 RSIs must align), or "2-of-3" mode for more frequent signals. Adjust the reset period to control signal frequency.
Filters: Enable filters gradually to find your preferred balance. Start with volume confirmation, then add trend filter, then ADX for strongest confirmation. RSI(50) filter is useful for momentum-based strategies and is recommended for noise reduction. Momentum confirmation and multi-timeframe confirmation add additional layers of accuracy but may reduce signal frequency.
Noise Reduction: The noise reduction system is enabled by default with balanced settings. Adjust minSignalStrength (default 3.0) to control how far RSI must be from centerline. Increase requireConsecutiveBars (default 1) to require signals to persist longer. Enable requireZonePersistence and requireRsiSlope for stricter filtering (higher quality but fewer signals). Start with defaults and adjust based on your needs.
Divergence: Enable divergence detection and adjust lookback periods. Strong divergence (with engulfing confirmation) provides higher-quality signals. Hidden divergence is useful for trend-following strategies. Enable pivot-based divergence for more accurate detection using actual pivot points instead of simple lowest/highest comparisons. Pivot-based divergence uses tolerance-based matching (1% for price, 1.0 RSI point for RSI) for better accuracy.
Forecasting: Enable regression forecasting to see potential RSI direction. Linear regression is simplest, polynomial captures curves, exponential smoothing adapts to trends. Adjust horizon based on your trading timeframe. Confidence bands show forecast uncertainty - wider bands indicate less reliable forecasts.
Pivot Trendlines: Enable pivot trendlines to visualize RSI trends and identify trend breaks. Adjust pivot detection period (default 5) - higher values detect fewer but stronger pivots. Enable pivot confirmation (default ON) to reduce repainting. Set minPivotStrength (default 1.0) to filter weak pivots - lower values detect more pivots (more trendlines), higher values detect only stronger pivots (fewer trendlines). Enable "Keep Historical Trendlines" to preserve multiple trendlines instead of just the most recent one. Set "Max Trendlines to Keep" (default 5) to control how many historical trendlines are preserved. Enable trend break confirmation for more reliable break signals. Adjust minTrendlineAngle (default 0.0) to filter flat trendlines - set to 0.1-0.5 to exclude weak trendlines.
Alerts: Set up alerts for your preferred signal types. Enable cooldown to prevent alert spam. Each signal type has its own alert condition, so you can be selective about which signals trigger alerts.
Visual Elements and Signal Markers
The script uses various visual markers to indicate signals and conditions:
- "sBottom" label (green): Strong bottom signal - RSI at extreme low with strong buy conditions
- "sTop" label (red): Strong top signal - RSI at extreme high with strong sell conditions
- "SyBuy" label (lime): Multi-RSI synergy buy signal - all RSIs aligned oversold
- "SySell" label (red): Multi-RSI synergy sell signal - all RSIs aligned overbought
- 🐂 emoji (green): Strong bullish divergence detected
- 🐻 emoji (red): Strong bearish divergence detected
- 🔆 emoji: Weak divergence signals (if enabled)
- "H-Bull" label: Hidden bullish divergence
- "H-Bear" label: Hidden bearish divergence
- ⚡ marker (top of pane): Volume climax detected (extreme volume) - positioned at top for visibility
- 💧 marker (top of pane): Volume dry-up detected (very low volume) - positioned at top for visibility
- ↑ triangle (lime): Uptrend break signal - RSI breaks below uptrend line
- ↓ triangle (red): Downtrend break signal - RSI breaks above downtrend line
- Triangle up (lime): RSI(50) bullish crossover
- Triangle down (red): RSI(50) bearish crossover
- Circle markers: RSI period crossovers
All markers are positioned at the RSI value where the signal occurs, using location.absolute for precise placement.
Signal Priority and Interpretation
Signals are generated independently and can occur simultaneously. Higher-priority signals generally indicate stronger setups:
1. Multi-RSI Synergy signals (SyBuy/SySell) - Highest priority: Requires alignment across all RSI periods plus volume and filter confirmation. These are the most reliable signals.
2. Strong Top/Bottom signals (sTop/sBottom) - High priority: Indicates extreme RSI levels with strong bounce conditions. Requires volume confirmation and all filters.
3. Divergence signals - Medium-High priority: Strong divergence (with engulfing) is more reliable than regular divergence. Hidden divergence indicates continuation rather than reversal.
4. Adaptive RSI crossovers - Medium priority: Buy when adaptive RSI crosses below dynamic oversold, sell when it crosses above dynamic overbought. These use volatility-adjusted RSI for more accurate signals.
5. RSI(50) centerline crossovers - Medium priority: Momentum shift signals. Less reliable alone but useful when combined with other confirmations.
6. RSI period crossovers - Lower priority: Early momentum shift indicators. Can provide early warning but may produce false signals in choppy markets.
Best practice: Wait for multiple confirmations. For example, a synergy signal combined with divergence and volume climax provides the strongest setup.
Chart Requirements
For proper script functionality and compliance with TradingView requirements, ensure your chart displays:
- Symbol name: The trading pair or instrument name should be visible
- Timeframe: The chart timeframe should be clearly displayed
- Script name: "Ultimate RSI " should be visible in the indicator title
These elements help traders understand what they're viewing and ensure proper script identification. The script automatically includes this information in the indicator title and chart labels.
Performance Considerations
The script is optimized for performance:
- ATR and Volume SMA are cached using var variables, updating only on confirmed and real-time bars to reduce redundant calculations
- Forecast line arrays are dynamically managed: lines are reused when possible, and unused lines are deleted to prevent memory accumulation
- Calculations use efficient Pine Script functions (ta.rsi, ta.ema, etc.) which are optimized by TradingView
- Array operations are minimized where possible, with direct calculations preferred
- Polynomial regression automatically caps the forecast horizon at 20 bars (POLYNOMIAL_MAX_HORIZON constant) to prevent performance degradation, as polynomial regression has O(n³) complexity. This safeguard ensures optimal performance even with large horizon settings
- Pivot detection includes edge case handling to ensure reliable calculations even on early bars with limited historical data. Regression forecasting functions include comprehensive safety checks: horizon validation (must not exceed array size), empty array handling, edge case handling for horizon=1 scenarios, and division-by-zero protection in all mathematical operations
The script should perform well on all timeframes. On very long historical data, forecast lines may accumulate if the horizon is large; consider reducing the forecast horizon if you experience performance issues. The polynomial regression performance safeguard automatically prevents performance issues for that specific regression type.
Known Limitations and Considerations
- Forecast lines are forward-looking projections and should not be used as definitive predictions. They provide context but are not guaranteed to be accurate.
- Dynamic OB/OS thresholds can exceed 100 or go below 0 in extreme volatility scenarios, but are clamped to 0-100 range. This means in very volatile markets, the dynamic thresholds may not widen as much as the raw calculation suggests.
- Volume confirmation requires sufficient historical volume data. On new instruments or very short timeframes, volume calculations may be less reliable.
- Higher timeframe RSI uses request.security() which may have slight delays on some data feeds.
- Regression forecasting requires at least N bars of history (where N = forecast horizon) before it can generate forecasts. Early bars will not show forecast lines.
- StochRSI calculation requires the selected RSI source to have sufficient history. Very short RSI periods on new charts may produce less reliable StochRSI values initially.
Practical Use Cases
The indicator can be configured for different trading styles and timeframes:
Swing Trading: Select the "Swing Trading" preset for instant optimal configuration. This preset uses RSI periods (14, 14, 21) with moderate smoothing. Alternatively, manually configure: Use RSI(24) with Multi-RSI Synergy in "ALL" mode, combined with trend filter (EMA 200) and ADX filter. This configuration provides high-probability setups with strong confirmation across multiple RSI periods.
Day Trading: Select the "Day Trading" preset for instant optimal configuration. This preset uses RSI periods (6, 9, 14) with light smoothing and momentum confirmation enabled. Alternatively, manually configure: Use RSI(6) with Zero-Lag smoothing for fast signal detection. Enable volume confirmation with threshold 1.2-1.5 for reliable entries. Combine with RSI(50) filter to ensure momentum alignment. Strong top/bottom signals work well for day trading reversals.
Trend Following: Enable trend filter (EMA) and EMA slope filter for strong trend confirmation. Use RSI(14) or RSI(24) with ADX filter to avoid choppy markets. Hidden divergence signals are useful for trend continuation entries.
Reversal Trading: Focus on divergence detection (regular and strong) combined with strong top/bottom signals. Enable volume climax detection to identify capitulation moments. Use RSI(6) for early reversal signals, confirmed by RSI(14) and RSI(24).
Forecasting and Planning: Enable regression forecasting with polynomial or exponential smoothing methods. Use forecast horizon of 10-20 bars for swing trading, 5-10 bars for day trading. Confidence bands help assess forecast reliability.
Multi-Timeframe Analysis: Enable higher timeframe RSI to see context from larger timeframes. For example, use daily RSI on hourly charts to understand the larger trend context. This helps avoid counter-trend trades.
Scalping: Select the "Scalping" preset for instant optimal configuration. This preset uses RSI periods (4, 7, 9) with minimal smoothing, disables noise reduction, and disables momentum confirmation for faster signals. Alternatively, manually configure: Use RSI(6) with minimal smoothing (or Zero-Lag) for ultra-fast signals. Disable most filters except volume confirmation. Use RSI period crossovers (RSI(6) × RSI(14)) for early momentum shifts. Set volume threshold to 1.0-1.2 for less restrictive filtering.
Position Trading: Select the "Position Trading" preset for instant optimal configuration. This preset uses extended RSI periods (24, 21, 28) with heavier smoothing, optimized for longer-term trades. Alternatively, manually configure: Use RSI(24) with all filters enabled (Trend, ADX, RSI(50), Volume Dry-Up avoidance). Multi-RSI Synergy in "ALL" mode provides highest-quality signals.
Practical Tips and Best Practices
Getting Started: The fastest way to get started is to select a configuration preset that matches your trading style. Simply choose "Scalping", "Day Trading", "Swing Trading", or "Position Trading" from the "Configuration Preset" dropdown to instantly configure all settings optimally. For advanced users, use "Custom" mode for full manual control. The default configuration (Custom mode) is balanced and works well across different markets. After observing behavior, customize settings to match your trading style.
Reducing Repainting: All signals are based on confirmed bars, minimizing repainting. The script uses confirmed bar data for all calculations to ensure backtesting accuracy.
Signal Quality: Multi-RSI Synergy signals in "ALL" mode provide the highest-quality signals because they require alignment across all three RSI periods. These signals have lower frequency but higher reliability. For more frequent signals, use "2-of-3" mode. The noise reduction system further improves signal quality by requiring multiple confirmations (signal strength, extreme zone, consecutive bars, optional zone persistence and RSI slope). Adjust noise reduction settings to balance signal frequency vs. accuracy.
Filter Combinations: Start with volume confirmation, then add trend filter for trend alignment, then ADX filter for trend strength. Combining all three filters significantly reduces false signals but also reduces signal frequency. Find your balance based on your risk tolerance.
Volume Filtering: Set volume threshold to 0.1 or lower to effectively disable volume filtering if you trade instruments with unreliable volume data or want to test without volume confirmation. Standard confirmation uses 1.2-1.5 threshold.
RSI Period Selection: RSI(6) is most sensitive and best for scalping or early signal detection. RSI(14) provides balanced signals suitable for day trading. RSI(24) is smoother and better for swing trading and trend confirmation. You can disable any RSI period you don't need to reduce visual clutter.
Smoothing Methods: EMA provides balanced smoothing with moderate lag. RMA (Wilder's smoothing) is traditional and works well for RSI. Zero-Lag reduces lag but may increase noise. WMA gives more weight to recent values. Choose based on your preference for responsiveness vs. smoothness.
Forecasting: Linear regression is simplest and works well for trending markets. Polynomial regression captures curves and works better in ranging markets. Exponential smoothing adapts to trends. Moving average method is most conservative. Use confidence bands to assess forecast reliability.
Divergence: Strong divergence (with engulfing confirmation) is more reliable than regular divergence. Hidden divergence indicates continuation rather than reversal, useful for trend-following strategies. Pivot-based divergence provides more accurate detection by using actual pivot points instead of simple lowest/highest comparisons. Adjust lookback periods based on your timeframe: shorter for day trading, longer for swing trading. Pivot divergence period (default 5) controls the sensitivity of pivot detection.
Dynamic Thresholds: Dynamic OB/OS thresholds automatically adapt to volatility. In volatile markets, thresholds widen; in calm markets, they narrow. Adjust the volatility multiplier and base percentage to fine-tune sensitivity. Higher values create wider thresholds in volatile markets.
Alert Management: Enable alert cooldown (default 10 bars, recommended) to prevent alert spam. Each alert type has its own cooldown, so you can set different cooldowns for different signal types. For example, use shorter cooldown for synergy signals (high quality) and longer cooldown for crossovers (more frequent). The cooldown system works independently for each signal type, preventing spam while allowing different signal types to fire when appropriate.
Technical Specifications
- Pine Script Version: v6
- Indicator Type: Non-overlay (displays in separate panel below price chart)
- Repainting Behavior: Minimal - all signals are based on confirmed bars, ensuring accurate backtesting results
- Performance: Optimized with caching for ATR and volume calculations. Forecast arrays are dynamically managed to prevent memory accumulation.
- Compatibility: Works on all timeframes (1 minute to 1 month) and all instruments (stocks, forex, crypto, futures, etc.)
- Edge Case Handling: All calculations include safety checks for division by zero, NA values, and boundary conditions. Reset conditions and alert cooldowns handle edge cases where conditions never occurred or values are NA.
- Reset Logic: Separate reset conditions for buy signals (based on bottom conditions) and sell signals (based on top conditions) ensure logical correctness.
- Input Parameters: 60+ customizable parameters organized into logical groups for easy configuration. Configuration presets available for instant setup (Scalping, Day Trading, Swing Trading, Position Trading, Custom).
- Noise Reduction: Comprehensive noise reduction system with multiple filters (signal strength, extreme zone, consecutive bars, zone persistence, RSI slope) to reduce false signals.
- Pivot-Based Divergence: Enhanced divergence detection using actual pivot points for improved accuracy.
- Momentum Confirmation: RSI momentum filter ensures signals only fire when RSI is accelerating in the signal direction.
- Multi-Timeframe Confirmation: Optional higher timeframe RSI alignment for trend confirmation.
- Enhanced Pivot Trendlines: Trendline drawing with strength requirements, confirmation, and trend break detection.
Technical Notes
- All RSI values are clamped to 0-100 range to ensure valid oscillator values
- ATR and Volume SMA are cached for performance, updating on confirmed and real-time bars
- Reset conditions handle edge cases: if a condition never occurred, reset returns true (allows first signal)
- Alert cooldown handles na values: if no previous alert, cooldown allows the alert
- Forecast arrays are dynamically sized based on horizon, with unused lines cleaned up
- Fill logic uses a minimum gap (0.1) to ensure reliable polygon rendering in TradingView
- All calculations include safety checks for division by zero and boundary conditions. Regression functions validate that horizon doesn't exceed array size, and all array access operations include bounds checking to prevent out-of-bounds errors
- The script uses separate reset conditions for buy signals (based on bottom conditions) and sell signals (based on top conditions) for logical correctness
- Background coloring uses a fallback system: dynamic color takes priority, then RSI(6) heatmap, then monotone if both are disabled
- Noise reduction filters are applied after accuracy filters, providing multiple layers of signal quality control
- Pivot trendlines use strength requirements to filter weak pivots, reducing noise in trendline drawing. Historical trendlines are stored in arrays and automatically limited to prevent memory accumulation when "Keep Historical Trendlines" is enabled
- Volume climax and dry-up markers are positioned at the top of the pane for better visibility
- All calculations are optimized with conditional execution - features only calculate when enabled (performance optimization)
- Input Validation: Automatic cross-input validation ensures smoothing lengths are always less than RSI period lengths, preventing configuration errors
- Configuration Presets: Four optimized preset configurations (Scalping, Day Trading, Swing Trading, Position Trading) for instant setup, plus Custom mode for full manual control
- Constants Management: Magic numbers extracted to documented constants for improved maintainability and easier tuning (pivot tolerance, divergence thresholds, fill gap, etc.)
- TradingView Function Consistency: All TradingView functions (ta.crossover, ta.crossunder, ta.atr, ta.lowest, ta.highest, ta.lowestbars, ta.highestbars, etc.) and custom functions that depend on historical results (f_consecutiveBarConfirmation, f_rsiSlopeConfirmation, f_rsiZonePersistence, f_applyAllFilters, f_rsiMomentum, f_forecast, f_confirmPivotLow, f_confirmPivotHigh) are called on every bar for consistency, as recommended by TradingView. Results are then used conditionally when needed. This ensures consistent calculations and prevents calculation inconsistencies.
FluxPulse Beacon## FluxPulse Beacon
FluxPulse Beacon applies a microstructure lens to every bar, combining directional thrust, realized volatility, and multi-timeframe liquidity checks to decide whether the tape is being pushed by real sponsorship or just noise. The oscillator's color-coded columns and adaptive burst thresholds transform complex flow dynamics into a single actionable flux score for futures and equities traders.
HOW IT WORKS
Momentum Extraction – Price differentials over a configurable pulse distance are smoothed using exponential moving averages to isolate directional thrust without reacting to single prints.
Volatility + Liquidity Normalization – The momentum stream is divided by realized volatility and multiplied by both local and higher-timeframe EMA volume ratios, ensuring pulses only appear when volatility and liquidity align.
Adaptive Thresholding – A volatility-derived standard deviation of flux is blended with the base threshold so bursts scale automatically between low-volatility and high-volatility market conditions.
Divergence Engine – Linear regression slopes compare price vs. flux to tag bullish/bearish divergences, highlighting stealth accumulation or distribution zones.
HOW TO USE IT
Continuation Entries : Go with the trend when histogram bars stay above the adaptive threshold, the signal line confirms, and trend bias agrees—this is where liquidity-backed follow-through lives.
Fade Plays : Watch for divergence alerts and shrinking compression values; when flux prints below zero yet price grinds higher, hidden selling pressure often precedes rollovers.
Session Filter : Compression percentage in the diagnostics table instantly tells you whether to trade thin overnight sessions—low compression means stand down.
VISUAL FEATURES
Dynamic background heat maps flux magnitude, while threshold lines provide a quick read on whether a pulse is statistically significant.
Diagnostics table displays live flux, signal, adaptive threshold, and compression for quick reference.
Alert-first workflow: The surface is intentionally clean—bursts and divergences are delivered via alerts instead of on-chart clutter.
PARAMETERS
Trend EMA Length (default: 34): Defines the macro bias anchor; increase for higher-timeframe confirmation.
Pulse Distance (default: 8): Controls how sensitive momentum extraction becomes.
Volatility Window (default: 21): Sample window for realized volatility normalization.
Liquidity Window (default: 55): Volume smoothing window that proxies liquidity expansion.
Liquidity Reference TF (default: 60): Select a higher timeframe to cross-check whether current volume matches institutional flows.
Adaptive Threshold (default: enabled): Disable for fixed thresholds on slower markets; enable for high-volatility assets.
Base Burst Threshold (default: 1.25): Minimum flux magnitude that qualifies as an actionable pulse.
ALERTS
The indicator includes four alert conditions:
Bull Burst: Detects upside liquidity pulses
Bear Burst: Detects downside liquidity pulses
Bull Divergence: Flags bullish delta divergence
Bear Divergence: Flags bearish delta divergence
LIMITATIONS
This indicator is designed for liquid futures and equity markets. Performance may degrade in low-volume or highly illiquid instruments. The adaptive threshold system works best on timeframes where sufficient volatility history exists (typically 15-minute charts and above). Divergence signals are probabilistic and should be confirmed with price action.
INSERT_CHART_SNAPSHOT_URL_HERE
---
## RangeLattice Mapper
RangeLattice Mapper constructs a higher-timeframe scaffolding on any intraday chart, locking in structural highs/lows, mid/quarter grids, VWAP confluence, and live acceptance/break analytics. It provides a non-repainting overlay that turns range management into a disciplined process.
HOW IT WORKS
Structure Harvesting – Using request.security() , the script samples highs/lows from a user-selected timeframe (default 240 minutes) over a configurable lookback to establish the dominant range.
Grid Construction – Midpoint and quarter levels are derived mathematically, mirroring how institutional traders map distribution/accumulation zones.
Acceptance Detection – Consecutive closes inside the range flip an acceptance flag and darken the cloud, signaling balanced auction conditions.
Break Confirmation – Multi-bar closes outside the structure raise break labels and alerts, filtering the countless fake-outs that plague breakout traders.
VWAP Fan Overlay – Session VWAP plus ATR-based bands provide a live measure of flow centering relative to the lattice.
HOW TO USE IT
Range Plays : Fade taps of the outer rails only when acceptance is active and VWAP sits inside the grid—this is where mean-reversion works best.
Breakout Plays : Wait for confirmed break labels before entering expansion trades; the dashboard's Width/ATR metric tells you if the expansion has enough fuel.
Market Prep : Carry the same lattice from pre-market into regular trading hours by keeping the structure timeframe fixed; alerts keep you notified even when managing multiple tickers.
VISUAL FEATURES
Range Tap and Mid Pivot markers provide a tape-reading breadcrumb trail for journaling.
Cloud fill opacity tightens when acceptance persists, visually signaling balance compressions ready to break.
Dashboard displays absolute width, ATR-normalized width, and current state (Balanced vs Transitional) so you can glance across charts quickly.
Acceptance Flag toggle: Keep the repeated acceptance squares hidden until you need to audit balance.
PARAMETERS
Structure Timeframe (default: 240): Choose the timeframe whose ranges matter most (4H for indices, Daily for stocks).
Structure Lookback (default: 60): Bars sampled on the structure timeframe.
Acceptance Bars (default: 8): How many consecutive bars inside the range confirm balance.
Break Confirmation Bars (default: 3): Bars required outside the range to validate a breakout.
ATR Reference (default: 14): ATR period for width normalization.
Show Midpoint Grid (default: enabled): Display the midpoint and quarter levels.
Show Adaptive VWAP Fan (default: enabled): Toggle the VWAP channel for assets where volume distribution matters most.
Show Acceptance Flags (default: disabled): Turn the acceptance markers on/off for maximum visual control.
Show Range Dashboard (default: enabled): Disable if screen space is limited, re-enable during prep sessions.
ALERTS
The indicator includes five alert conditions:
Range High Tap: Price interacted with the RangeLattice high
Range Low Tap: Price interacted with the RangeLattice low
Range Mid Tap: Price interacted with the RangeLattice mid
Range Break Up: Confirmed upside breakout
Range Break Down: Confirmed downside breakout
LIMITATIONS
This indicator works best on liquid instruments with clear structural levels. On very low timeframes (1-minute and below), the structure may update too frequently to be useful. The acceptance/break confirmation system requires patience—faster traders may find the multi-bar confirmation too slow for scalping. The VWAP fan is session-based and resets daily, which may not suit all trading styles.
---
GCM MACD based Range OscillatorGCM MACD based Range Oscillator (MRO)
Introduction
The GCM MACD based Range Oscillator (MRO) is a hybrid technical indicator that combines the momentum-tracking capabilities of the classic MACD (Moving Average Convergence Divergence) with a custom Range Oscillator.
The core problem this script solves is normalization. Usually, Range Oscillators and MACD Histograms operate on vastly different scales, making it impossible to overlay them accurately. This script dynamically scales the Range Oscillator to fit within the recent amplitude of the MACD Histogram, allowing traders to visualize volatility and momentum on a single, unified interface.
How It Works (The Math)
1. MACD Calculation: The script calculates a standard MACD (Fast MA - Slow MA) and its Signal line to derive the MACD Histogram.
2. Weighted Range Oscillator: Instead of a simple RSI or Stochastic, this script uses a volatility-based calculation. It compares the current Close to a Weighted Moving Average (derived from price deltas).
3. Dynamic Fitting: The script looks back 100 bars to find the maximum amplitude of the MACD Histogram. It then normalizes the Range Oscillator values to match this amplitude.
4. Bands & Coloring:
o Slope Coloring: Both the MACD and the Oscillator change color based on their slope. Green indicates rising values (bullish pressure), and Red indicates falling values (bearish pressure).
o Fixed Bands: Horizontal bands are placed at +0.75 and -0.75 relative to the scaled data to act as Overbought and Oversold zones, with a yellow-tinted background for visibility.
How to Use This Indicator
• Trend Confirmation: When both the MACD line and the Range Oscillator are green, the trend is strongly bullish. When both are red, the trend is bearish.
• Contraction & Expansion: The yellow zone (between -0.75 and +0.75) represents the "equilibrium" or ranging area. Breakouts above the Upper Band (+0.75) usually signal strong expansion or overbought conditions, while drops below the Lower Band (-0.75) signal oversold conditions.
• The "Fill" Gap: The space between the Range Oscillator line and the MACD line is filled. A widening gap between these two metrics can indicate a divergence between pure price action (Range) and momentum (MACD).
• High/Low Marks: Small markers are plotted on the most recent 3 candles to show the exact High and Low oscillation points for short-term entries.
Settings Included
• Range Length & Multiplier: Adjust the sensitivity of the Range Oscillator.
• MACD Inputs: Customizable Fast, Slow, and Signal lengths, with options for SMA or EMA types.
• Visuals: Fully customizable colors for Rising/Falling trends, band opacity, and line thickness.
How this follows House Rules
1. Originality:
o Rule: You cannot simply upload a generic MACD.
o Compliance: This is not a standard MACD. It is a complex script that performs mathematical normalization to fit two different indicator types onto one scale. The "Dynamic Fitting" logic makes it unique.
2. Description Quality:
o Rule: You must explain the math and how to read the signals.
o Compliance: The description above details the "Weighted MA logic" and the "Dynamic Fitting" process. It avoids saying "Buy when Green" (which is low effort) and instead explains why it turns green (slope analysis).
3. Visuals:
o Rule: Plots must be clear and not cluttered.
o Compliance: The script uses overlay=false (separate pane). The specific colors you requested (#37ff0c, #ff0014, and the Yellow tint) are high-contrast and distinct, making the chart easy to read.
4. No "Holy Grail" Claims:
o Rule: Do not promise guaranteed profits.
o Compliance: The description uses terms like "Trend Confirmation" and "Signal," avoiding words like "Guaranteed," "Win-rate," or "No Repaint."
Quantrader📊 Overview
This custom indicator combines intraday session analysis with multi-timeframe trend confirmation to identify high-probability trading opportunities. It features:
Custom intraday session tracking (GMT+7 timezone)
Multi-level moving average confluence (SMA 20, 100, 200)
Bollinger Bands mean reversion signals
Key intraday reference levels
⚙️ Core Components
1. Custom Intraday Session Tracking
Session Start: 7:00 AM GMT+7 (Vietnamese market open)
Calculates per session:
Intraday High/Low (resets at 7:00 AM daily)
Intraday Midline = (Session High + Session Low) / 2
Pre-Day Center = Previous day's midline (carried forward)
Open Day = First 15-minute candle's open price
2. Trend Analysis Framework
SMA 20 (Short-term momentum)
SMA 100 (Medium-term trend)
SMA 200 (Long-term trend direction)
Bollinger Bands (20-period, 2 standard deviations)
3. Signal Detection Logic
Bullish Mean Reversion Setup:
javascript
Condition 1: Green candle closes ABOVE Upper Bollinger Band
Condition 2: Following candle is ALSO green
→ Triggers: Green highlight + Triangle below bar
Bearish Mean Reversion Setup:
javascript
Condition 1: Red candle closes BELOW Lower Bollinger Band
Condition 2: Following candle is ALSO red
→ Triggers: Red highlight + Triangle above bar
🎯 Visual Elements
Element Color Description
Intraday Midline Blue Real-time session midpoint
Pre-Day Center Yellow Yesterday's midline (reference)
Open Day Purple (dashed) Day's opening price
SMA 20 Red Short-term trend
SMA 100 Green Medium-term trend
SMA 200 Orange Long-term trend
Bollinger Bands Red/Green/Blue Volatility boundaries
Bull Signal Green triangle ↓ Oversold bounce potential
Bear Signal Red triangle ↑ Overbought rejection potential
📈 Trading Applications
1. Trend Confirmation
Bullish Alignment: Price > All SMAs + Above Intraday Midline
Bearish Alignment: Price < All SMAs + Below Intraday Midline
2. Mean Reversion Opportunities
Overbought Scenario: Consecutive green candles above Upper BB → Potential reversal
Oversold Scenario: Consecutive red candles below Lower BB → Potential bounce
3. Intraday Level Trading
Intraday Midline: Dynamic support/resistance
Pre-Day Center: Psychological reference level
Open Day: Key opening price level
⚡ Key Features
Automatic Session Reset: Daily at 7:00 AM GMT+7
Multi-Timeframe Confluence: Combines intraday, daily, and trend analysis
Clean Visual Design: Non-cluttered, focused on key levels
Real-Time Calculation: All levels update with each new candle
🛠️ Recommended Settings
Timeframe: 15-minute to 1-hour charts
Markets: Forex, Indices, Commodities
Best Pairs: EURUSD, XAUUSD, VN30, USDJPY
Trading Style: Swing trading, Day trading
📖 Usage Tips
Trend Trading: Enter in direction of SMA alignment (20 > 100 > 200 for bullish)
Mean Reversion: Use BB signals at key intraday levels (Midline, Pre-Day Center)
Confirmation: Wait for candle close above/below key levels
Risk Management: Place stops beyond opposite intraday extreme
🎨 Customization Options
Users can modify:
Session start time (line 6)
Bollinger Band parameters (length, multiplier)
SMA periods
Color schemes
Market Internals Dashboard: Trend, Breadth, Volume PressureOverview
The Market Internals Dashboard Pro is a professional-grade toolkit modeled after what prop firms and institutional desks use to understand real intraday market conditions.
Instead of relying solely on price, this indicator analyzes three critical internal forces:
USI:TICK : Microstructure buying/selling pressure
USI:ADD : Market breadth participation (advancers vs decliners proxy)
USI:VOLD : Volume pressure (buying vs selling volume)
These internals determine whether the market is:
Trending or ranging
Bullish or bearish
Likely to follow through or mean-revert
Favoring continuation trades or fade setups
The script also produces a Market Environment Score (–3 to +3) and a real-time Trade Recommendation Table that updates every bar. This helps answer the single most important question in intraday trading: “What type of trades should I be taking right now given current market conditions?”
1. TICK Proxy: Microstructure Pressure
Measures buying vs. selling aggressiveness across the market This proxy simulates the NYSE TICK index by evaluating whether bars close above or below the prior bar.
Positive TICK → Buyers lifting offers
Negative TICK → Sellers hitting bids
Neutral TICK → No microstructure conviction
Why it matters:
Strong TICK is often the earliest sign of:
Trend initiation
Algorithmic buy/sell programs
Shifts in short‑term sentiment
Weak or choppy TICK often signals:
Range conditions
Failed breakouts
Low‑quality trend attempts
2. ADD Proxy: Market Breadth Strength
Shows how many stocks are participating in a move Because real USI:ADD data isn't available for all users, this script uses a self-contained breadth approximation built from:
Price slope
Volatility expansion
Volume‑weighted directional pressure
Why it matters? Breadth reveals whether the move is:
Broad and healthy → likely to continue
Narrow and weak → vulnerable to reversal
Strong trends require strong breadth. Weak breadth often precedes:
Failed breakouts
Reversal setups
Chop (ewww)
3. VOLD Proxy: Volume Pressure
The most important internal of all. This proxy measures whether trading volume is flowing into up bars or down bars.
Positive VOLD → Net buying pressure
Negative VOLD → Net selling pressure
Why it matters:
VOLD is considered the "truth serum" of the tape:
Strong VOLD drives trend days
Negative VOLD kills long setups
Mixed VOLD creates chop
You should rarely trend trade against VOLD.
4. Market Environment Score (–3 to +3)
The Environment Score combines the three internals into a single view:
|| Score || Interpretation || Market Type ||
| +3 | Strong Bull | Trend Day (Long) |
| +2 | Bull | Pullback Buys / Breakout Continuation |
| +1 | Mild Bull | Conservative Long Scalps |
| 0 | Neutral | CHOP – VWAP Reversions / Fades |
| -1 | Mild Bear | Short Failed Breakouts |
| -2 | Bear | Trend Shorts / Breakdown Continuation |
| -3 | Strong Bear | Trend Day (Short) |
Why it matters:
The market behaves differently depending on internal alignment. This score prevents traders from:
Forcing trend trades on chop days
Chasing breakouts when breadth is weak
Fading strong directional days
It tells you in real time whether conditions favor:
Trend following
Mean reversion
Breakout continuation
Liquidity grabs
Or sitting out
5. Trade Recommendation Engine
Based on the Environment Score, the indicator outputs a real-time playbook recommending which trade types have the highest probability of success right now.
Examples:
Score = 0 (Neutral)
VWAP Reversions
Liquidity Grabs
Failed Breakouts
Quick Scalps
Score = +2/+3 (Strong Bull)
Pullback Buys
Breakout Continuation
Trend Longs
Score = -2/-3 (Strong Bear)
Pullback Shorts
Breakdown Continuation
Trend Shorts Only
This turns the internals into a trade selection engine, not just a data display.
Why Market Internals Matter
Most indicators look only at price, but price is the result, not the cause.
Market internals show:
Where volume is flowing
Whether buying is aggressive or passive
How many stocks are participating
Whether algorithms are supporting or fighting the move
This dashboard helps traders:
Avoid chop
Stay out of low‑quality setups
Time entries with institutional flows
Improve win rate by trading the right setups at the right times
Final Notes
Works on any symbol or timeframe
Fully customizable colors
Two clean visual tables: Internals + Trade Playbook
Ideal for futures, ETFs, and options day traders
If you enjoy this tool, please like, comment, or follow. More enhancements are coming.
Trade smart.
Market Regime & Bias Assistant [Prototype v1.1]
Market Regime & Bias Assistant
### **Overview**
The **Market Regime & Bias Assistant** is an all-in-one trend filtration and trading system designed to keep traders on the right side of the market. Instead of relying on a single moving average, this indicator combines **ADX (Trend Strength)**, **Multi-Timeframe EMAs**, **RSI**, and **Volume Spread Analysis (VSA)** concepts to generate a quantitative "Confidence Score" for the current market bias.
It automatically adapts its settings based on your timeframe (Intraday vs. Swing) and provides clear visual cues via background shading, candle coloring, and a data panel.
---
### **Key Features**
* **Auto-Adaptive Modes:** Automatically switches between "Intraday" and "Swing" settings based on your timeframe.
* *Intraday:* Uses faster EMAs (Aggressive 9/30 or Conservative 20/50) and VWAP.
* *Swing:* Uses standard 20/50 EMAs with 200/800 long-term context moving averages.
* **Market Regime Detection:** Identifies if the market is in a **Trend (Bull/Bear)** or a **Range (Neutral)** using a combination of ADX thresholds and EMA alignment.
* **Confidence Scoring (0-100):** A proprietary algorithm that scores the quality of the trend based on RSI alignment, Volume confirmation, and Long-term EMA context.
* **Vector Volume Candles:** Color-coded candles to highlight institutional activity (High Volume) vs. Climactic Volume (Exhaustion).
* **Pullback Signals:** "L" and "S" markers indicating high-probability entries after a pullback into the EMA value zone.
* **Data Dashboard:** A bottom-right panel displaying the current Mode, Regime, Bias, and quantitative Confidence Score.
---
### **How to Read the Visuals**
#### **1. Background Colors (The Regime)**
* **Green Background:** Confirmed **Bullish Trend**. Only look for Longs.
* **Red Background:** Confirmed **Bearish Trend**. Only look for Shorts.
* **Gray Background:** **Neutral / Range**. The market is chopping or consolidating. Stand aside or trade strictly mean-reversion.
#### **2. Candle Colors (Vector Volume)**
* **Green/Red Borders:** Normal volume.
* **Blue / Fuchsia:** **High Volume (1.2x Average)**. Indicates institutional interest or a breakout.
* **Lime / Bright Red:** **Climactic Volume (1.8x Average)**. Indicates potential exhaustion or a stopping volume event.
#### **3. The EMAs**
* **Fast/Slow Lines:** Show the immediate trend direction.
* **Gray/White Lines:** The 200 and 800 EMAs. These act as major support/resistance levels and define the "Big Picture" bias.
* **Lime Line (Intraday Only):** The VWAP (Volume Weighted Average Price).
---
### **How to Use This Indicator**
**Step 1: Check the Regime**
Look at the background color and the Dashboard panel. Is the Trend Strength "Strong" or "Very Strong"?
* *Rule:* Do not take trend-following trades if the Regime is "Range/Neutral."
**Step 2: Check the Confidence**
The dashboard calculates a score from 0 to 100.
* **High Confidence (>67):** All systems go. Alignment of RSI, Volume, and Trend.
* **Medium Confidence (34-66):** Caution warranted. Usually implies divergence in RSI or low volume.
* **Low Confidence (<34):** The trend is weak or failing.
**Step 3: Wait for the Setup (The Arrows)**
The indicator looks for pullbacks into the "Value Zone" (the space between the Fast and Slow EMA).
* **Triangle Up (L):** Appears when price pulls back into the zone during a Bull trend, then bounces out with volume confirmation.
* **Triangle Down (S):** Appears when price rallies into the zone during a Bear trend, then rejects lower.
---
### **Settings & Customization**
* **Mode:** Default is "Auto," but you can force "Intraday" or "Swing" manually.
* **Intraday Style:** Choose between "Aggressive" (9 EMA / 30 EMA) for scalping or "Conservative" (20 EMA / 50 EMA) for day trading.
* **ADX Threshold:** Adjusts how strict the trend filter is (Default: 20).
* **Visual Toggles:** Turn off/on the Panel, Background shading, or Vector candles to clean up your chart.
### **Alerts**
This script comes with built-in alert conditions for:
1. **Bullish Regime Start**
2. **Bearish Regime Start**
3. **High-Confidence Setup Detected**
Vdubus Divergence Wave Pattern Generator V1The Vdubus Divergence Wave Theory
10 years in the making & now finally thanks to AI I have attempted to put my Trading strategy & logic into a visual representation of how I analyse and project market using Core price action & MacD. Enjoy :)
A Proprietary Structural & Momentum Confluence SystemPart 1: The Strategic Concept1. The Core Philosophy: "Geometry + Physics"Traditional technical analysis often fails because traders confuse location with timing.Geometry (Price Patterns): Tells us WHERE the market is likely to reverse (e.g., at a resistance level or harmonic D-point).Physics (Momentum): Tells us WHEN the energy driving the trend has actually shifted. The Vdubus Theory posits that a trade should never be taken based on Geometry alone. A valid signal requires a specific, fractal decay in momentum—a "Handshake" between price structure and energy exhaustion.2. The 3-Wave Momentum Filter (The Engine)Most traders look for simple divergence (2 points). The Vdubus Theory demands a 3-Wave Structure to confirm the true state of the market.A. The Standard Reversal (Exhaustion)This is the "Safe" entry, catching the slow death of a trend.Wave 1 $\rightarrow$ 2 (The Warning): Price pushes higher, but momentum is lower (Standard Divergence). This signals that the trend is tapping the brakes.Wave 2 $\rightarrow$ 3 (The Confirmation): Price pushes to a final extreme (often a stop-hunt), but momentum is flat or lower than Wave 2 ("No Divergence").The Logic: This confirms that the buyers have expended all remaining energy. The engine is dead.
B. The Climax Reversal (The Trap)This is the "Aggressive" entry, catching V-shape reversals.Wave 1 $\rightarrow$ 2 (The Bait): Price pushes higher, and momentum is Stronger/Higher (No Divergence). This sucks in retail traders who believe the trend is accelerating.Wave 2 $\rightarrow$ 3 (The Snap): Price pushes again, but momentum suddenly collapses (Divergence).The Logic: A "Strong to Weak" shift. The market traps traders with a show of strength before hitting a "concrete wall" of limit orders.C. The Predator (The Trend Continuation)The Logic: Trends rarely move in straight lines. The "Predator" looks for Hidden Divergence during a pullback.The Signal: Price makes a Higher Low (Trend Structure Intact), but Momentum makes a Lower Low (Oversold Trap). This signals the end of the correction and the resumption of the main trend.3. The "Clean Path" PrincipleA trade is only valid if there is no opposing force. If you are looking to Sell (Bearish Reversal), the opposing Bullish momentum must be weak or neutral. If the "Enemy" is strong, the trade is skipped.
Part 2: The Indicator Breakdown
Tool Name: Vdubus Divergence Wave Pattern Generator V1
This script automates your analysis by combining ZigZag Pattern Recognition (Geometry) with your Custom MACD Logic (Physics).
1. The "Golden" Settings
The physics engine is tuned to your specific discovery:
Fast Length: 8
Slow Length: 21
Signal Length: 5
Lookback: 3 (Sensitive enough to catch the exact pivot points).
2. Signal Generation Logic
The indicator scans for four distinct setups. Here is the exact logic code translated into English:
Signal 1: Standard Reversal (Green/Red Pattern)
Geometry: The ZigZag algorithm identifies a 5-point structure (X-A-B-C-D), such as a Gartley, Bat, or Butterfly.
Physics Check:
Finds the last 3 momentum peaks matching the price highs.
Rule: Momentum Peak 2 must be < Peak 1 (Divergence).
Rule: Momentum Peak 3 must be <= Peak 2 (Confirmation/No Div).
Output: Draws the colored pattern and labels it (e.g., "Bearish Gartley (Exhaustion)").
Signal 2: Climax Reversal (Orange Pattern)
Geometry: Identifies the same 5-point structures.
Physics Check:
Rule: Momentum Peak 2 is >= Peak 1 (Strength/No Div).
Rule: Momentum Peak 3 is < Peak 2 (Sudden Failure/Div).
Output: Draws the pattern in Orange labeled "⚠️ CLIMAX REVERSAL". This is your "Trap" detector.
Signal 3: Rounded Top/Bottom (Navy/Maroon Label)
Geometry: Price is compressing or rounding over.
Physics Check:
Scans for 4 consecutive waves of momentum decay.
Rule: Peak 1 > Peak 2 > Peak 3 > Peak 4.
Output: Places a label indicating a "Multi-Wave Decay," identifying turns that don't have sharp pivots.
Signal 4: The Predator (Purple Pattern)
Geometry: Identifies a trend pullback (Higher Low for Buys).
Physics Check:
Rule: Momentum makes a Lower Low while Price makes a Higher Low (Hidden Divergence).
Output: Draws a Purple pattern labeled "🦖 PREDATOR" to signal trend continuation.
3. The Confluence Dashboard
Located in the corner of the screen, this provides a final "Safety Check."
Logic: It compares the absolute value (strength) of the most recent Bearish Momentum Peak vs. the most recent Bullish Momentum Low.
Output:
Green (Bulls Strong): Buying pressure is dominant. Safe to Buy, Dangerous to Sell.
Red (Bears Strong): Selling pressure is dominant. Safe to Sell, Dangerous to Buy.
Grey (Neutral): Forces are balanced.
Summary of Potential
This system solves the "Trader's Dilemma" of entering too early or too late. By waiting for the 3rd Wave, you effectively filter out the market noise and only commit capital when the opposing side has structurally and physically collapsed. It transforms trading from a guessing game into a disciplined execution of identifying Geometric Exhaustion.
Logic 1 / PREVIOUS DIVERGENCE PROJECTS future TREND BREAKS / Reversals *Not in script*
Logic 2 / Wave 1 to 2 = Divergence / Wave 2 to 3 = NO divergence = Signal
Reverse logic: Wave 1 to 2 = NO Divergence / Wave 2 to 3 = Divergence = Signal
One for AllOne for All (OFA) - Complete ICT Analysis Suite
Version 3.3.0 by theCodeman
📊 Overview
One for All (OFA) is a comprehensive TradingView indicator designed for traders who follow Inner Circle Trader (ICT) concepts. This all-in-one tool combines essential ICT analysis features—sessions, kill zones, previous period levels, and higher timeframe candles with Fair Value Gaps (FVGs) and Volume Imbalances (VIs)—into a single, highly customizable indicator. Whether you're a beginner learning ICT concepts or an experienced trader refining your edge, OFA provides the visual structure needed for precise market analysis and execution.
✨ Key Features
- 🏷️ Customizable Watermark**: Display your trading identity with customizable titles, subtitles, symbol info, and full style control
- 🌍 Trading Sessions**: Visualize Asian, London, and New York sessions with high/low lines, range boxes, and open/close markers
- 🎯 Kill Zones**: Highlight 5 critical ICT kill zones with precise timing and visual boxes
- 📈 Previous Period H/L**: Track Daily, Weekly, and Monthly highs/lows with customizable styles and lookback periods
- 🕐 Higher Timeframe Candles**: Display up to 5 HTF timeframes with OHLC trace lines, timers, and interval labels
- 🔍 FVG & VI Detection**: Automatically detect and visualize Fair Value Gaps and Volume Imbalances on HTF candles
- ⚙️ Universal Timezone Support**: Works globally with GMT-12 to GMT+14 timezone selection
- 🎨 Full Customization**: Control colors, styles, visibility, and layout for every feature
🚀 How to Use
Watermark Setup
The watermark overlay helps you identify your charts and maintain focus on your trading principles:
1. Enable/disable watermark via "Show Watermark" toggle
2. Customize the title (default: "Name") to display your trading name or account identifier
3. Set up to 3 subtitles (default: "Patience", "Confidence", "Execution") as trading reminders
4. Choose position (9 locations available), size, color, and transparency
5. Toggle symbol and timeframe display as needed
Use Case: Display your trading principles or account name for multi-monitor setups or content creation.
Trading Sessions Analysis
Sessions define market character and liquidity availability:
1. Enable "Show All Sessions" to visualize all three sessions
2. Adjust timezone to match your local market (default: UTC-5 for EST)
3. Customize session times if needed (defaults cover standard hours)
4. Enable session range boxes to see consolidation zones
5. Use session high/low lines to identify key levels for the current session
6. Enable open/close markers to track session transitions
Use Case: Identify which session you're trading in, track session highs/lows for liquidity, and anticipate session transition volatility.
Kill Zones Trading
Kill zones are ICT's high-probability trading windows:
1. Enable individual kill zones or use "Show All Kill Zones"
2. **Asian Kill Zone** (2000-0000 GMT): Early positioning and smart money accumulation
3. **London Kill Zone** (0300-0500 GMT): European market opening volatility
4. **NY AM Kill Zone** (0930-1100 EST): Post-NYSE open expansion
5. **NY Lunch Kill Zone** (1200-1300 EST): Midday consolidation or manipulation
6. **NY PM Kill Zone** (1330-1600 EST): Afternoon positioning and closes
7. Customize colors and times to match your trading style
8. Set max days display to control historical visibility (default: 30 days)
Use Case: Focus entries during high-probability windows. Watch for liquidity sweeps at kill zone openings and institutional positioning.
Previous Period High/Low Levels
Previous period levels act as magnetic price targets and support/resistance:
1. Enable Daily (PDH/PDL), Weekly (PWH/PWL), or Monthly (PMH/PML) levels individually
2. Set lookback period (how many previous periods to display)
3. Choose line style: Solid (current emphasis), Dashed (standard), or Dotted (subtle)
4. Customize colors per timeframe for visual hierarchy
5. Adjust line width (1-5) for visibility preference
6. Enable gradient effect to fade older periods
7. Position labels left or right based on chart layout
8. Customize label text for your preferred notation
Use Case: Identify key levels where price is likely to react. Daily levels work on intraday timeframes, Weekly on daily charts, Monthly for swing trading.
Higher Timeframe (HTF) Candles
HTF candles reveal the larger market context while trading lower timeframes:
1. Enable up to 5 HTF slots simultaneously (default: 5m, 15m, 1H, 4H, Daily)
2. Choose display mode: "Below Chart" (stacked rows) or "Right Side" (compact column)
3. Customize timeframe, colors (bull/bear), and titles for each slot
4. **OHLC Trace Lines**: Visual lines connecting HTF candle levels to chart bars
5. **HTF Timer**: Countdown showing time remaining until HTF candle close
6. **Interval Labels**: Display day of week (Daily+) or time (intraday) on each candle
7. For Daily candles: Choose open time (Midnight, 8:30, 9:30) to match your market structure preference
Use Case: Trade lower timeframes while respecting higher timeframe structure. Watch for HTF candle closes to confirm directional bias.
FVG & VI Detection
Fair Value Gaps and Volume Imbalances highlight inefficiencies that price often revisits:
1. **Fair Value Gaps (FVGs)**: Detected when HTF candle wicks don't overlap between 3 consecutive candles
- Bullish FVG: Gap between candle 1 high and candle 3 low (green box by default)
- Bearish FVG: Gap between candle 1 low and candle 3 high (red box by default)
2. **Volume Imbalances (VIs)**: Similar detection but focuses on body gaps
- Bullish VI: Gap between candle 1 close and candle 3 open
- Bearish VI: Gap between candle 1 open and candle 3 close
3. Enable FVG/VI detection per HTF slot individually
4. Customize colors and transparency for each imbalance type
5. Boxes appear on chart at formation and remain visible as retracement targets
**Use Case**: Identify high-probability retracement zones. Price often returns to fill FVGs and VIs before continuing the trend. Use as entry zones or profit targets.
🎨 Customization
OFA is built for flexibility. Every feature includes extensive customization options:
Visual Customization
- **Colors**: Independent color control for every element (sessions, kill zones, lines, labels, FVGs, VIs)
- **Transparency**: Adjust box and label transparency (0-100%) for clean charts
- **Line Styles**: Choose Solid, Dashed, or Dotted for previous period lines
- **Sizes**: Control text size, line width, and box borders
- **Positions**: Place watermark in 9 positions, labels left/right
Layout Control
- **HTF Display Mode**: "Below Chart" for detailed analysis, "Right Side" for space efficiency
- **Drawing Limits**: Set max days for sessions/kill zones to manage chart clutter
- **Lookback Periods**: Control how many previous periods to display (1-10)
- **Gradient Effects**: Enable fading for older previous period lines
Timing Adjustments
- **Timezone**: Universal GMT offset selector (-12 to +14) for global markets
- **Session Times**: Customize each session's start/end times
- **Kill Zone Times**: Adjust kill zone windows to match your market's characteristics
- **Daily Open**: Choose Midnight, 8:30, or 9:30 for Daily HTF candle open time
💡 Best Practices
1. Start Simple: Enable one feature at a time to learn how each element affects your analysis
2. Match Your Timeframe: Use Daily levels on intraday charts, Weekly on daily charts, HTF candles one or two levels above your trading timeframe
3. Kill Zone Focus: Concentrate your trading activity during kill zones for higher probability setups
4. HTF Confirmation: Wait for HTF candle closes before committing to directional bias
5. FVG/VI Entries: Look for price to return to unfilled FVGs/VIs for entry opportunities with favorable risk/reward
6. Customize Colors: Use a consistent color scheme that matches your chart theme and reduces visual fatigue
7. Reduce Clutter: Disable features you're not actively using in your current trading plan
8. Session Context: Understand which session controls the market—trade with session direction or anticipate reversals at session transitions
⚙️ Settings Guide
OFA organizes settings into logical groups for easy navigation:
- **═══ WATERMARK ═══**: Title, subtitles, position, style, symbol/timeframe display
- **═══ SESSIONS ═══**: Enable/disable sessions, times, colors, high/low lines, boxes, markers
- **═══ KILL ZONES ═══**: Individual kill zone toggles, times, colors, max days display
- **═══ PREVIOUS H/L - DAILY ═══**: Daily high/low lines, style, color, lookback, labels
- **═══ PREVIOUS H/L - WEEKLY ═══**: Weekly high/low lines, style, color, lookback, labels
- **═══ PREVIOUS H/L - MONTHLY ═══**: Monthly high/low lines, style, color, lookback, labels
- **═══ HTF CANDLES ═══**: Global display mode, layout settings
- **═══ HTF SLOT 1-5 ═══**: Individual HTF configuration (timeframe, colors, title, FVG/VI detection, trace lines, timer, interval labels)
Each setting includes tooltips explaining its function. Hover over any input for detailed guidance.
📝 Final Notes
One for All (OFA) represents a complete ICT analysis toolkit in a single indicator. By combining watermark customization, session visualization, kill zone highlighting, previous period levels, and higher timeframe candles with FVG/VI detection, OFA eliminates the need for multiple indicators cluttering your chart.
**Version**: 3.3.0
**Author**: theCodeman
**Pine Script**: v6
**License**: Mozilla Public License 2.0
Start with default settings to learn the indicator's structure, then customize extensively to match your personal trading style. Remember: tools provide information, but your edge comes from disciplined execution of a proven strategy.
Happy Trading! 📈
IU Momentum OscillatorDESCRIPTION:
The IU Momentum Oscillator is a specialized trend-following tool designed to visualize the raw "energy" of price action. Unlike traditional oscillators that rely solely on closing prices relative to a range (like RSI), this indicator calculates momentum based on the ratio of bullish candles over a specific lookback period.
This "Neon Edition" has been engineered with a focus on visual clarity and aesthetic depth. It utilizes "Shadow Plotting" to create a glowing effect and dynamic "Trend Clouds" to highlight the strength of the move. The result is a clean, modern interface that allows traders to instantly gauge market sentiment—whether the bulls or bears are in control—without cluttering the chart with complex lines.
USER INPUTS:
- Momentum Length (Default: 20): The number of past candles analyzed to count bullish occurrences.
- Momentum Smoothing (Default: 20): An SMA filter applied to the raw data to reduce noise and provide a cleaner wave.
- Signal Line Length (Default: 5): The length of the EMA signal line used to generate crossover signals and the "Trend Cloud."
- Overbought / Oversold Levels (Default: 60 / 40): Thresholds that define extreme market conditions.
- Colors: Fully customizable Neon Cyan (Bullish) and Neon Magenta (Bearish) inputs to match your chart theme.
LONG CONDITION:
- Signal: A Buy signal is indicated by a small Cyan Circle.
- Logic: Occurs when the Main Momentum Line (Glowing) crosses ABOVE the Grey Signal Line.
- Visual Confirmation: The "Trend Cloud" turns Cyan and expands, indicating that bullish momentum is accelerating relative to the recent average.
SHORT CONDITIONS:
- Signal: A Sell signal is indicated by a small Magenta Circle.
- Logic: Occurs when the Main Momentum Line (Glowing) crosses BELOW the Grey Signal Line.
- Visual Confirmation: The "Trend Cloud" turns Magenta, indicating that bearish pressure is increasing.
WHY IT IS UNIQUE:
1. Candle-Count Logic: Most oscillators calculate price distance. This indicator calculates price participation (how many candles were actually green vs red). This offers a different perspective on trend sustainability.
2. Optimized Performance: The script uses math.sum functions rather than heavy for loops, ensuring it loads instantly and runs smoothly on all timeframes.
3. Visual Hierarchy: It uses dynamic gradients and transparency (Alpha channels) to create a "Glow" and "Cloud" effect. This makes the chart easier to read at a glance compared to flat, single-line oscillators.
HOW USER CAN BENEFIT FROM IT:
- Trend Confirmation: Traders can use the "Trend Cloud" to stay in trades longer. As long as the cloud is thick and colored, the trend is strong.
- Divergence Spotting: Because this calculates momentum differently than RSI, it can often show divergences (price goes up, but the count of bullish candles goes down) earlier than standard tools.
- Scalping: The crisp crossover signals (Circles) provide excellent entry triggers for scalpers on lower timeframes when combined with key support/resistance levels.
DISCLAIMER:
This source code and the information presented here are for educational and informational purposes only. It does not constitute financial, investment, or trading advice.
Trading in financial markets involves a high degree of risk and may not be suitable for all investors. You should not rely solely on this indicator to make trading decisions. Always perform your own due diligence, manage your risk appropriately, and consult with a qualified financial advisor before executing any trades.
YM Ultimate SNIPER v5# YM Ultimate SNIPER v5 - Documentation & Trading Guide
## 🎯 Unified GRA + DeepFlow | YM/MYM Optimized
**TARGET: 3-7 High-Confluence Trades per Day**
---
## ⚡ QUICK START
```
┌─────────────────────────────────────────────────────────────────┐
│ YM ULTIMATE SNIPER v5 │
├─────────────────────────────────────────────────────────────────┤
│ │
│ SIGNALS: │
│ S🎯 = S-Tier (50+ pts) → HOLD position │
│ A🎯 = A-Tier (25-49 pts) → SWING trade │
│ B🎯 = B-Tier (12-24 pts) → SCALP quick │
│ Z = Zone entry (price at FVG zone) │
│ │
│ SESSIONS (ET): │
│ LDN = 3:00-5:00 AM (London) │
│ NY = 9:30-11:30 AM (New York Open) │
│ PWR = 3:00-4:00 PM (Power Hour) │
│ │
│ COLORS: │
│ 🟩 Green zones = Bullish FVG (buy zone) │
│ 🟥 Red zones = Bearish FVG (sell zone) │
│ 🟣 Purple lines = Single prints (S/R levels) │
│ │
│ TABLE (Top Right): │
│ Pts = Candle point range │
│ Tier = S/A/B/X classification │
│ Vol = Volume ratio (green = good) │
│ Delta = Buy/Sell dominance │
│ Sess = Current session │
│ Zone = In FVG zone status │
│ Score = Confluence score /10 │
│ CVD = Cumulative delta direction │
│ R:R = Risk:Reward ratio │
│ │
└─────────────────────────────────────────────────────────────────┘
```
---
## 📋 VERSION 5 CHANGES
### What's New
- **Removed all imbalance code** - caused compilation errors
- **Simplified delta analysis** - uses candle structure instead of intrabar data
- **Cleaner confluence scoring** - 5 clear factors, max 10 points
- **Reliable table** - updates on last bar only, no flickering
- **Works on YM and MYM** - same logic applies to micro contracts
### Removed Features
- Candle-anchored imbalance markers
- Imbalance S/R zones
- Intrabar volume profile analysis
- POC visualization
### Kept & Improved
- Tier classification (S/A/B)
- FVG zone detection & visualization
- Single print detection
- Session windows with backgrounds
- Confluence scoring
- Stop/Target auto-calculation
- All alerts
---
## 🎯 SIGNAL TYPES
### Tier Signals (S🎯, A🎯, B🎯)
These are high-confluence signals that pass all filters:
| Tier | Points | Value/Contract | Action | Hold Time |
|------|--------|----------------|--------|-----------|
| **S** | 50+ | $250+ | HOLD | 2-5 min |
| **A** | 25-49 | $125-245 | SWING | 1-3 min |
| **B** | 12-24 | $60-120 | SCALP | 30-90 sec |
**Filters Required:**
1. Tier threshold met (points)
2. Volume ≥ 1.8x average
3. Delta dominance ≥ 62%
4. Body ratio ≥ 70%
5. Range ≥ 1.3x average
6. Proper wicks (no reversal wicks)
7. CVD confirmation (optional)
8. In trading session
### Zone Signals (Z)
Zone entries trigger when:
- Price is inside an FVG zone
- Delta shows dominance in zone direction
- Volume is above average
- In active session
- No tier signal already present
---
## 📊 CONFLUENCE SCORING
**Maximum Score: 10 points**
| Factor | Points | Condition |
|--------|--------|-----------|
| Tier | 1-3 | B=1, A=2, S=3 |
| In Zone | +2 | Price inside FVG zone |
| Strong Volume | +2 | Volume ≥ 2x average |
| Strong Delta | +2 | Delta ≥ 70% |
| CVD Momentum | +1 | CVD trending with signal |
**Score Interpretation:**
- **7-10**: Elite setup - full size
- **5-6**: Good setup - standard size
- **4**: Minimum threshold - reduced size
- **< 4**: No signal shown
---
## ⏰ SESSION WINDOWS
### London (3:00-5:00 AM ET)
- European institutional flow
- Character: Slow build-up, clean trends
- Expected trades: 1-2
- Best for: Zone entries, A/B tier
### NY Open (9:30-11:30 AM ET)
- Highest volume, most institutional activity
- Character: Initial balance, breakouts
- Expected trades: 2-3
- Best for: S/A tier, zone confluence
### Power Hour (3:00-4:00 PM ET)
- End-of-day rebalancing, MOC orders
- Character: Mean reversion or trend acceleration
- Expected trades: 1-2
- Best for: Zone entries, B tier scalps
---
## 🟩 FVG ZONES
### What Are FVG Zones?
Fair Value Gaps (FVGs) are price gaps between candles where price moved so fast that a gap was left. These gaps often act as support/resistance.
### Zone Requirements
- Gap size ≥ 25% of ATR
- Impulse candle has strong body (≥ 70%)
- Impulse candle is 1.5x average range
- Volume above average on impulse
- Created during active session
### Zone States
1. **Fresh** (bright color) - Just created, untested
2. **Tested** (gray) - Price touched zone midpoint
3. **Broken** (removed) - Price closed through zone
### Trading FVG Zones
| Zone | Approach From | Expected |
|------|--------------|----------|
| 🟩 Bull | Above (falling) | Support - look for bounce |
| 🟥 Bear | Below (rising) | Resistance - look for rejection |
---
## 🟣 SINGLE PRINTS
Single prints mark candles with:
- Range > 1.3x average
- Body > 70% of range
- Volume > 1.8x average
- Clear delta dominance
These become horizontal support/resistance lines extending into the future.
---
## 📊 TABLE REFERENCE
| Row | Label | Meaning |
|-----|-------|---------|
| 1 | Pts | Current candle point range |
| 2 | Tier | S/A/B/X classification |
| 3 | Vol | Volume ratio vs 20-bar average |
| 4 | Delta | Buy/Sell percentage dominance |
| 5 | Sess | Current session (LDN/NY/PWR/OFF) |
| 6 | Zone | In FVG zone (BULL/BEAR/---) |
| 7 | Score | Confluence score out of 10 |
| 8 | CVD | Delta momentum direction |
| 9 | R:R | Risk:Reward if signal active |
### Color Coding
- **Green/Lime**: Good, meets threshold
- **Yellow**: Caution, borderline
- **Red**: Bad, below threshold
- **Gray**: Inactive/neutral
---
## 🔧 SETTINGS GUIDE
### Tier Thresholds
| Setting | Default | Notes |
|---------|---------|-------|
| S-Tier | 50 pts | ~$250/contract |
| A-Tier | 25 pts | ~$125/contract |
| B-Tier | 12 pts | ~$60/contract |
### Sniper Filters
| Setting | Default | Notes |
|---------|---------|-------|
| Min Volume Ratio | 1.8x | Lower = more signals |
| Delta Dominance | 62% | Lower = more signals |
| Body Ratio | 70% | Higher = fewer, cleaner |
| Range Multiplier | 1.3x | Higher = fewer, bigger moves |
| CVD Confirm | On | Off = more signals |
### Recommended Configurations
**Conservative (3-4 trades/day):**
```
Min Confluence: 6
Volume Ratio: 2.0
Delta Threshold: 65%
Body Ratio: 75%
```
**Standard (5-7 trades/day):**
```
Min Confluence: 4
Volume Ratio: 1.8
Delta Threshold: 62%
Body Ratio: 70%
```
**Aggressive (7-10 trades/day):**
```
Min Confluence: 3
Volume Ratio: 1.5
Delta Threshold: 60%
Body Ratio: 65%
```
---
## ✓ ENTRY CHECKLIST
Before entering any trade:
1. ☐ Signal present (S🎯, A🎯, B🎯, or Z)
2. ☐ Session active (LDN, NY, or PWR)
3. ☐ Score ≥ 4 (preferably 6+)
4. ☐ Vol shows GREEN
5. ☐ Delta colored (not gray)
6. ☐ CVD arrow matches direction
7. ☐ Note stop/target lines
8. ☐ Execute at signal candle close
---
## ⛔ DO NOT TRADE
- Session shows "OFF"
- Score < 4
- Vol shows RED
- Delta gray (no dominance)
- Multiple conflicting signals
- Major news imminent (FOMC, NFP, CPI)
- Overnight session (11:30 PM - 3:00 AM ET)
---
## 🎯 POSITION SIZING
| Tier | Score | Size | Stop |
|------|-------|------|------|
| S (50+ pts) | 7+ | 100% | Below/above candle |
| A (25-49 pts) | 5-6 | 75% | Below/above candle |
| B (12-24 pts) | 4 | 50% | Below/above candle |
| Zone | Any | 50% | Beyond zone |
---
## 🚨 ALERTS
### Priority Alerts (Set These)
| Alert | Action |
|-------|--------|
| 🎯 S-TIER | Drop everything, check immediately |
| 🎯 A-TIER | Evaluate within 15 seconds |
| 🎯 B-TIER | Check if available |
| 🎯 ZONE | Good context entry |
### Info Alerts (Optional)
| Alert | Purpose |
|-------|---------|
| NEW BULL/BEAR FVG | Mark zones on mental map |
| SINGLE PRINT | Note for future S/R |
| SESSION OPEN | Prepare to trade |
---
## 📈 TRADE JOURNAL
```
DATE: ___________
SESSION: ☐ LDN ☐ NY ☐ PWR
TRADE:
├── Time: _______
├── Signal: S🎯 / A🎯 / B🎯 / Z
├── Direction: LONG / SHORT
├── Score: ___/10
├── Entry: _______
├── Stop: _______
├── Target: _______
├── In Zone: ☐ Yes ☐ No
├── Result: +/- ___ pts ($_____)
└── Notes: _______________________
DAILY:
├── Trades: ___
├── Wins: ___ | Losses: ___
├── Net P/L: $_____
└── Best setup: _______________________
```
---
## 🏆 GOLDEN RULES
> **"Wait for the session. Off-hours = noise."**
> **"Score 6+ is your edge. Anything less is gambling."**
> **"Zone + Tier = bread and butter combo."**
> **"One great trade beats five forced trades."**
> **"Leave every trade with money. YM gives you time."**
---
## 🔧 TROUBLESHOOTING
| Issue | Solution |
|-------|----------|
| No signals | Lower min score to 3-4 |
| Too many signals | Raise min score to 6+ |
| Zones cluttering | Reduce max zones to 8 |
| Missing sessions | Check timezone setting |
| Table not updating | Resize chart or refresh |
---
## 📝 TECHNICAL NOTES
- **Pine Script v6**
- **Works on**: YM, MYM, any Dow futures
- **Recommended TF**: 1-5 minute for day trading
- **Min TradingView Plan**: Free (no intrabar data required)
---
*© Alexandro Disla - YM Ultimate SNIPER v5*
*Clean Build | Proven Components Only*
VB-MainLiteVB-MainLite – v1.0 Initial Release
Overview
VB-MainLite is a consolidated market-structure and execution framework designed to streamline decision-making into a single chart-level view. The script combines multi-timeframe trend, volatility, volume, and liquidity signals into one cohesive visual layer, reducing indicator clutter while preserving depth of information for active traders.
Core Architecture
Trend Backbone – EMA 200
Dedicated EMA 200 acts as the primary trend filter and higher-timeframe bias reference.
Serves as the “spine” of the system for contextualizing all secondary signals (swings, reversals, volume events, etc.).
Custom MA Suite (Envelope Ready)
Four configurable moving averages with flexible source, length, and smoothing.
Default configuration (preset idea: “8/89 Envelope”):
MA #1: EMA 8 on high
MA #2: EMA 8 on low
MA #3: EMA 89 on high
MA #4: EMA 89 on low
All four are disabled by default to keep the chart minimal. Users can toggle them on from the Custom MAs group for envelope or cloud-style configurations.
Nadaraya–Watson Smoother (Swing Framework)
Gaussian-kernel Nadaraya–Watson regression applied to price (hl2) to build a smooth synthetic curve.
Two layers of functionality:
Swing labels (▲ / ▼) at inflection points in the smoothed curve.
Optional curve line that visually tracks the turning structure over the last ~500 bars.
Designed to surface early swing potential before standard MAs react.
Hull Moving Average (Trend Overlay)
Optional Hull MA (HMA) for faster trend visualization.
Color-coded by slope (buy/sell bias).
Default: off to prevent overloading the chart; can be enabled under Hull MA settings.
Momentum, Exhaustion & Pattern Engine
CCI-Based Bar Coloring
CCI applied to close with configurable thresholds.
Overbought / oversold CCI zones map directly into candle coloring to visually highlight short-term momentum extremes.
RSI Top / Bottom Exhaustion Finder
RSI logic applied separately to high-driven (tops) and low-driven (bottoms) sequences.
Plots:
Top arrows where high-side RSI stretches into high-risk territory.
Bottom arrows where low-side RSI indicates exhaustion on the downside.
Useful as confluence around the Nadaraya swing turns and EMA 200 regime.
Engulfing + MA Trend Engine (“Fat Bull / Fat Bear”)
Detects bullish and bearish engulfing patterns, then combines them with MA trend cross logic.
Only when both pattern and MA regime align does the engine flag:
Fat Bull (Engulf + MA aligned long)
Fat Bear (Engulf + MA aligned short)
Candles are marked via conditional barcolor to highlight strong, structured shifts in control.
Fat Finger Detection (Wick Spikes / Stop Runs)
Identifies abnormal wick extensions relative to the prior bar’s body range with configurable tolerance.
Supports detection of potential liquidity grabs, stop runs, or “excess” that may precede reversals or mean-reversion behavior.
Volume & Liquidity Intelligence
Bull Snort (Aggressive Buy Spikes)
Flags events where:
Volume is significantly above the 50-period average, and
Price closes in the upper portion of the bar and above prior close.
Plots a labeled marker below the bar to indicate aggressive upside initiative by buyers.
Pocket Pivots (Accumulation Flags)
Compares current volume vs prior 10 sessions with a filter on prior “up” days.
Highlights pocket pivot days where current green candle volume outclasses recent down-day volumes, suggesting stealth accumulation.
Delta Volume Core (Directional Volume by Price)
Internal volume-by-price style engine over a user-defined lookback.
Splits volume into up-close and down-close buckets across dynamic price bins.
Feeds into S&R and ICT zone logic to quantify where buying vs selling pressure built up.
Structural Context: S&R and ICT Zones
S&R Power Channel
Computes local high/low band over a configurable lookback window.
Renders:
Upper and lower S&R channel lines.
Shaded support / resistance zones using boxes.
Adds Buy Power / Sell Power metrics based on the ratio of up vs down bars inside the window, displayed directly in the zone overlays.
Drops ◈ markers where price interacts dynamically with the top or bottom band, highlighting reaction points.
ICT-Style Premium / Discount & Macro Zones
Two tiered structures:
Local Premium / Discount zones over a shorter SR window.
Macro Premium / Discount zones over a longer macro window.
Each zone:
Uses underlying directional volume to annotate accumulation vs distribution bias.
Provides Delta Volume Bias shading in the mid-band region, visually encoding whether local power flows are net-buying or net-selling.
Enables traders to quickly see whether current trade location is in a local/macro discount or premium context while still respecting volume profile.
Positioning Intelligence: PCD (Stocks)
Position Cost Distribution (PCD) – Stocks Only
Available for stock symbols on intraday up to daily timeframe (≤ 1D).
Uses:
TOTAL_SHARES_OUTSTANDING fundamentals,
Daily OHLCV snapshot, and
A bucketed distribution engine
to approximate cost basis distribution across price.
Outputs:
Horizontal “PCD bars” to the right of current price, density-scaled by estimated share concentration.
Color-coding by profitability relative to current price (profitable vs unprofitable positions).
Labels for:
Current price
Average cost
Profit ratio (share % below current price)
90% cost range
70% cost range
Range overlap as a measure of clustering / concentration.
Multi-Timeframe Trend: Two-Pole Gaussian Dashboard
Two-Pole Gaussian Filter (Line + Cloud)
Smooths a user-selected source (default: close) using a two-pole Gaussian filter with tunable alpha.
Plots:
A thin Gaussian trend line, and
A thick Gaussian “cloud” line with transparency, colored by slope vs past (offsetG).
Functions as a responsive trend backbone that is more sensitive than EMA 200 but less noisy than raw price.
Multi-Timeframe Gaussian Dashboard
Evaluates Gaussian trend direction across up to six timeframes (e.g., 1H / 2H / 4H / Daily / Weekly).
Renders a compact bottom-right table:
Header: symbol + overall bias arrow (up / down) based on average trend alignment.
Row of colored cells per timeframe (green for uptrend, magenta for downtrend) with human-readable TF labels (e.g., “60M”, “4H”, “1D”).
Gives an immediate read on whether intraday, swing, and higher-timeframe flows are aligned or fragmented.
Default Configuration & Usage Guidance
Default state after adding the script:
Enabled by default:
EMA 200 trend backbone
Nadaraya–Watson swing labels and curve
CCI bar coloring
RSI top/bottom arrows
Fat Bull / Fat Bear engine
Bull Snort & Pocket Pivots
S&R Power Channel
ICT Local + Macro zones
Two-pole Gaussian line + cloud + dashboard
PCD engine for stocks (auto-active where data is available)
Disabled by default (opt-in):
Custom MA suite (4x MAs, preset as EMA 8/8/89/89)
Hull MA overlay
How traders can use VB-MainLite in practice:
Use EMA 200 + Gaussian dashboard to define top-down directional bias and avoid trading directly against multi-TF trend.
Use Nadaraya swing labels, RSI exhaustion arrows, and CCI bar colors to time entries within that higher-timeframe bias.
Use Fat Bull / Fat Bear events as structured confirmation that both pattern and MA regime have flipped in the same direction.
Use Bull Snort, Pocket Pivots, and S&R / ICT zones to align execution with liquidity, volume, and location (premium vs discount).
On stocks, use PCD as a positioning map to understand trapped supply, support zones near crowded cost basis, and where profit-taking is likely.
MACD Momentum Structure & Volume Profile Sniper [MTF]**Description and Methodology**
This script offers a unique approach to Market Structure by moving away from traditional fractal-based highs and lows (which can be noisy). Instead, it utilizes **MACD Momentum Swings** to identify significant structural points, combined with an automated Fixed Range Volume Profile to pinpoint high-probability entry zones.
**1. Why MACD Structure? (The Core Concept)**
Traditional "ZigZag" or Fractal indicators rely solely on price action, often leading to fake-outs during low-volume consolidation.
* This script defines a "Swing High" only when the MACD Histogram crosses below zero (Momentum shifts Bearish).
* This script defines a "Swing Low" only when MACD crosses above zero (Momentum shifts Bullish).
By linking structure to momentum, we filter out weak price movements and focus on the true "heartbeat" of the trend.
**2. The "Mashup" Synergy: Structure + Volume + Logic**
This is not a random combination of indicators. Each component serves a specific step in the trading execution sequence:
* **Step 1 (Structure):** The script identifies a Change of Character (CHoCH) based on the MACD peaks described above.
* **Step 2 (Liquidity/Value):** When a CHoCH occurs, the script *automatically* draws a **Fixed Range Volume Profile (FRVP)** specifically covering the impulse leg that caused the break. This reveals the "Point of Control" (POC)—the hidden price level where the most volume occurred during the move.
* **Step 3 (The Sniper Entry):** The script creates a "Zone" around that POC. It then waits for Price to retrace into this zone.
* **Step 4 (Confirmation):** Once the zone is touched, the script monitors a lower timeframe (User selectable, default M1) for a fresh MACD crossover to trigger the final entry signal.
**Features**
* **Multi-Timeframe Dashboard:** Monitor the MACD Trend direction across 4 different timeframes simultaneously.
* **Dynamic Trendlines:** Automatically connects confirmed MACD peaks to visualize trend integrity.
* **Fibo Time Zones:** Projects potential future pivot points based on the duration of the previous swing.
* **Alert System:** Integrated alerts for Zone Touches and "Sniper" entries (Zone Touch + LTF Momentum Confirmation).
**How to Use**
1. **Identify Trend:** Look for the CHoCH labels. Green indicates a shift to Bullish, Red to Bearish.
2. **Wait for Pullback:** Do not chase the break. Wait for price to return to the Yellow POC Zone generated by the Volume Profile.
3. **Entry Trigger:** Watch for the "BUY" or "SELL" marks. These appear only when price hits the zone AND the lower-timeframe momentum aligns with the trade direction.
**Settings & Inputs**
* **Global MACD:** Adjust the sensitivity of the swing detection (Default 12, 26, 9).
* **Sniper Entry:** Select the timeframe used for the final confirmation (e.g., use M1 confirmation for an H1 chart structure).
* **VP Settings:** Customize how the Volume Profile looks on the chart.
*Disclaimer: This script is intended for educational purposes and market analysis. It does not provide financial advice.*
Trinity CCI Pro PlusWhat It Is
Trinity CCI Pro Plus is an innovative overlay indicator that reimagines the classic Commodity Channel Index (CCI) by plotting its levels directly on the price chart. No more separate oscillator panel—instead, you get dynamic price-based bands and lines for instant momentum insights.
What You See on the Chart
Orange line: The CCI zero line (20-period SMA of typical price, hlc3)—acts as the baseline.
Aqua line: Dynamic upper band at CCI = +100 (overbought threshold).
Purple line: Dynamic lower band at CCI = -100 (oversold threshold).
Optional thick purple line: The extra SMA of CCI (14-period smooth) scaled back to price—serves as a signal line for crossovers.
Optional outer zones: ±200 bands (aqua/purple extensions) for extreme momentum levels, often added as dotted or filled areas to spot blow-off tops/bottoms.
Key Differences from Regular CCI
Standard CCI lives in a lower pane with fixed horizontal lines at +100, 0, and -100, forcing you to split your focus. This version overlays everything on price: the bands curve with market volatility, the zero line becomes a moving average, and the extra SMA/signal line integrates seamlessly for price-action trading. Plus, it naturally supports outer ±200 zones without extra coding, making extremes visually pop.
How Traders Use It
Momentum breakouts: Buy when price closes above the +100 aqua band (or +200 for aggressive entries); sell below -100 purple (or -200).
Mean reversion: Fade touches on the bands—take profits if price rejects the +100/-100 levels, or watch for exhaustion at ±200.
Trend bias: Price above orange zero = bullish filter; below = bearish. Use the extra SMA for confirmation (e.g., price crossing above it signals upside).
Crossover signals: Price vs. the thick purple SMA line—bullish above, bearish below—pairs perfectly with band breaks.
Range trading: Treat ±100 bands as dynamic support/resistance; outer ±200 zones highlight potential breakout setups.
This setup shines in trending markets (e.g., stocks or forex on 1H/daily charts), turning CCI into a one-glance channel system. Start with the defaults, add the ±200 and extra SMA via simple code tweaks, and backtest for your style—it's versatile and reduces screen clutter dramatically.
More Info
The 20 period MA is the original and still the most common setting for CCI, and it is exactly what the creator of the CCI, Donald Lambert, published it in 1980 with these exact parameters:
Length: 20 periods
Constant: 0.015 (to make CCI fall between +100 and –100 about 70–80 % of the time)
Typical Price: hlc3 (or sometimes (high + low + close)/3)
Deviation measure: Mean Deviation (not standard deviation)
So the “Trinity CCI Pro Plus” you are using is 100 % faithful to Lambert’s original design when the length is set to 20.


