חפש סקריפטים עבור "bot"
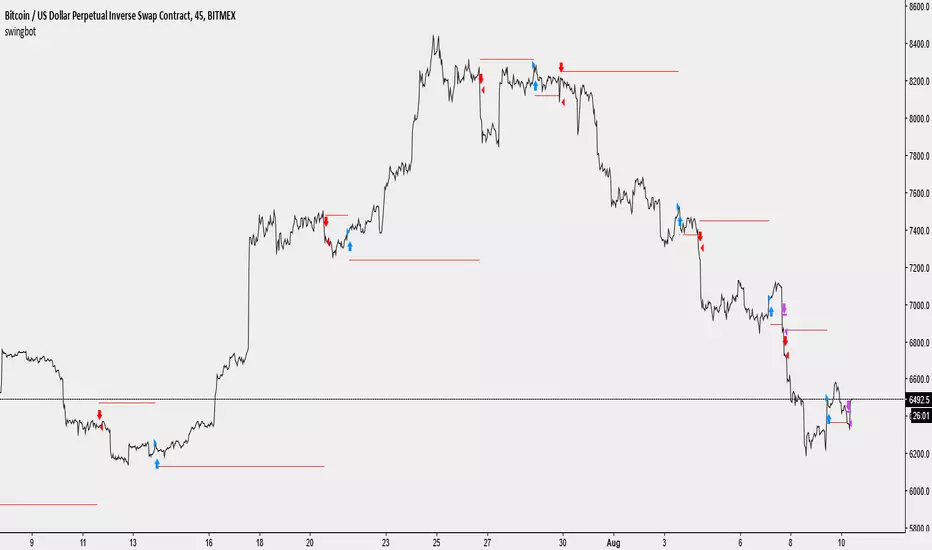
Swingbot (45m) - XBTUSD- I've edited this bot to work ONLY on XBTUSD 45min timeframe.
- Using 2% stop i've been able to make it earn 350%+ since 1st Jan 2017 - assuming NO leverage.
- These settings are using 100% equity every trade.
- Recalculated after order filled is not checked, so backtest results are realistic.
- I have an associated alert script that is able to make this strategy fully automated.
- If you are interested in using this script, please feel free to contact me!
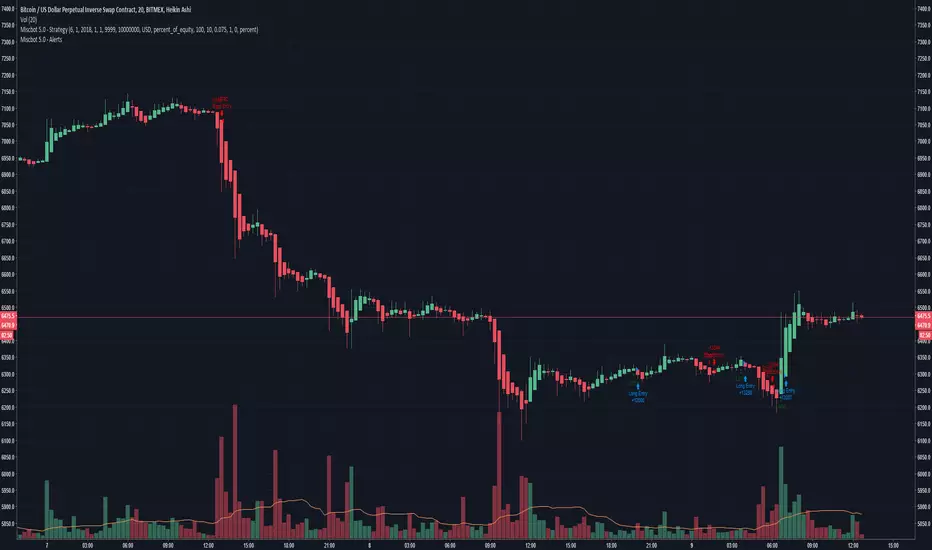
Miscbot 5.0 - StrategyA general strategy for BitMEX that uses a combination of indicators and filters to determine long and short zones.
Tested and coded for 20m. Use at your own risk. I take no responsibility for lost currency.
BitMex referral - 10% off fees: : www.bitmex.com
I have also converted the strategy to a bot that can be used with autoview to make the trades for you.
-Pinescript v3
-Heikin Ashi candles
-20m
Alerts for Dragon-Bot beta breakout scriptThis is a work in progress for Alerts for a breakout script

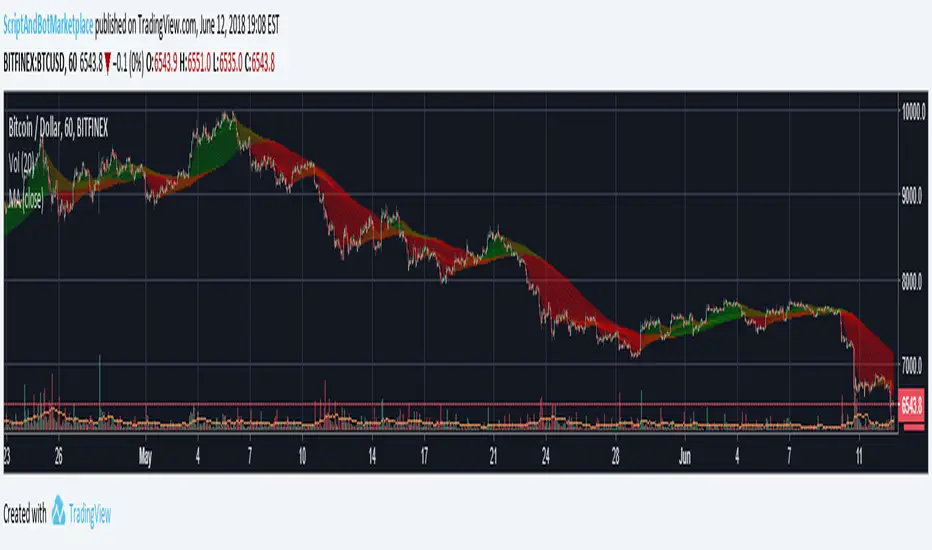
Script and Bot Marketplace's Trend Detector 2.0Use this custom indicator to analyze the current trend of any market that you choose on all time frames. Works great as a secondary indicator while day or swing trading.
Interested? Check us out here: www.scriptandbotmarketplace.com
Join our discord to talk about bots, scripts, and crypto: discord.gg
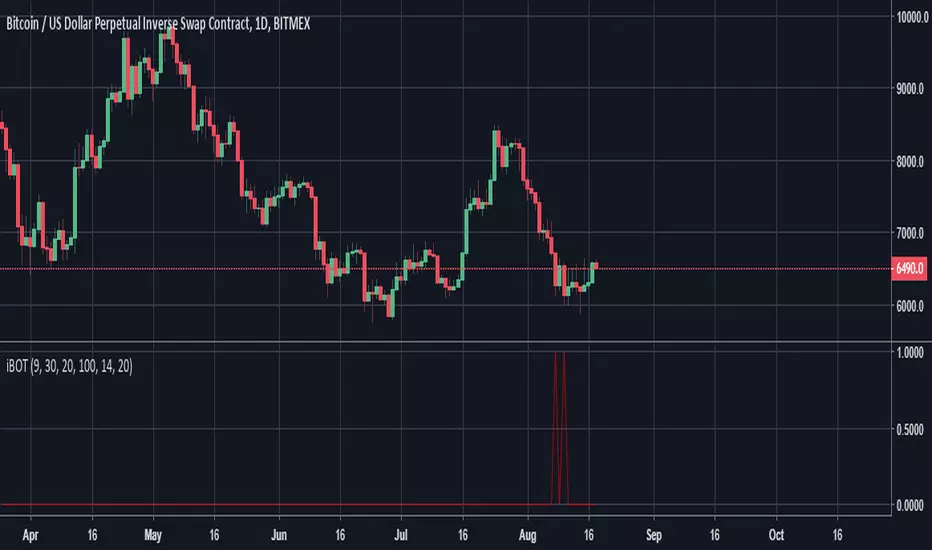
Buy Signal and Entry points (alpha)
Here is some study for my new bot project. 🤖
Indicator shows entry points (buy signals). Bets results on 15M TF and higher. (1H recommended)
Pay attention to how the script gives signals before the pumps. 📈📈📈
You can cut false signals by using stop-loss orders (recommended).
Use on you own risk.
This is alpha version of script. May be updated in the future.
=================================================================
Стратегия разработанная для нашего торгового бота. 🤖
Индикатор показывает точки входа на покупку. Показывает хорошие результаты на ТФ 15М и выше. (Рекомендую 1Ч)
Обратите внимание на то, как скрипт срабатывает перед пампами. 📈📈📈
Чтобы купировать ложные сигналы, рекомендую использовать стоп-лосс ордера.
Это альфа версия скрипта, возможно будет дорабатываться и обновляться. Но это не точно :)

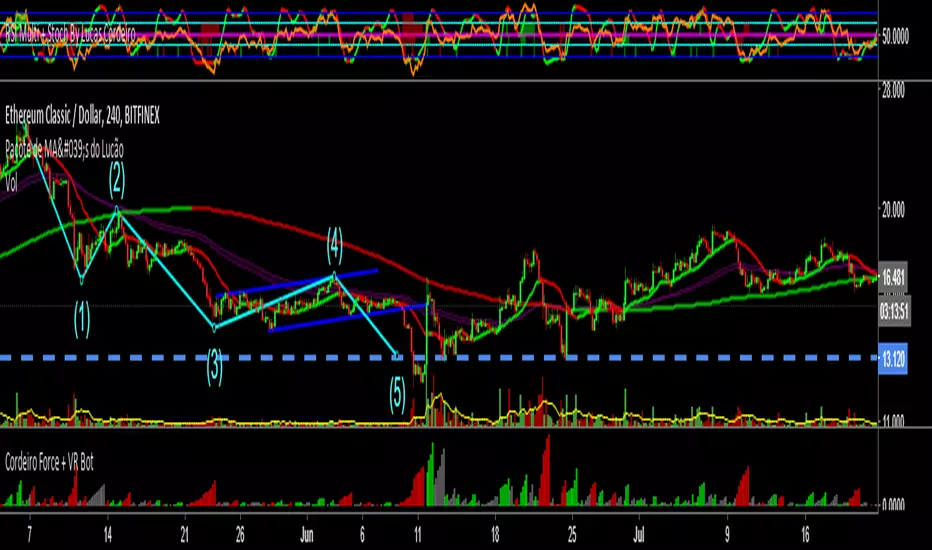
ETHUSD - bot for Autoview - StudyScript for automated trade in ETHUSD at BITFINEX.
For more information, go to my scripts page and see his backtest (ETHUSD - bot for Autoview - Strategy).


Crypto Wave Rider Indicator - Bitcoin & Crypto SignalerAfter months of research and testing, I have developed the first public beta of my Crypto trading script.
Note the following:
1.) This algo works best with /USD pairings (e.g. ETH/USD). Doesn't work as well with /BTC pairings (e.g. ETH/BTC). I believe this is because USD is stable and allows for better data (rather than comparing two very volatile assets to each other).
2.) This algo works best on swing trading time frames (4 hour - 12 hour) but can also be used on lower time frames (although lower than 1 hr is not recommended). For reference, I've found the best time frames to be as follows: BTC - 6 hour, LTC - 4 hour, ETH - 12 hr
So far, the results have been far better than the other bots/indicators I've come across.
This indicator has been optimized for use on Bitcoin with 6 hour candles just because Bitcoin is the oldest crypto & has the most backtesting data available. And 6 hour time frame because I prefer swing trading over day trading.
Feel free to test on different time frames and coins to see what gets the best results.
Comments and feedback appreciated!!
************Note: Please do not ask me for the source code. It is protected for a reason....I won't be giving it out to anyone.*************

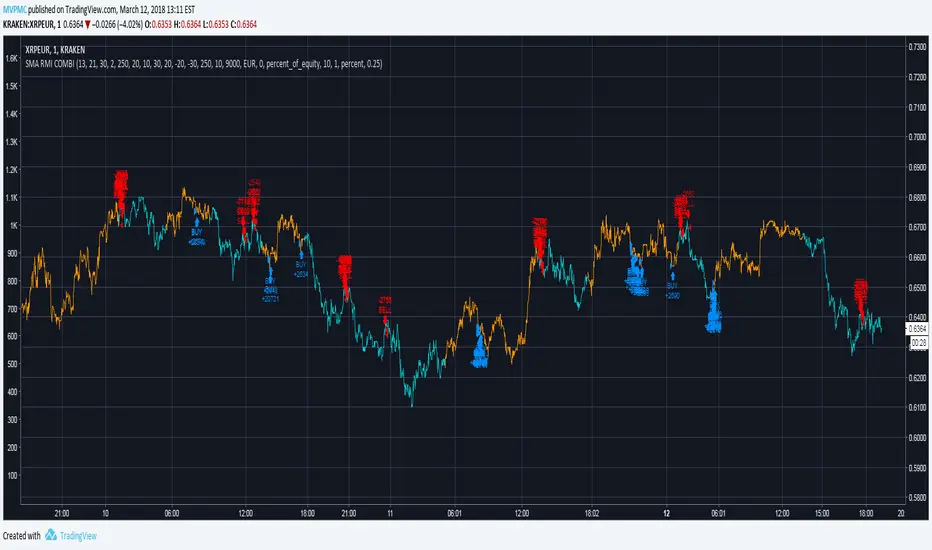
CMYK XIAM◊ Introduction
This is project XIAM, a trading bot based on SMA and RMI
◊ Origin
Based on 'The Relative Momentum Index' by Roger Altman : February, 1993 issue of Technical Analysis of Stocks & Commodities magazine.
While RSI counts up and down days from close to close, the Relative Momentum Index counts up and down days from the close relative to a close x number of days ago.
This results in an RSI that is smoother. The input has been changed to the change of a smoothed close multiplied by a smoothed volume .
In addition SMA is used to detect an up/downwards phase.
◊ Adjustments
CMYK color theme applied.
◊ Usage
Automatic trading strategy
◊ Future Prospects
Remove jitter.
Take Variance into account
Auto adjusting settings evaluated on previous placements.
Proper asset management.
BB/StochRSI Strategy Backtest For Crypto BotThumbs Up for access
Buy is triggered when the price reaches chosen percent of lower Bollinger Band, Stoch RSI is oversold and there's a K/D signal crossover. The exit is when StochRSI is Overbought or K/D Crossover (toggle) AND/OR (toggle) price is greater than or equal to Top or Mid Bollinger Band (toggle).
Use 15m charts. It works excellent for consolidating/sideways markets and good for bullish impulsive moves but takes losses during impulsive downside market moves.
Results will be better in real-time. The script calculates the price based on the close, but a bot would calculate in real-time. Entries would be better. I recommend manually testing the strategy by using the "Date and Price Range" tool in TradingView.
I'll share the source code to those who wish to collaborate for improving profitability.

Grahn Gyllene Kors [Alerts]Grahn Gyllene Kors is the companion study for the Grahn Gyllene Kors strategy...
This is an EMA / Trend Explorer & Strategy useful for identifying trends before EMA's cross and also identifying and experimenting with various EMA lengths and candle trends. There is also a companion Alerts study for this in which trend signals may be sent to the user via sms or email AND/OR buy and sell alerts may be sent to bots for automated trading of this strategy. Once you have optimized your settings and backtested with this strategy, apply your same settings into the Alerts study and create your alerts.
NOTICE: This script does not require access from me, simply open Indicators on chart and search for "Grahn". By accessing this script you acknowledge that you have read and understood that this is for research purposes only and I am not responsible for any financial losses you may incur by using this script!
EMA Fast and EMA Slow - may be adjusted in length and color.
Bullish F>S % - controls what percentage the EMA Fast should be above EMA Slow before considered bullish and is represented by the Green band on the chart.
Neutral % - is what percentage surrounding the EMA Slow should be considered neutral and is represented by the Yellow band on the chart.
Bearish F

BTC Long vs. Short http://cryptoanalyzer.info/botThis indicator uses Longs and Shorts count to predict market divergences. 77% profitable.
Margin calls speaks for itself. Get it for free with TradingView Auto-Trader BOT
It will do not repaints, use stable data from market. Trade signals are stable as in Blue Velvet and Purple Sea

BTC MTF Directional average (1h/2h res)1h or 2h resolution
Any market without multiple weekly binary data events and enough liquidity (eg. Bitcoin)
**For bitcoin use preferably on bitfinex or an index of all exchanges and exchange volume. Most of the price manipulation occurs at bitfinex, other exchanges will often be slightly behind.
V 0.0.1
** KNOWN ISSUES
Around the time of the new daily candle (2AM GMT+1 on BTC) false signals may occur due to 24 hours being the highest resolution.
Repainting: due to the nature of tradingview's pinescript these false signals will disappear after 2-3 new candles and refreshing the page.
** UPDATES
Added browser alerts (untested)
Tip: Don't always wait for the bot to flip to risk off when volatility kicks in (eg. during wash trades).

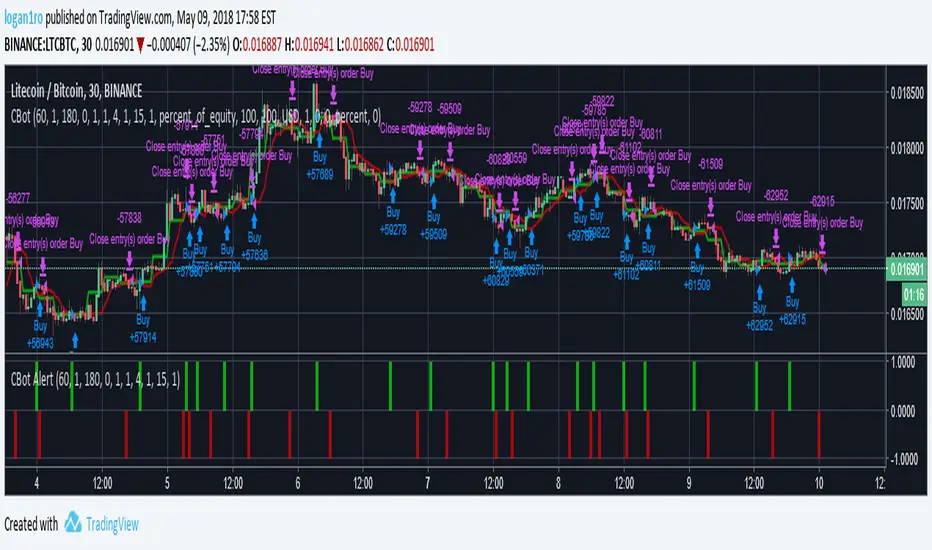
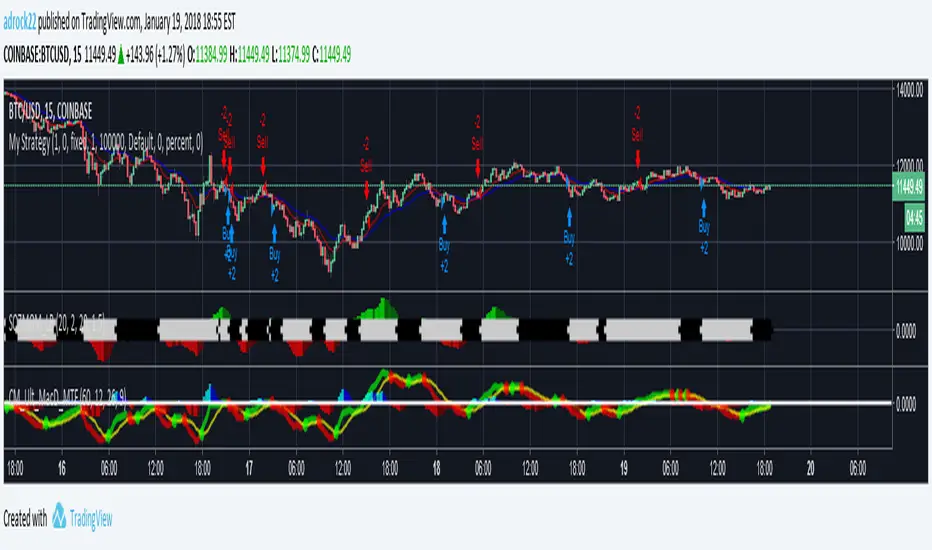
Moonbot - Cryptocurrency Trading StrategyThis is a greatly improved upon version of my cryptoTurtle. Enough has changed I didn't think it was appropriate to just update cryptoTurtle. I will possibly be selling this bot on bitcointalk in the future, stay tuned!
Setup:
Buy: Above green line and green up arrow.
Sell: Sell when above top red line or bottom red line. Also sell if arrow turns down and red.

Blue Velvet v1.2 http://cryptoanalyzer.info/botcryptoanalyzer.info
Long only version. No short signals

GunbotThis is based on the bot found here . It isn't as smart as gunbot due to limitations of pinescript, but I am posting up for anyone using gunbot as it might help with finding good pairs to trade and good settings for those pairs as you can use this to backtest. Also, I am only guessing at some things that his strategy does, based off the instructions and examples he gave in this thread.
