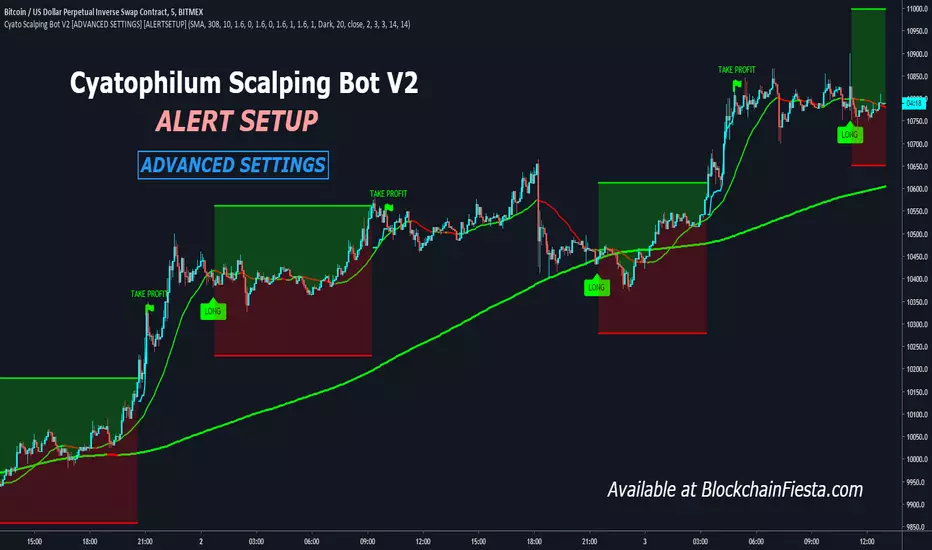
Cyatophilum Scalping Bot V2 [ADVANCED SETTINGS] [ALERTSETUP]Advanced Settings version of Cyatophilum Scalping Bot V2
For people who like tweaking settings =)
חפש סקריפטים עבור "bot"
Crypto grabberSo, its my first position in crypto (and not only crypto) bots series. What we have there.. program writting on Pine script language what can analyse market data of any trading instrument and signalise to enter the deal. Its next versions will update. Trade system based on my x-volume indicator.In central part of system is analyzing volume accumulation and distribution process which decide good and bad time for investing.
So some important points:
1) In time when you change timeframe or trading symbol bot analise all bars history. The number of trading (signal) candles in the analysis history is marked in black.
2) The percent of profitable signals is marked in blue.
3) Total profit points are marked in green.
4) Total bars in history are marked in red.
For better indicator vision you can turn off non interesting plots in settings menu.
There is two kinds of alerts: Buy alert and Sell alert. Set it once per bar close or every minute ( because the best way you must open the deal at 20 sec before bar close ).
This trading system is great for creating a profitable trading portfolio. Try it yourself to find exchanges and cryptocurrencies with profitable historical views. For example, the KRAKEN exchange trades well: XBTCAD, XBTUSD in 30-45 min timeframe.
I will do better settings in new versions of this bot. Waiting your likes)

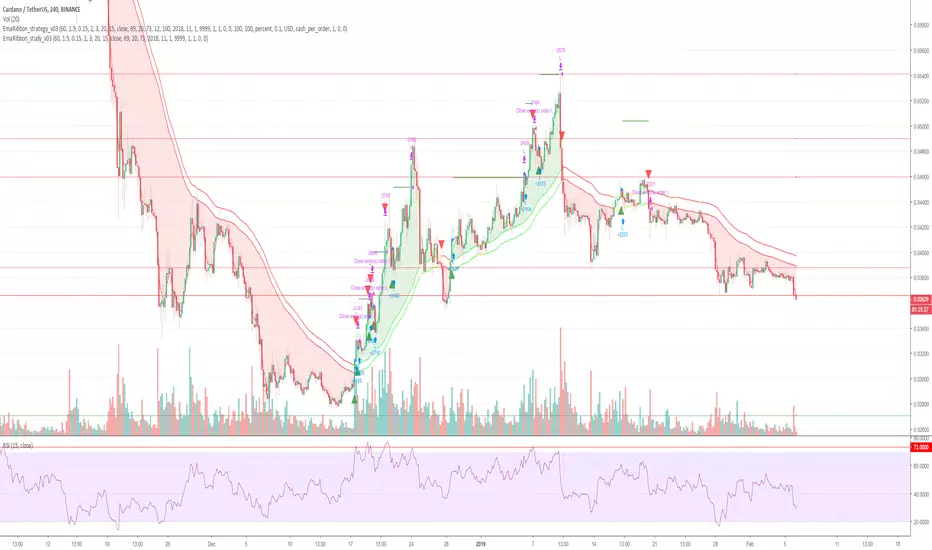
Cryptocurrency trend following EMA Ribbon LONG only studyThis strategy is based on EMA Ribbon and uses multiple indicators to find optimal time to enter/exit the trade and filter out false signals. The script with default setting is developed mainly for trading altcoins/stable coin pair such as ADA(USDT etc on 4h timeframe but it can be applied to any pair/any timeframe with some settings adjustments.
For plot on chart features make sure that you have both study and strategy scripts on chart with same settings.
Strategy settings description:
1. Signal EMA Length - Value for exponencial moving average (slowest from EMA Ribbon)
1a. Buy price toleration (%) - Price deviation for filtering bounces of EMA - price must close defined percents above EMA to open long trade
1b. Sell price toleration (%) - Price deviation for filtering bounces of EMA - price must close defined percents bellow EMA to close long trade
1c. EMA deelay - EMA id delayed by defined bars for smoothening
2. Filter by Fast EMA - Strategy filters signals to prevent buy while coin is dropping
2a. Fast EMA Length - Value for fast exponencial moving average
3. Filter by SMA - Strategy filters signals to confirm trend change
3a. SMA Length - Value for simple moving average
4. Filter by RSI - Strategy filters signals to prevent buing/selling overbought/oversold coins
4a. RSI Length - Length of RSI identificator
4b. RSI Source candle - What price of candle is used for RSI calculation (open, close, high, low)
4c. RSI Long condition - When buy, RSI indicator must be below this value to prevent of buying already overbought coin
4d. RSI Short condition - When sell, RSI indicator must be above this value to prevent of selling already oversold coin
5. RSI Close Trade Condition - Strategy sell coin once RSI reach defined value
5a. RSI close trade condition - Sell once RSI indicator acquires defined value
6. Close trade by Take Profit or Stop Loss Condition (STRATEGY ONLY) - Strategy sell coin once defined take profit / stoploss level is reached
6a. Take Profit (%) - Take profit value in percent
6b. Stop Loss (%) - Stop loss value in percent
6c. Plot targets on chart - defined targets will be plotted as lines on chart
7. Date range from
7a From Year - To run strategy in interval
7b From Month - To run strategy in interval
7c From Day - To run strategy in interval
8. Date range to
8a To Year - To run strategy in interval
8b To Month - To run strategy in interval
8c To Day - To run strategy in interval
9. Wait to confirm the signal
9a Wait candless to buy - strategy will wait defined candless to confirm the signal before buy
9b Wait candless to sell - strategy will wait defined candless to confirm the signal before sell
10. Plotting on chart (STUDY ONLY)
10a Plot signal line channel with bows on chart
10b Plot simple moving average on chart
10c Plot EMA Ribbon on chart
10d Plot recent support and resistance levels on chart
11. Show Every signal (STUDY ONLY) - Unchecked shows only first signal based on strategy. But if you use take profit/stoploss settings within your bot, you might want to rebuy on next signal. Checked shows signal on each candle.
Throw on chart also buld-in RSI indicator and set the same as strategy
Notice that there might be false signals, especially when the coin is not trending or is strongly manipulated. Overall strategy is profitable though. You just take some minor loses and wont miss the big move.
You may also consider to compare buy&hold return vs profit from trading this strategy. In downtrend as we have seen recently, profit may not be as high as you expect but it is still much better than just hold and hope.
You can use the strategy script for fine tunning settings and find best settings for yourself.
Study script helps you to automate trading with use of alerts perharps with 3commas bot or even trade manually based on email/sms notification setted by tradingview
Notice that study script does not handle takeprofit/stoploss order. That is why sell arrows could be plotted by study script later than strategy script. To rebuy after takeprofit/stop-loss use "11. Show Every signal (STUDY ONLY)" setting
Make sure that you keep same settings for strategy and study scripts.
If you need any help with settings do not hesitate to ask. I would also appriciate any feedback and ideas how to improve this script.
Here is backtest result from 1. Nov 2018 using constant 100USD Buy ammount:
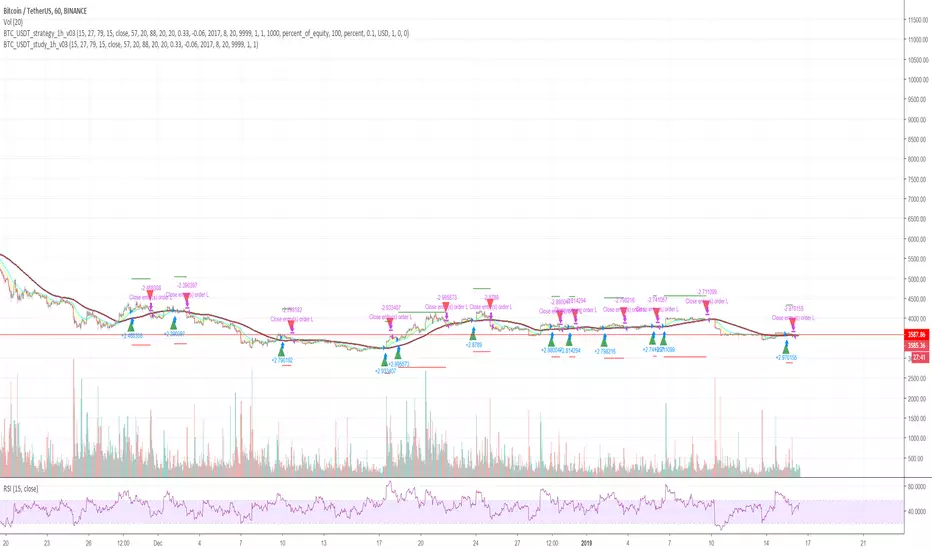
Cryptocurrency trend following LONG only studyThis strategy uses multiple indicators to find optimal time to enter/exit the trade. The default setting is mainly for trading bitcoin/stable coin pair such as USDT etc on 1h timeframe but it can be applied to any pair/any timeframe with some settings adjustments.
Strategy settings description:
ID Name Descrption
1 FastMA - Value for fast exponencial moving average
2 SlowEMA - Value for slow exponencial moving average
3 SMA - Value for simple moving average
4 RSI Length - Length of RSI identificator
5 RSI Source candle - What price of candle is used for RSI calculation (open, close, high, low)
6 RSI Long condition - When buy, RSI indicator must be below this value to prevent of buying already overbought coin
7 RSI Short condition - When sell, RSI indicator must be above this value to prevent of selling already oversold coin
8 RSI close trade condition - Sell once RSI indicator acquires defined value
9 Take Profit (%) - Take profit value in percent
10 Stop Loss (%) - Stop loss value in percent
11 Long price toleration (%) - Price deviation for filtering bounces of simple moving average - price must close defined percents above SMA to open long trade
12 Short price toleration (%) - Price deviation for filtering bounces of simple moving average - price must close defined percents bellow SMA to close long trade
13 From Year - To run strategy in interval
14 From Month - To run strategy in interval
15 From Day - To run strategy in interval
16 To Year - To run strategy in interval
17 To Month - To run strategy in interval
18 To Day - To run strategy in interval
19 Show every signal? - (Study only) Unchecked shows only first signal based on strategy. But if you use take profit/stoploss settings within your bot, you might want to rebuy on next signal. Checked shows signal on each candle.
Notice that there are also false signals, especially when the coin is not trending or is strongly manipulated. Overall strategy is profitable though. You just take some minor loses and wont miss the big move.
You may also consider to compare buy&hold return vs profit from trading this strategy. In downtrend as we have seen recently, profit may not be as high as you expect but it is still much better than just hold and hope.
You can use the strategy script for fine tunning settings and find best settings for yourself
Study script helps you to automate trading with use of alerts perharps with 3commas bot or even trade manually based on email/sms notification setted by tradingview
Make sure that you keep same settings for strategy and study scripts.
If you need any help with settings do not hesitate to ask. I would also appriciate any feedback and ideas how to improve this script.
Here is backtest result from 23.08.2017:
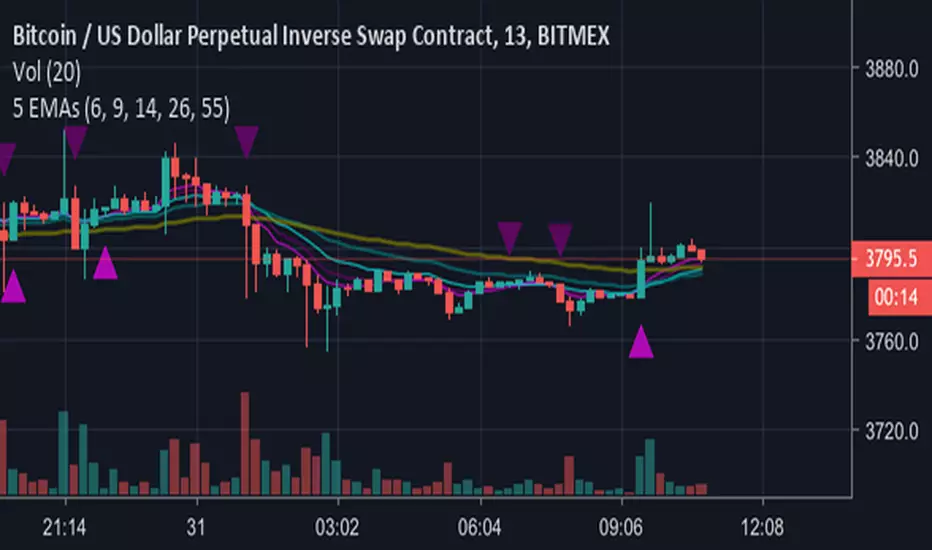
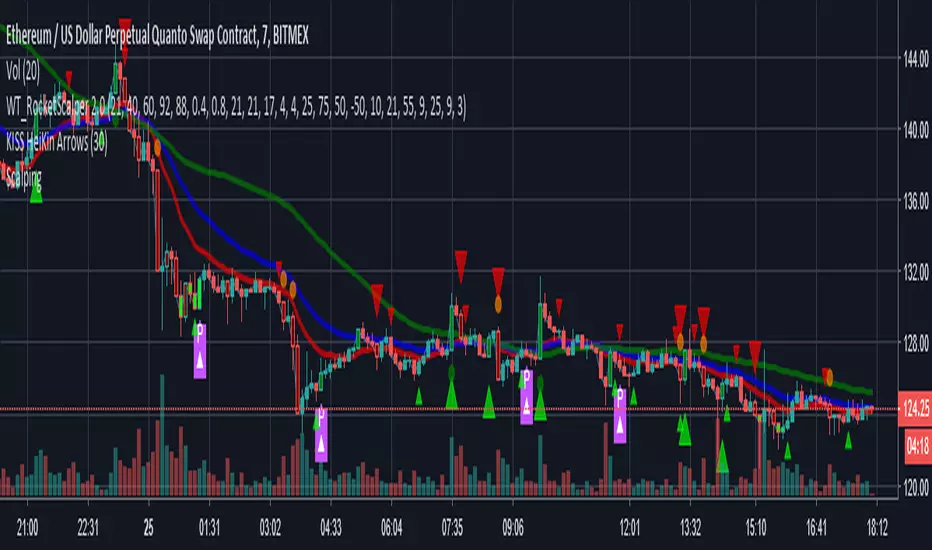
5 EMAs plus Crossing AlertsHi all,
This is a simple indicator that plots 5 EMA lines of your choice to the screen.
Can be used to trigger scalping Bots (stoploss around 0.5% recommended, take profit 1% or higher, please backtest!)
Also can be used for manual scalping, 1 or 2 candles at a time.
Features:
1) Alerts are triggered when EMAs 1 (Signal line) and 2 (Baseline) cross - a Long signal is called if the cross is above EMA 3 (Trendline), a short if the cross is below EMA3
2) Signals are represented visually as a triangle on the chart, below the candles is a long, above is a short
3) TradingView Alerts can be easily set as I have labelled the signals clearly as many other Indicators like this aren’t easy to work out if trying to create alerts to trigger a 3commas bot, for example!
Each EMA is fully customisable and if you wish to take advantage of the alerts, only a few simple rules need to be followed:
EMA1 needs to be less than EMA2.
EMA2 needs to be the same or greater than EMA3
That’s it, happy trading!
Big shout out to B and the gang over at Crypto Trading Group!
EMA Bot Trigger - 14,26,55Work In Progress - Currently will send Long/Short triggers when EMA 14 Crosses EMA 26 - whether the cross is above the EMA 55 determines whether to Long or Short.
MACs EasyMoney - BOT Trade with AlertSytemsNew Version: MACs EasyMoney - BOT Trade with AlertSytems
Introducing the BOT version with proper alerts systems to enter and exit trades.
Also furnished with latest noise filtering architecture to this tool.
Strategy Test report for this tool - holds the Profit Factor of 134 - based on '1 contract' size with '0.25% commission' rate as well.
(Means it is very solid and healthy Profit Factor . happy to say that, you wont get any like this in today's Market)
Refer the Strategy Publication for details.
Thanks,
Mac.

PREMIUM CRYPTO TRADING BOT Trading signals confirmed by 6 sources.
Multiple timeframes. 1min - 4hours
Any Alt coin including BTC.
3 separate signals for scalping, intraday and swing trading.
Perfect entries when combining all the confirmations. (Candle color change, triangle signal, traffic lights at the top and bottom, scalp line color change, intraday line color change and trend indicator (Swing) line position.
We are actively improving on this bot and new updates will be saves on your bot too.
Contact me if you would like to use our bot.

Bottoms Up w/ Buy and Sell AlertsBITMEX:XBTUSD
This indicator is best used on 4hr candles. It produces a buy/long and sell/short alert with pre-coded syntax for Autoview. There are four alerts total, 2 for BitMEX testnet and 2 for BitMEX (each has a buy/sell alert). The alerts are pre-coded for BitMEX
****be sure to edit the message script to your desired contract amount and leverage****
This script will also work on Profit Trailer, but you will need to change the alert message syntax to match your exchange. You will also want to adjust your bot's selling strategy to hold the coin longer. This is not a quick scalp of a coin, this is intended to buy a coin and ride its trend longer. This is more of an automated swing trader rather than a scalping opportunity like most bots use.

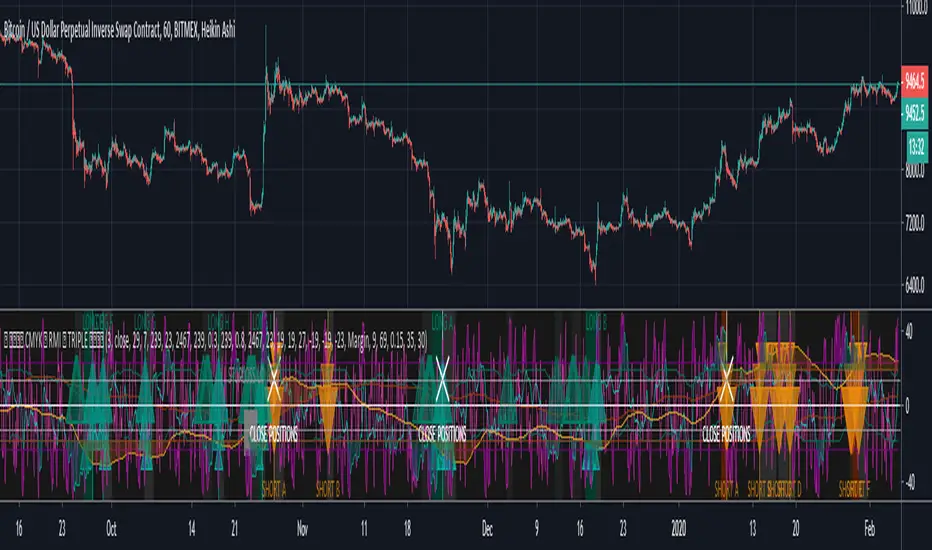
CMYK RMI TRIPLE Automated study for Autoview▼ This is the study version of the script, For usage with Autoview
◊ Introduction
This script makes use of three RMI 's, that indicate Overbought/Oversold on different timescales that correspond with Frequency’s that move the market.
◊ Origin
The Relative Momentum Index was developed by Roger Altman and was introduced in his article in the February, 1993 issue of Technical Analysis of Stocks & Commodities magazine.
While RSI counts up and down ticks from close to close, the Relative Momentum Index counts up and down ticks from the close relative to a close x number of days ago.
This results in an RSI that is smoother, and has another setting for fine tuning results.
This bot originated out of Project XIAM , an investigative script that outlined my approach towards Automated Trading Strategies.
Are you interested in writing bots yourself ? check out the beta version of this script.
It has many bugs, but also most of the Skeleton.
◊ Usage
This script is intended for Automated Trading with AUTOVIEW or TVAUTOTRADER , on the 1 minute chart.
◊ Features Summary
Overlay Mode
Indicator Mode
Three RMI's
Trend adjustment
Pyramiding
Ignore first entries
Take Profit
Stop Loss
Interval between Entries
Multiring Fix
Alert signal Seperation
◊ Community
Wanna try this script out ? need help resolving a problem ?
CMYK :: discord.gg
AUTOVIEW :: discordapp.com
TRADINGVIEW UNOFFICIAL :: discord.gg
◊ Setting up Autoview Alerts
Use the study version of this script, To set up The Alerts Autoview Picks up on.
The Signals to work with are :
Open 1 Long
Use this to open one Long Position.
With quantity being : /
Once per bar
Being larger than 0
Comment example : e=exchange b=long q=amount t=market
Open 1 Short
Use this to open one Short Position.
With quantity being : /
Once per bar
Being larger than 0
Comment example : e=exchange b=short q=amount t=market
Close1 Position
Use this to Close The amount of one Open Position.
With quantity* being : /
Once per bar
Being larger than 0
Comment example : e=exchange c=position q=amount t=market
*Beware when using a percental % quantity, instead of an absolute quantity.
Percental Quantities are based on the , Not
And will change in absolute value relative to the amount of open trades.
Close All positions
Use this to Close All Open Positions.
With quantity being :
Once per bar
Being larger than 0
Comment example : e=exchange c=position t=market
For the specific Syntax used in the comment of the alert, visit Autoview .
◊ Setting up TVAutotrader
Use the strategy version of this script, And load it into TVAT .
◊ Backtesting
Use the strategy version of this script for backtesting.
◊ Contact
Wanna try this script out ? need help resolving a problem ?
CMYK :: discord.gg
SMC + OB + FVG + Reversal + UT Bot + Hull Suite – by Fatich.id🎯 7 INTEGRATED SYSTEMS:
✓ Mxwll Suite (SMC + Auto Fibs + CHoCH/BOS)
✓ UT Bot (Trend Signals + Label Management)
✓ Hull Suite (Momentum Analysis)
✓ LuxAlgo FVG (Fair Value Gaps)
✓ LuxAlgo Order Blocks (Volume Pivots) ⭐ NEW
✓ Three Bar Reversal (Pattern Recognition)
✓ Reversal Signals (Momentum Count Style)
⚡ KEY FEATURES:
• Smart Money Structure (CHoCH/BOS/I-CHoCH/I-BoS)
• Auto Fibonacci (10 customizable levels)
• Order Block Detection (Auto mitigation)
• Fair Value Gap Tracking
• Session Highlights (NY/London/Asia)
• Volume Activity Dashboard
• Multi-Timeframe Support
• Clean Label Management
🎨 PERFECT FOR:
• Smart Money Concept Traders
• Order Flow & Liquidity Analysis
• Support/Resistance Trading
• Trend Following & Reversals
• Multi-Timeframe Analysis
💡 RECOMMENDED SETTINGS:
Clean Charts: OB Count 3, UT Signals 3, FVG 5
Detailed Analysis: OB Count 5-10, All Signals
Scalping: Low sensitivity, Hull 20-30
Swing Trading: High sensitivity, Hull 55-100

SFP + TP/SL + WT JSON BOT (Touch/Return)Smart Reversal Engine with Automated TP/SL & WunderTrading Integration
This invite-only indicator is designed for traders seeking highly responsive reversal detection and fully automated execution.
It combines multiple market conditions into a single confirmation system that identifies high-probability turning points with minimal delay.
The tool provides:
🔷 Key Features
✔ Real-time reversal detection
Signals are generated the moment specific market conditions align—no need to wait for candle closures.
This allows extremely early entries with minimal lag.
✔ Auto-calculated TP/SL levels
Profit-taking and protection levels are dynamically generated based on market structure.
Visual TP/SL lines appear directly on the chart for clarity.
✔ Backtesting suite
Last N trades statistics
Monthly performance summary (last 4 months)
Estimated PnL based on user-defined capital & leverage
On-chart TP/SL markers
Everything updates automatically as new signals appear.
✔ Fully automated execution through WunderTrading
When enabled, the indicator automatically sends structured JSON alerts compatible with WT bots:
Enter Long
Enter Short
Exit All
Including:
Market orders
Position size based on your capital settings
Exchange-level TP/SL placement
This allows the chart signals to translate directly into live trading actions.
🔷 Customization
Users can freely adjust:
Entry behavior mode
TP/SL model
Capital allocation
Leverage settings
Backtest window
Without exposing or modifying the underlying logic.
🔷 Notes
This script does not repaint after confirmation.
Real-time signals may update during candle formation (normal for intrabar processing).
Strategy logic is proprietary and not disclosed.
Access is invite-only.
If you would like access, contact me directly through TradingView messages.
Setup guide and WT integration instructions are provided for all subscribers.
智能反转引擎(Smart Reversal Engine)+ 自动 TP/SL + WunderTrading 全自动交易接口
这是一个 邀请制(Invite-Only) 指标,专为追求高响应性反转信号、自动化交易执行的用户打造。
它将多重市场条件整合成统一的判定系统,在极短延迟下识别潜在的高概率转折点。
不会披露策略逻辑、指标原理或内部结构。
🔷 主要功能
✔ 实时反转信号(无需等待收线)
当关键市场条件同时满足时,系统会即时给出提醒。
适用于希望提前布局、减少延迟的交易者。
✔ 自动计算 TP / SL
止盈/止损根据市场位置自动生成,图表上清晰显示,仅需跟随即可。
无需手动测量价格距离。
✔ 完整回测统计系统
最近 N 笔交易统计
最近 4 个月月度表现
根据本金与杠杆估算的 PnL
每一笔 TP / SL 自动打标
所有统计数据均实时更新。
✔ 完整支持 WunderTrading 全自动下单
启用后可自动发送结构化 JSON 信号,包括:
开多
开空
全部平仓
并自动附带:
市价单
依照用户设置的手数 / 杠杆
交易所级别 TP / SL 挂单
实现从图表信号 → 自动交易执行的全流程自动化。
🔷 自定义设置
你可以自由调整:
入场模式
TP/SL 比例
本金
杠杆
回测窗口长度
无需触碰或理解核心逻辑。
🔷 注意事项
指标在信号确认后不会重绘
实时信号在未收线时可能动态变化(属正常现象)
核心算法为私有内容,不会公开
采用 Invite-Only 授权方式

UT Bot (Combo)UT Bot (Combo), SoniR" can either stand for Sonic R, a technical indicator in trading, or Sonic, a new layer 1 blockchain platform developed from Fantom. Depending on the context, sonic R is a technical indicator used to analyze gold price trends based on EMAs (like EMA 34, 89, and 200). In contrast, Sonic is an EVM-compatible blockchain, capable of fast transaction processing.

4H RSI Buy/Sell BotBelow is a clean TradingView Pine Script v5 bot that analyzes the 4-hour timeframe and triggers alerts based on RSI (even though you mentioned RCI—if you actually need RCI, tell me and I’ll rewrite it)

Pivot Alert Bot - Multi-TimeframeOverview
Pivot Alert Bot automatically detects and labels pivot highs and pivot lows as they confirm across multiple timeframes. Designed for active traders who want clean, actionable signals without chart clutter.
Two-Tier Pivot System
📍 Main Pivots (Length 20)
Confirmed swing points that have proven themselves with 20 bars of price action on each side. Marked with clean PH (Pivot High) and PL (Pivot Low) labels. These are your high-conviction levels.
⭐ Temporary Pivots (Length 3)
Early-stage pivots marked with ***** labels in blue. These signal potential reversals before full confirmation — ideal for aggressive entries with tighter stops.
How to Trade
The indicator is built around a simple pivot-to-pivot strategy:
🔴 Short Setup: Enter short at a Pivot High → Target the previous Pivot Low
🟢 Long Setup: Enter long at a Pivot Low → Target the previous Pivot High
This approach gives you logical, structure-based profit targets instead of arbitrary calculations.
Multi-Timeframe Support
Scan for setups across:
⚡ 5 minute — Scalping and quick intraday moves
📊 15 minute — Primary day trading timeframe
📊 30 minute — Confirmation and larger moves
⏱️ 1 hour — Context and swing trade setups
Built-In Alerts
Never miss a pivot. Alert conditions included for:
Main Pivot High confirmed
Main Pivot Low confirmed
Temporary Pivot High detected
Temporary Pivot Low detected
Set alerts once and get notified on any timeframe.
Best Used On
High-volume, liquid instruments: SPY, QQQ, NVDA, TSLA, AMD, META, AMZN, COIN, and similar names with clean price action.
Settings
Adjustable pivot lengths for both main and temporary pivots
Toggle temporary pivot visibility on/off
Customizable label colors and sizes

Inyerneck UT Bot with 9 EMA Filter With Signals (Tight) v: 4.20this script is a customized version of the UT bot, enhanced with 9ema trend filter for cleaner entries.designed for short term traders to reduce noise and avoid false signals during choppy price action. youll only see signals when price action confirms momentum aligned with trend as defined by EMA. try adjusting sensitivity and ATR period to your liking. my current setting is ATR 6,Sensitivity 3.8,EMA 9 to 11...

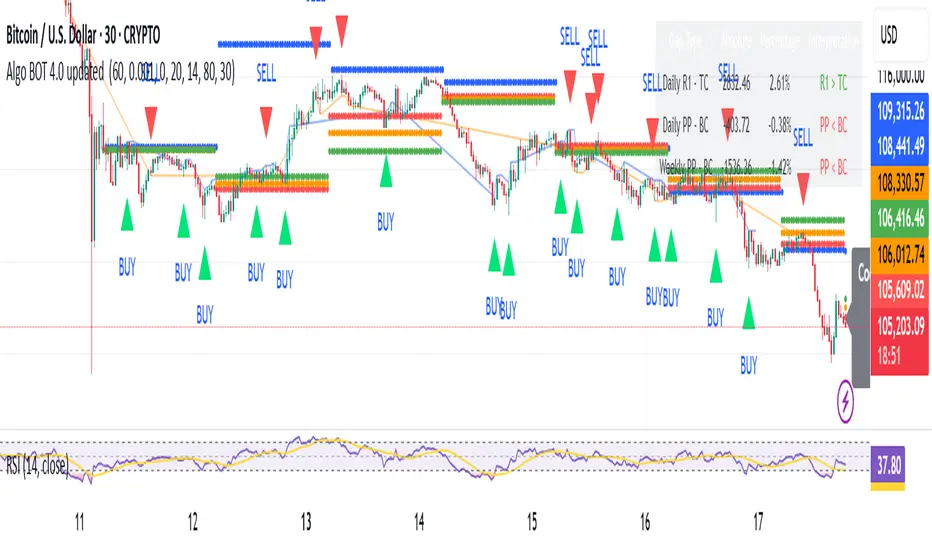
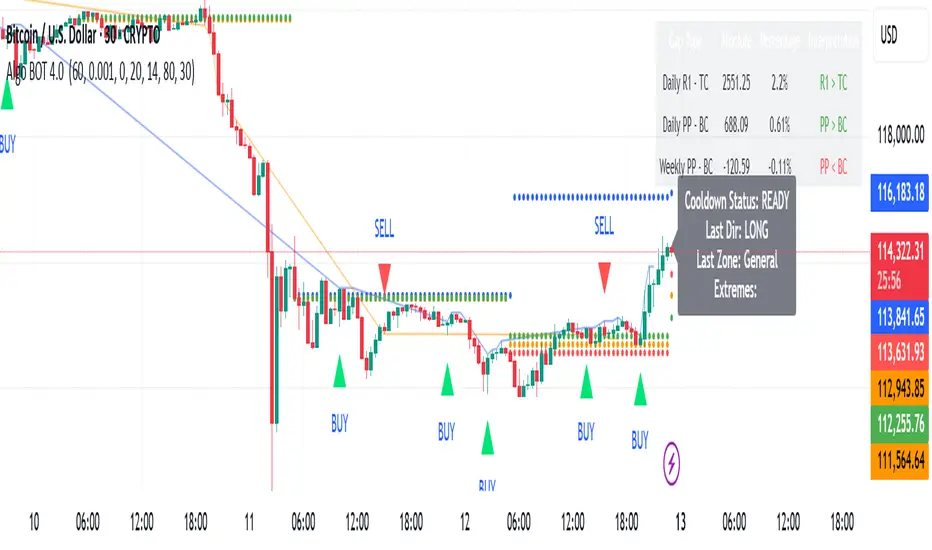
Algo BOT 4.0 updated Strategy Description:
Algo BOT 4.0 updated is a sophisticated multi-timeframe trading strategy that identifies high-probability reversal points using technical confluence. The strategy combines:
Core Components:
Multi-timeframe Pivot Analysis: Daily, Weekly, and Monthly pivot points with CPR (Central Pivot Range)
RSI Momentum Filter: Higher timeframe RSI (user-configurable) for trend bias
VWAP Dynamics: Volume-weighted average price with moving averages
Fibonacci Strength Analysis: Candle close positions relative to 38.2% Fib levels
Advanced Cooldown System: Prevents overtrading with dynamic gap requirements
Entry Logic:
Long Entries: RSI < 57 with bullish candle structure at key support levels
Short Entries: RSI > 43 with bearish candle structure at key resistance levels
Zone-based Filtering: Identifies trades near significant pivot points (D PP, D R1, D S1, W PP, M PP, VWAP)
Risk Management:
Dynamic cooldown periods between trades
Gap-based entry optimization to ensure sufficient price movement
Extreme price tracking for better entry timing
Multi-condition validation to reduce false signals
Alert System:
Real-time alerts for both long and short entries
Includes price, RSI value, and zone information
Visual signals with triangle markers on chart
Comprehensive status monitoring with cooldown timer
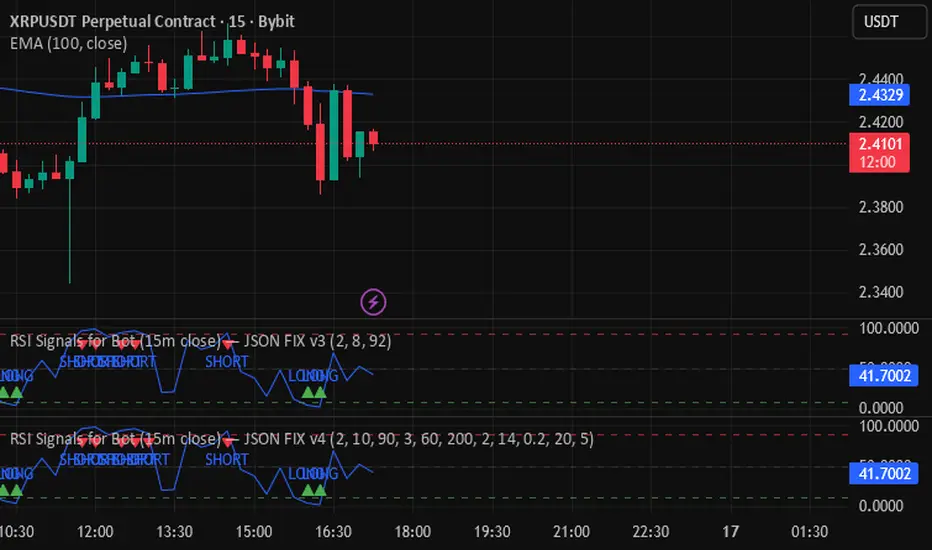
RSI Signals for Bot (15m close) — JSON FIX v4RSI Signals for Bot (JSON Ready) is a lightweight automation-friendly indicator that generates clean LONG and SHORT alerts based on RSI thresholds, fully formatted in JSON for webhook-based trading bots.
It’s designed primarily for 15-minute charts and sends one alert per confirmed bar close.
Algo BOT 4.0 Strategy Description:
Algo BOT 4.0 is a sophisticated multi-timeframe trading strategy that identifies high-probability reversal points using technical confluence. The strategy combines:
Core Components:
Multi-timeframe Pivot Analysis: Daily, Weekly, and Monthly pivot points with CPR (Central Pivot Range)
RSI Momentum Filter: Higher timeframe RSI (user-configurable) for trend bias
VWAP Dynamics: Volume-weighted average price with moving averages
Fibonacci Strength Analysis: Candle close positions relative to 38.2% Fib levels
Advanced Cooldown System: Prevents overtrading with dynamic gap requirements
Entry Logic:
Long Entries: RSI < 57 with bullish candle structure at key support levels
Short Entries: RSI > 43 with bearish candle structure at key resistance levels
Zone-based Filtering: Identifies trades near significant pivot points (D PP, D R1, D S1, W PP, M PP, VWAP)
Risk Management:
Dynamic cooldown periods between trades
Gap-based entry optimization to ensure sufficient price movement
Extreme price tracking for better entry timing
Multi-condition validation to reduce false signals
Alert System:
Real-time alerts for both long and short entries
Includes price, RSI value, and zone information
Visual signals with triangle markers on chart
Comprehensive status monitoring with cooldown timer
RUFUS GOLD BOT - TP/SL/ExitRUFUS GOLD BOT – Buy, Sell, and Exit (80% Accuracy)
This powerful indicator provides clear Buy, Sell, and Exit signals based on proven price action patterns, offering traders a simple yet effective tool for decision-making. With an impressive 80% accuracy rate, it helps identify high-probability trade setups and manage exits for optimal profits.
RSI Signals for Bot (15m close) — JSON FIX v3Bybit Bot RSi:
a lookback indicator that searches for potential short/long plays based on length parameters.

Ravi Raj rending Intraday BotTrend Reversal Catching
🔹 Features:
✅ Buy & Sell signals with proper confirmation
✅ Dynamic support & resistance levels
✅ Trend direction + reversal detection
✅ Risk management (Stop Loss & Target levels)
✅ Works on Nifty, BankNifty, Stocks & Options
🔹 Best Timeframe:
5 Min, 15 Min (Intraday Trading)
Works on both Index & Equity
🔹 Trading Style:
Scalping
Momentum Trading
Ravi Raj rending Intraday Bot
8102106608 udhwa
