Breakout Detection using EMAs and Mansfield Relative StrengthThis script identifies breakout opportunities based on a combination of price action, volume, and relative strength. It is designed for daily timeframe charts and helps traders pinpoint strong bullish setups with the following criteria:
Price Action: Stock price is above both the 10-day EMA and 5-week EMA.
EMA Trends: The 10-day EMA is above the 20-day EMA, and the 5-week EMA is above the 10-week EMA, confirming bullish momentum.
Customizable Parameters: Customize the index for the Mansfield Relative Strength, the volume multiplier, and the price breakout look-back period.
Price Breakout: The price is at a 3-month high, indicating strength.
Volume Breakout: A volume spike occurs, surpassing the 20-day average volume by a user-defined multiplier.
Features:
Generates clear breakout signals with a green triangle below the bar.
Integrated Mansfield Relative Strength for relative performance analysis.
Alerts for when all conditions are met, ensuring you never miss an opportunity.
How to Use:
Add this script to a daily chart of your chosen stock.
Look for green triangle signals indicating a potential breakout.
Adjust the parameters to suit your trading strategy and preferred index for the Mansfield Relative Strength.
This tool is ideal for swing traders looking to combine technical analysis with relative strength metrics for high-conviction bullish setups.
חפש סקריפטים עבור "break"

Breakdown Hold (1m) - Manual Level//@version=6
// =============================================================================
// EN — Script Overview
// Name: Breakdown Hold (1m) - Manual Level
// Purpose:
// Detect a simple pattern: price breaks below a manually set level, then
// stabilizes ("holds") within ~1 minute (default) without further dumping.
// When confirmed, it prints "HOLD OK" and triggers an alert.
//
// How it works:
// 1) You input a fixed price Level.
// 2) On the FIRST break below Level (LOW sweep by default), the script "arms".
// 3) For the next N bars on the 1-minute stream (default N=1):
// - If price drops too deep (beyond Max Further Drop), it fails.
// 4) When the window ends:
// - If it did NOT drop too deep AND it bounced from the window low by at
// least Min Bounce (and optional reclaim above Level), it confirms HOLD.
//
// Recommended usage:
// - Works best on a 1-minute chart.
// - If you are on another timeframe, keep "Force 1m Evaluation" enabled
// so the logic still evaluates on 1-minute data.
//
// Alert:
// - Condition title: breakdown_hold_confirm
//
// =============================================================================
// 中文 — 脚本说明
// 名称:Breakdown Hold (1m) - Manual Level
// 用途:
// 识别一个非常简单的“跌破手动固定价位后,约 1 分钟内踩住不再继续下跌”的形态。
// 确认后在图上打出 “HOLD OK”,并触发提醒。
//
// 原理:
// 1) 手动输入固定价位 Level。
// 2) 当价格第一次跌破 Level(默认按 LOW 刺破)后进入监测(armed)。
// 3) 在接下来 N 根 1分钟K(默认 N=1)内:
// - 若继续下探太深(超过允许最大继续下跌幅度),判定失败,不触发。
// 4) 窗口结束时:
// - 若未下探过深,且从窗口最低点出现至少 Min Bounce 的反弹
// (可选要求收盘站回 Level 上方),则判定“踩住确认”。
//
// 推荐用法:
// - 最推荐 1分钟图使用。
// - 如果你在其他周期图上用,请保持 “Force 1m Evaluation” 开启,
// 让判断仍然基于 1分钟数据进行。
//
// 提醒条件:
// - breakdown_hold_confirm
// =============================================================================

Breakout: HHHL & LLHL + Close ConditionWhat This Script Does:
Green triangle below the bar = Bullish breakout (Higher High + Higher Low + Close > Previous High)
Red triangle above the bar = Bearish breakdown (Lower High + Lower Low + Close < Previous Low)

Breakout + Retest StrategyThe Breakout + Retest Strategy is a proven price action approach used by professional traders to catch high-probability market moves after key levels are broken. This strategy aims to enter the market after confirmation — reducing false breakouts and improving entry accuracy.
🔍 Strategy Logic:
Identify a Key Support or Resistance Level
These could be recent swing highs/lows, consolidation zones, or session highs.
Wait for a Clean Breakout
Price must decisively break above resistance or below support with strong momentum.
Watch for the Retest
After the breakout, wait for the price to pull back to the broken level (now flipped support/resistance).
Enter on Retest Confirmation
Look for signs like rejection wicks, bullish/bearish engulfing candles, or strong volume on the retest.
Set Risk-Managed Stops and Targets
Stop loss goes below (for long) or above (for short) the retested level.
Target is usually set at a 1:2 or higher risk-to-reward ratio, or based on structure.
✅ Why It Works:
Filters out fake breakouts
Uses market structure and liquidity traps to your advantage
Combines both momentum and confirmation
⚙️ Best Timeframes:
15-minute to 1-hour for intraday setups
4-hour and daily for swing trades
📊 Ideal for:
Futures (NQ, ES, Gold)
Forex pairs
Crypto
Stocks near key earnings or breakout zones

Deemer Breakaway Momentum ThrustBreakaway momentum is a "breadth thrust" coined by Walter Deemer in the 1970s that occurs when the ten-day total advances on the NYSE are greater than 1.97 times the ten-day total NYSE declines.
This indicator calculates the ratio and plots it as a histogram. The 1.97 threshold is also plotted as a horizontal line. Anytime the histogram gets above the line Breakaway Momentum has occurred.
This is a rare signal that has only happened 25 times since 1945.

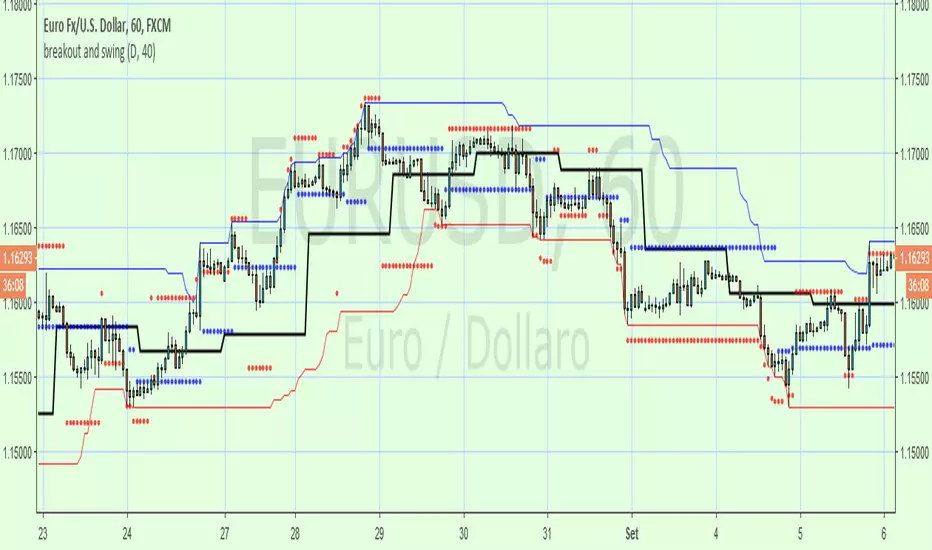
breakout and swingA Price Action system that use swing point and breakout
above the black line (breakout) is long, below short
swing/support/resistance points (blue circles) are displayed after a top or botton, breaking it means an inversion
red circles try to guest a target after a top/bottom or after a swing break.
the main trend is made by the black line that is set on Day period suitable for 1h to 15m time frame , for small TF you can set a smaller period from setting command
By default a set a 40 period channel high/low (the highest and lowest 40 bar back) that is ok for 1 h or smaller tf , but look to long for daily tf, adjust it yourself
Breakout an Reversal Signal Detector with Colored in Bar TrendsThe script detects breakouts and/or reversals: when candles close outside the recent period high or low, it prompts a signal, indicating a change in market trend.
You can customize the bar color to indicate trending phases.
It can be used effectively to identify both breakouts and reversals, making it a versatile tool for trend and reversal analysis.
Simple yet effective.
Enjoy!

Breakout line - AndurilThis line shows the highest daily closing price of last 20 days default (can be adjusted from the settings). to help you to understand consolidation points and breakouts.

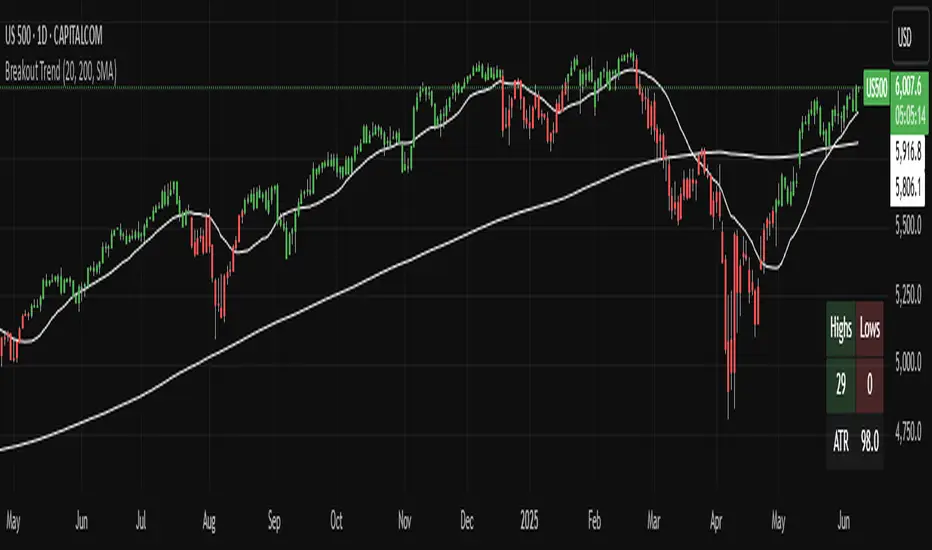
Breakout TrendTiltFolio Breakout Trend indicator
The Breakout Trend indicator is designed to help traders clearly visualize trend direction by combining two complementary techniques: moving averages and Donchian-style breakout logic.
Rather than relying on just one type of signal, this indicator merges short-term and long-term moving averages with breakout levels based on recent highs and lows. The moving averages define the broader trend regime, while the breakout logic pinpoints moments when price confirms directional momentum. This layered approach filters out many false signals while still capturing high-conviction moves.
Yes, these are lagging indicators by design — and that’s the point. Instead of predicting every wiggle, the Breakout Trend waits for confirmation, offering higher signal quality and fewer whipsaws. When the price breaks above a recent high and sits above the long-term moving average, the trend is more likely to persist. That’s when this indicator shines.
While it performs best on higher timeframes (daily/weekly), it's also adaptable to shorter timeframes for intraday traders who value clean, systematic trend signals.
For early signal detection, we recommend pairing this with TiltFolio’s Buying/Selling Proxy, which anticipates pressure buildups—albeit with more noise.
It's easy to read and built for real-world trading discipline.
Breakout mode patterns [yohtza]This indicator detects three kinds of price action patterns:
ii - consecutive inside bars ( high and low inside of the previous bar), triangle on a lower timeframe
oo - consecutive outside bars ( high above the high of the previous bar and the low below the low of the previous bar), expanding triangle on a lower timeframe
ioi - inside outside inside, diamond pattern on a lower timeframe
Traders that trade these patterns are entering on breakouts above/below .When they appear in a trending market, they are good setups for both continuation and reversal swing trades. When they appear in ranging market, they are not nearly as powerful since most breakouts fail in this context. To achieve the highest probability, it is best to trade in the direction of the trend on the last bar in the pattern with a stop loss on the other side and going for a reward that is at least twice the risk.

Breakeven rectangle overlay for move contractI'm sharing this little script allowing you to display a breakeven rectangle for the move contract after manually writing your parameters (strike price, contract price). In case you are long your breakeven (at expiration) is when the price expire outside the rectangle. In case you are short your breakeven (again at expiration) is when the price is staying inside the rectangle at expiration. You can change multiple personalisation parameters as you wish.

Breakout ProAdvanced breakout/breakdown indicator featuring multi-pattern detection, quality tier scoring (S/A/B/C), strength analysis (0-10), VWAP integration, multi-timeframe filters, and adaptive R-based take-profit/stop-loss framework. Includes comprehensive dashboard with real-time metrics and market regime detection.

Breakout Pro_V3Advanced breakout/breakdown indicator featuring multi-pattern detection, quality tier scoring (S/A/B/C), strength analysis (0-10), VWAP integration, multi-timeframe filters, and adaptive R-based take-profit/stop-loss framework. Includes comprehensive dashboard with real-time metrics and market regime detection.

Breakout Pro_V2Advanced breakout/breakdown indicator featuring multi-pattern detection, quality tier scoring (S/A/B/C), strength analysis (0-10), VWAP integration, multi-timeframe filters, and adaptive R-based take-profit/stop-loss framework. Includes comprehensive dashboard with real-time metrics and market regime detection.

Breakout ProAdvanced breakout/breakdown indicator featuring multi-pattern detection, quality tier scoring (S/A/B/C), strength analysis (0-10), VWAP integration, multi-timeframe filters, and adaptive R-based take-profit/stop-loss framework. Includes comprehensive dashboard with real-time metrics and market regime detection.

Breakout Alert Pro + VWAPAdvanced breakout/breakdown indicator featuring multi-pattern detection, quality tier scoring (S/A/B/C), strength analysis (0-10), VWAP integration, multi-timeframe filters, and adaptive R-based take-profit/stop-loss framework. Includes comprehensive dashboard with real-time metrics and market regime detection.

Breakout Alert Pro + VWAPAdvanced breakout/breakdown indicator featuring multi-pattern detection, quality tier scoring (S/A/B/C), strength analysis (0-10), VWAP integration, multi-timeframe filters, and adaptive R-based take-profit/stop-loss framework. Includes comprehensive dashboard with real-time metrics and market regime detection.

Breakout SignalShow big bars closing on the high or low
This script allows you to find highlighted bars (bullish green and bearish red ) for bars that close with a particular Internal Bar Strength and ATR. I set the default at showing bars with an ATR > ATR10 and the IBS can be effected to show if the bar closes at its high or low.
I also put a EMA filter here. i usually set this quite low to about 7 but can be changed depending on your preference.

Breakout Retest ScannerStill working on it, but break the previous day high or low, retest and get an alert of some sort.

Breakout asia USD/CHF1 — Customizable Parameters
sess1 & sess2: The two time ranges that define the Asian session (e.g., 20:00–23:59 and 00:00–08:00).
Important: format is HHMM-HHMM.
rr: The risk/reward ratio (default = 3.0, meaning TP = 3× risk size).
onePerSess: Toggle to allow only one trade per Asian session or multiple.
bufTicks: Extra margin for the SL beyond the signal candle.
2 — Detecting the Asian Session
The script checks if the candle’s time is inside the first range (sess1) or inside the second range (sess2).
While inside the Asian session, it updates the current high and low.
When the session ends, it locks in these levels as rangeHigh and rangeLow.
3 — Step 1: Detecting the Initial Breakout
Bullish breakout → close above rangeHigh → flag breakoutUp is set to true.
Bearish breakout → close below rangeLow → flag breakoutDown is set to true.
No trade yet — this is just the breakout signal.
4 — Step 2: Waiting for the Retest
If a bullish breakout occurred, wait for the price to return to or slightly below rangeHigh and then close back above it.
If a bearish breakout occurred, wait for the price to return to or slightly above rangeLow and then close back below it.
5 — Entry & Exit
When the retest is confirmed:
strategy.entry() is triggered.
SL = behind the retest confirmation candle (with optional bufTicks margin).
TP = entry price ± RR × risk size.
If onePerSess is enabled, no further trades happen until the next Asian session.
6 — Chart Display
Green line = locked Asian session high.
Red line = locked Asian session low.
Light blue background = active Asian session hours.
Trade entries are shown on the chart when retests occur.

Breakout Range Signal with Quality Analysis [Dova Lazarus]📌 Breakout Range Signal with Quality Analysis
🎓 Training-focused indicator for breakout logic, SL & TP behavior and signal quality assessment
🔷 PURPOSE
This tool identifies breakout candles from a calculated channel range and visually simulates entries, stop losses, and take profits, providing live and historical performance metrics.
⚙️ MAIN SETTINGS
1️⃣ Channel Setup
channel_length = 10 → how many candles are averaged to form channel boundaries
channel_multiplier = 0.0 → adds expansion above/below the base channel
channel_smoothing_type = SMA → smoothing method for high/low averaging
📊 The channel consists of two moving averages: one from highs, the other from lows. When expanded (via multiplier), it creates a buffer range for breakout validation.
2️⃣ Signal Detection
Body > Channel % = 50 → a breakout candle's body must exceed 150% of the channel width
Signal Mode:
• Weak → every valid breakout candle is highlighted
• Strong → only the first signal in a sequence is shown (helps reduce noise)
🟦 Bullish signals (blue):
• Candle opens inside the channel
• Closes above the channel
• Body is large enough
• Optional: confirms with trend (if enabled)
🟨 Bearish signals (yellow):
• Candle opens inside the channel
• Closes below the channel
• Body is large enough
• Optional: confirms with trend
3️⃣ Trend Filter (optional)
Enabled via checkbox
Uses a higher timeframe MA to filter signals
Bullish signals are allowed only if price is below the trend MA
Bearish signals only if price is above it
⏱️ trend_timeframe = 1D (typically set higher than the chart's timeframe)
🟢 Trend line is plotted if enabled
🎯 ENTRY, STOP LOSS & TAKE PROFIT LOGIC
SL and TP are based on channel width, not fixed pip/tick size:
📍 Entry Price = close of the breakout candle
🛑 Stop Loss:
• Bullish → below the lower channel border (minus offset)
• Bearish → above the upper channel border (plus offset)
🎯 Take Profit:
• Bullish → entry + channel width × profit multiplier
• Bearish → entry − channel width × profit multiplier
You can control:
Profit Target Multiplier (e.g., 1.0 → TP = 1×channel width)
Stop Loss Target Multiplier (e.g., 0.5 → SL = 0.5×channel width)
Signals to Show = how many historical SL/TP setups to display
📈 Lines and labels ("TP", "SL") are drawn on the chart for clarity.
🧪 QUALITY ANALYSIS MODULE
If enabled, the indicator will:
Track each new signal (entry, SL, TP)
Analyze outcomes:
• Win = TP hit before SL
• Loss = SL hit before TP
• Expired = signal unresolved after N bars
Display statistics in a table (top-right corner):
📋 Table fields:
✅ Overall win rate
📈 Bullish win rate
📉 Bearish win rate
🔢 Total signals
🕓 Pending (still active trades)
Maximum bars to wait for outcome is customizable (max_bars_to_analyze).
📐 VISUALIZATION TOOLS
TP / SL lines per signal
Labels “TP” and “SL”
Optional channel lines and trendline for better context
Colored bars for valid signals (blue/yellow)
📌 BEST USE CASES
Understand how breakout signals are formed
Learn SL/TP logic based on dynamic range
Test how volatility affects trade outcomes
Use as a visual simulation of trade behavior over time

Breakout Strategy with Dynamic SL LabelDescription:
This script identifies breakout trading opportunities using adaptive support and resistance levels, adjusted dynamically based on market volatility. A trade signal is generated only when a breakout candle is followed by a confirming close in the same direction. The signal is displayed on the chart as a labeled marker that includes a suggested stop-loss level based on the highest high or lowest low of the past 10 bars, ensuring structure-aware risk management.
🧩 How it Works:
Adaptive S/R Zones: Based on volatility-normalized swing highs/lows using ATR. These zones automatically adjust to changing market conditions.
Confirmation Logic: Trade signals only appear after the second candle confirms the breakout, helping reduce false signals.
Single Signal Rule: Only one buy or sell label is printed per breakout level, avoiding repeated triggers.
Embedded Stop Loss in Label: SL value is calculated from the 10-bar high (for shorts) or low (for longs) and included in the signal label.
⚙️ User Inputs Explained:
Base Swing Strength: Controls the pivot sensitivity; higher values detect stronger reversal points.
Line Duration: Number of bars that horizontal S/R levels remain visible.
ATR Period: Length used to calculate volatility for adaptive S/R logic.
Volatility Sensitivity: Adjusts how responsive the S/R zone strength is to volatility. Higher = more responsive.
Stop-Loss Lookback (Bars): Defines the number of candles to reference when calculating SL from high/low structure.
Max Lines Stored: Controls chart clutter by limiting how many S/R zones are kept active.
🟩 Ideal for:
Breakout traders who value clean structure, confirmation, and built-in risk logic.
Scalpers and swing traders looking for adaptive, low-latency signals without repainting.
Chartists who want minimal indicators but maximum signal clarity.

Breakout indicatorThis indicator helps traders identify potential breakout levels based on the highest high and lowest low of the last N candles, inspired by the classic Turtle Trading strategy. The period (N) is fully customizable, allowing you to adapt it to your trading style. For daily charts, a period between 50 and 100 is recommended.
The indicator dynamically plots horizontal lines representing the highest high and lowest low over the selected period. These lines are updated in real-time as price action evolves. A breakout is confirmed when the price closes above the high line (for a bullish breakout) or below the low line (for a bearish breakout).
Customize the appearance of the lines with options for thickness, color, and style (solid, dotted, or dashed) to suit your chart preferences. Perfect for traders looking to implement a simple yet effective breakout strategy!
Key Features:
Editable period (N) for high/low calculation.
Real-time updates of high/low levels.
Customizable line thickness, color, and style.
Usage:
Use on daily charts for swing trading or position trading.
Combine with other indicators or price action analysis for better confirmation.
