Crypto Breakout AlertThe indicator plots breakout events of user-defined assets list, providing alert setting for breakout events.
Any big trend begins with a couple of price breakouts. By watching breakout events, we overlook the panorama of the whole market.
---------- Features --------------
User-Defined Crypto / or any Asset List, Up To 30 Assets
User-Defined Breakout Threshold
Accessible for wide timeframes: 5s - 1 Month
Plot the Breakouts History of whole market
Progressive color according to the strength of the breakthrough
--------- Indicator Settings -----------
"Show Bull or Bear?": To show Bull Breakout, Bear Breakout or Both
"User-Defined Breakout Threshold": User can defined the threshold of breakout, default value 999 means using default set up, as following - "Default Breakout Threshold"
"A rate to decrease Bitcoin Threshold": Bitcoin has much lower volatility than other coins, so this rate is usded to lower the threshold for Bitcoin, defval = 0.5
"Use Green for Bull? ": Toggle color for Bull, defval: true, if your region use red for bull, toggle it.
"Exchange": Your exchange name, which is used to defined tickerid, defval="BINANCE", optional - can be empty
"Asset PostFix": postfix of your asset symbol, which is used to define tickerid, defval="USDTP", change it if necessary, this can not be empty.
"Toggle Notice Label": close or open the notice label
--------- Default Breakout Threshold For Popular Timeframes-------------
5s 0.5%
15s 0.75%
30s 0.9%
1m 1.2%
2m 1.4%
3m 1.6%
5m 1.8%
8m 2%
15m 3%
20m 3.5%
30m 4%
60m 5%
120m 6.5%
240m 8%
480m 10%
1D 12%
1W 20%
---------- Versions Description ----------
The features may change later without advance notice.
DEMO version has basic features.
---------- Access to Indicators ----------
Contact the author by Private Chat for access to Invite-Only versions and a trial.
---------- Install Invite Only Version----------
Open the chart -> Add Indicators (On the Top or press /) -> Invite-Only Scripts (last button of the left bar)
Like/Favorite the indicator
Click to install on the chart
---------- About Loading Time ----------
It may take up to 1-3 minutes for your browser to load a new setting, depending on the your computer and network speed. For convenience, you can keep related pages open continuously.
---------- FAQ -----------
1. Why can't I see older breakout labels?
Due to system limit, 500 is the maximum of labels.
In order to see older breakout events, please Select Bull or Bear, instead of Both; Or Increase to filter weak breakouts.
2. How to watch more than 30 coins?
Due to system limit, 30 assets is the maximum.
In order to watch more assets, user can open the indicator in another chart, add your 2nd assets list, save 2nd layout, set alerts for different lists respectively.
---------- Disclaimer ----------
By using or requesting access to the indicator, you acknowledge that you have read and accepted that the indicator and any related content, including but not limited to: user manual, tutorials, ideas, videos, chats, emails, blog, are for the purpose of trading strategies studying and paper trading.
If a customer or user uses the indicator or related content mentioned above for live trading or investment, she/he should take all risks and responsibility of her/his own trading and investment activities.
---------- Updates ----------
The latest updates override the previous description.
To activate a update: Close the browser, Reopen the chart and apply the indicator.
【加密货币突破预警】指标绘制一系列资产的突破事件,提供突破预警
任何大趋势都开始于一系列的价格突破。通过监控突破事件,可以俯瞰市場的運動
---------- 产品特征------------
用户自定义的加密货币品种列表,或者其他资产列表,多达30个品种
用户自定义的突破门槛
适用于宽泛的时间维度:5秒--1月
绘制整个市场的突破历史
漸進顏色 根據突破的力度
------------- 指标设置说明 -------------------
"展示牛熊突破?": 展示牛突破,熊突破或者两者
“用户自定义突破门槛”: 自己定义突破门槛,999代表默认的设置,详见下方“默认的突破门槛”
"比特币突破门槛修正": 比特币的波动性远远低于其他加密货币,这个比率用来调低比特币的门槛
"切换通知标签": 用来开关通知标签
"綠色為牛?": 切換標籤顏色,默認綠色為牛
“交易所”:用来定义资产名称,可以为空
“资产后缀”: 用来定义资产名称,不可以为空
---------默認的突破門檻-------------
5s 0.5%
15s 0.75%
30s 0.9%
1m 1.2%
2m 1.4%
3m 1.6%
5m 1.8%
8m 2%
15m 3%
20m 3.5%
30m 4%
60m 5%
120m 6.5%
240m 8%
480m 10%
1D 12%
1W 20%
---------- 版本描述 ----------------
產品特徵後續可能變化,恕不事先通知
DEMO版本供試用
----------- 獲取指標使用權 ------------
通過私信聯繫作者,要求訂閱或試用
----------- 安裝指標 -----------------
加指標 -》 Invite-Only (左邊欄目)
點贊或者收藏指標
點擊安裝指標
----------- 關於載入時間 ---------------
可能需要1--3分鐘來完成載入,取決於用戶的電腦和網絡速度,方便起見可以保持相關頁面持續開啟
------- FAQ ----------
1. 如何查看更早的突破歷史
由於系統限制,500 個標籤是上限
為了查看更早的突破,請選擇牛或者熊,而不是兩者;或者提高"用戶自定義突破門檻" 來過濾掉弱突破
2. 如何監控更多資產?
由於系統限制,30個資產是上限
為了監控更多資產,可以在第二個圖表加載指標,保存圖表,分別在不同的圖表設置突破預警
---------- 免責聲明 ----------
在要求獲得本指標使用權之前以及在使用本指標之前,用戶認可已經完全了解和接受:本指標僅供學習交流目的, 它不構成任何交易建議或者投資建議。用戶如果將指標用於其他用途,應自行承擔所有風險和責任。
本指標的開發者並非專業投資顧問,因此不對用戶的任何行为負責。
最近的更新會覆蓋之前的說明。請參閱更新來查看指標的新特徵和功能。
חפש סקריפטים עבור "breakout"

Multi-Band Breakout IndicatorThe Multi-Band Breakout Indicator was created to help identify potential breakout opportunities in the market. It combines multiple bands (ATR-Based and Donchian) and moving averages to provide valuable insights into the underlying trend and potential breakouts. By understanding the calculations, interpretation, parameter adjustments, potential applications, and limitations of the indicator, traders can effectively incorporate it into their trading strategy.
Calculation:
The indicator utilizes several calculations to plot the bands and moving averages. The length parameter determines the period used for the Average True Range (ATR), which measures volatility. A higher length captures a longer-term view of price movement, while a lower length focuses on shorter-term volatility. The multiplier parameter adjusts the distance of the upper and lower bands from the ATR. A higher multiplier expands the bands, accommodating greater price volatility, while a lower multiplier tightens the bands, reflecting lower volatility. The MA Length parameter determines the period for the moving averages used to calculate the trend and trend moving average. A higher MA Length creates a smoother trend line, filtering out shorter-term fluctuations, while a lower MA Length provides a more sensitive trend line.
The Donchian calculations in the Multi-Band Breakout Indicator play a significant role in identifying potential breakout opportunities and providing additional confirmation for trading signals. In this indicator, the Donchian calculations are applied to the trend line, which represents the average of the upper and lower bands. To calculate the Donchian levels, the indicator uses the Donchian Length parameter, which determines the period over which the highest high and lowest low are calculated. A longer Donchian Length captures a broader price range, while a shorter length focuses on more recent price action. By incorporating the Donchian calculations into the Multi-Band Breakout Indicator, traders gain an additional layer of confirmation for breakout signals.
Interpretation:
The Multi-Band Breakout Indicator offers valuable interpretation for traders. The upper and lower bands represent dynamic levels of resistance and support, respectively. These bands reflect the potential price range within which the asset is expected to trade. The trend line is the average of these bands and provides a central reference point for the overall trend. When the price moves above the upper band, it suggests a potential overbought condition and a higher probability of a pullback. Conversely, when the price falls below the lower band, it indicates a potential oversold condition and an increased likelihood of a bounce. The trend moving average further smooths the trend line, making it easier to identify the prevailing direction.
The crossover of the trend line (representing the average of the upper and lower bands) and the trend moving average holds a significant benefit for traders. This crossover serves as a powerful signal for potential trend changes and breakout opportunities in the market. When the trend line crosses above the trend moving average, it suggests a shift in momentum towards the upside, indicating a potential bullish trend. This provides traders with an early indication of a possible upward movement in prices. Conversely, when the trend line crosses below the trend moving average, it indicates a shift in momentum towards the downside, signaling a potential bearish trend. This crossover acts as an early warning for potential downward price movement. By identifying these crossovers, traders can capture the initial stages of a new trend, enabling them to enter trades at favorable entry points and potentially maximize their profit potential.
Breakout Signals:
For bullish breakouts, the indicator looks for a bullish crossover between the trend line and the trend moving average. This crossover suggests a shift in momentum towards the upside. Additionally, it checks if the current price has broken above the upper band and the previous Donchian high. This confirms that the price is surpassing a previous resistance level, indicating further upward movement.
For bearish breakouts, the indicator looks for a bearish crossunder between the trend line and the trend moving average. This crossunder indicates a shift in momentum towards the downside. It also checks if the current price has broken below the lower band and the previous Donchian low. This confirms that the price is breaking through a previous support level, signaling potential downward movement.
When a bullish or bearish breakout is detected, it suggests a potential trading opportunity. Traders may consider initiating positions in the direction of the breakout, anticipating further price movement in that direction. However, it's important to remember that breakouts alone do not guarantee a successful trade. Other factors, such as market conditions, volume, and confirmation from additional indicators, should be taken into account. Risk management techniques should also be implemented to manage potential losses.
Coloration:
The coloration in the Multi-Band Breakout Indicator is used to visually represent different aspects of the indicator and provide valuable insights to traders. Let's break down the coloration components:
-- Trend/Basis Color : The tColor variable determines the color of the bars based on the relationship between the trend line (trend) and the closing price (close), as well as the relationship between the trend line and the trend moving average (trendMA). If the trend line is above the closing price and the trend moving average is also above the closing price, the bars are colored fuchsia, indicating a potential bullish trend. If the trend line is below the closing price and the trend moving average is also below the closing price, the bars are colored lime, indicating a potential bearish trend. If neither of these conditions is met, the bars are colored yellow, representing a neutral or indecisive market condition.
-- Moving Average Color : The maColor variable determines the color of the filled area between the trend line and the trend moving average. If the trend line is above the trend moving average, the area is filled with a lime color with 70% opacity, indicating a potential bullish trend. Conversely, if the trend line is below the trend moving average, the area is filled with a fuchsia color with 70% opacity, indicating a potential bearish trend. This coloration helps traders visually identify the relationship between the trend line and the trend moving average.
-- highColor and lowColor : The highColor and lowColor variables determine the colors of the high Donchian band (hhigh) and the low Donchian band (llow), respectively. These bands represent dynamic levels of resistance and support. If the highest point in the previous Donchian period (hhigh) is above the upper band, the highColor is set to olive with 90% opacity, indicating a potential resistance level. On the other hand, if the lowest point in the previous Donchian period (llow) is below the lower band, the lowColor is set to red with 90% opacity, suggesting a potential support level. These colorations help traders quickly identify important price levels and assess their significance in relation to the bands.
By incorporating coloration, the Multi-Band Breakout Indicator provides visual cues to traders, making it easier to interpret the relationships between various components and assisting in identifying potential trend changes and breakout opportunities. Traders can use these color cues to quickly assess the prevailing market conditions and make informed trading decisions.
Adjusting Parameters:
The Multi-Band Breakout Indicator offers flexibility through parameter adjustments. Traders can customize the indicator based on their preferences and trading style. The length parameter controls the sensitivity to price changes, with higher values capturing longer-term trends, while lower values focus on shorter-term price movements. By adjusting the parameters, such as the ATR length, multiplier, Donchian length, and MA length, traders can customize the indicator to suit different timeframes and trading strategies. For shorter timeframes, smaller values for these parameters may be more suitable, while longer timeframes may require larger values.
Potential Applications:
The Multi-Band Breakout Indicator can be applied in various trading strategies. It helps identify potential breakout opportunities, allowing traders to enter trades in the direction of the breakout. Traders can use the indicator to initiate trades when the price moves above the upper band or below the lower band, confirming a potential breakout and providing a signal to enter a trade. Additionally, the indicator can be combined with other technical analysis tools, such as support and resistance levels, candlestick patterns, or trend indicators, to increase the probability of successful trades. By incorporating the Multi-Band Breakout Indicator into their trading approach, traders can gain a better understanding of market trends and capture potential profit opportunities.
Limitations:
While the Multi-Band Breakout Indicator is a useful tool, it has some limitations that traders should consider. The indicator performs best in trending markets where price movements are relatively strong and sustained. During ranging or choppy market conditions, the indicator may generate false signals, leading to potential losses. It is crucial to use the indicator in conjunction with other analysis techniques and risk management strategies to enhance its effectiveness. Additionally, traders should consider external factors such as market news, economic events, and overall market sentiment when interpreting the signals generated by the indicator.
By combining multiple bands and moving averages, this indicator offers valuable insights into the underlying trend and helps traders make informed trading decisions. With customization options and careful interpretation, this indicator can be a valuable addition to any trader's toolkit, assisting in identifying potential breakouts, capturing profitable trades, and enhancing overall trading performance.

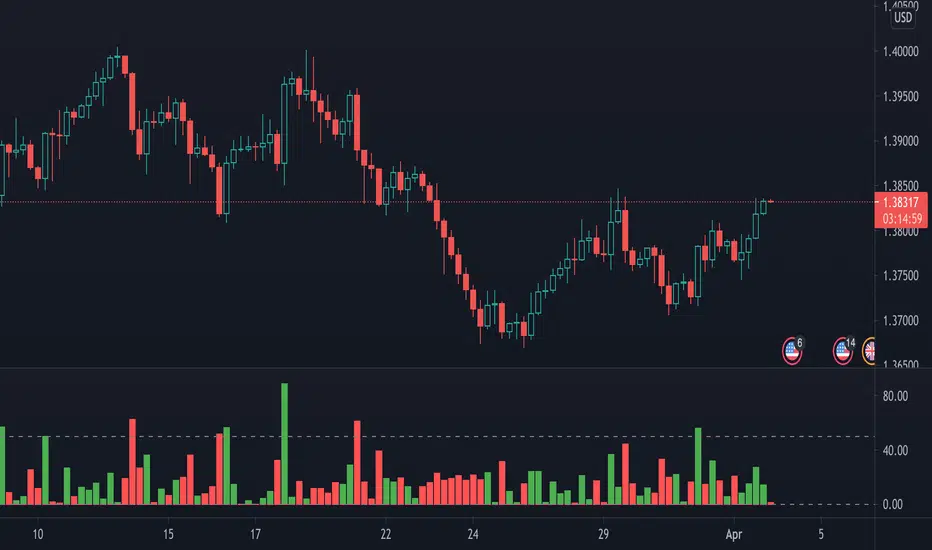
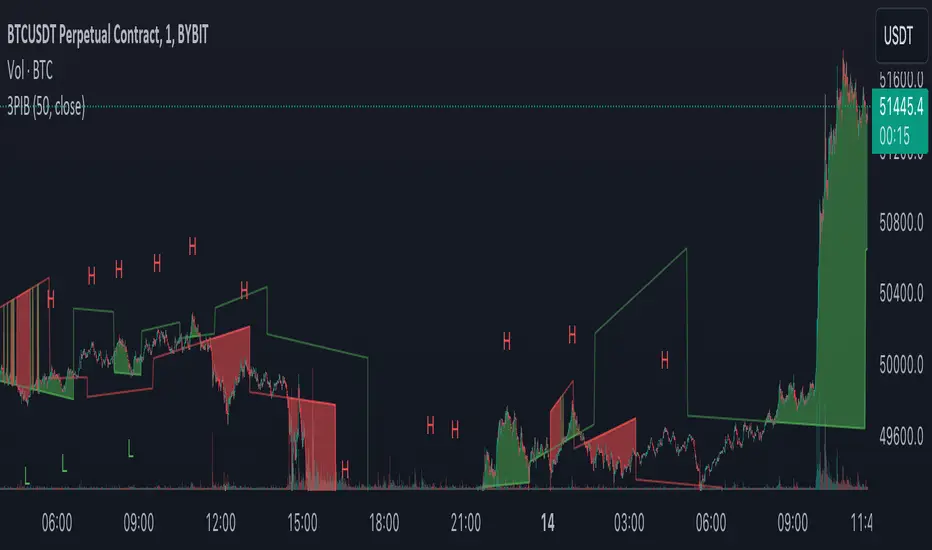
Pips Breakout CandlePips Breakout Candle measures price changes in pips. This indicator can be used to identify major price moves! The indicator comes with a sentiment line which is the sum of the Up versus Down price changes. It gives a good understanding of the current trend and identifies divergences.
Set alerts for major price moves!
Identify the trend!
Identify divergence!
Crypto Breakout Alert DEMOThe indicator plots breakout events of user-defined assets list, providing alert setting for breakout events.
Any big trend begins with a couple of price breakouts. By watching breakout events, we overlook the panorama of the whole market.
Version: DEMO
---------- Features --------------
User-Defined Crypto / or any Asset List, Up To 30 Assets, Demo has some limit
User-Defined Breakout Threshold
Accessible for wide timeframes: 5s - 1 Month, Demo has some limit
Plot the Breakouts History of whole market
Progressive color according to the strength of the breakthrough
--------- Indicator Settings -----------
"Show Bull or Bear?": To show Bull Breakout, Bear Breakout or Both
"User-Defined Breakout Threshold": User can defined the threshold of breakout, default value 999 means using default set up, as following - "Default Breakout Threshold"
"A rate to decrease Bitcoin Threshold": Bitcoin has much lower volatility than other coins, so this rate is usded to lower the threshold for Bitcoin , defval = 0.5
"Use Green for Bull? ": Toggle color for Bull, defval: true, if your region use red for bull, toggle it.
"Exchange": Your exchange name, which is used to defined tickerid, defval="BINANCE", optional - can be empty
"Asset PostFix": postfix of your asset symbol, which is used to define tickerid, defval="USDTP", change it if necessary, this can not be empty.
"Toggle Notice Label": close or open the notice label
--------- Default Breakout Threshold For Popular Timeframes-------------
5s 0.5%
15s 0.75%
30s 0.9%
1m 1.2%
2m 1.4%
3m 1.6%
5m 1.8%
8m 2%
15m 3%
20m 3.5%
30m 4%
60m 5%
120m 6.5%
240m 8%
480m 10%
1D 12%
1W 20%
---------- Versions Description ----------
The features may change later without advance notice.
DEMO version has basic features.
---------- Access to Indicators ----------
Contact the author by Private Chat for access to Invite-Only versions and a trial.
---------- Install Invite Only Version----------
Open the chart -> Add Indicators (On the Top or press /) -> Invite-Only Scripts (last button of the left bar)
Like/Favorite the indicator
Click to install on the chart
---------- About Loading Time ----------
It may take up to 1-3 minutes for your browser to load a new setting, depending on the your computer and network speed. For convenience, you can keep related pages open continuously.
---------- FAQ -----------
1. Why can't I see older breakout labels?
Due to system limit, 500 is the maximum of labels.
In order to see older breakout events, please Select Bull or Bear, instead of Both; Or Increase to filter weak breakouts.
2. How to watch more than 30 coins?
Due to system limit, 30 assets is the maximum.
In order to watch more assets, user can open the indicator in another chart, add your 2nd assets list, save 2nd layout, set alerts for different lists respectively.
---------- Disclaimer ----------
By using or requesting access to the indicator, you acknowledge that you have read and accepted that the indicator and any related content, including but not limited to: user manual, tutorials, ideas, videos, chats, emails, blog, are for the purpose of trading strategies studying and paper trading.
If a customer or user uses the indicator or related content mentioned above for live trading or investment, she/he should take all risks and responsibility of her/his own trading and investment activities.
---------- Updates ----------
The latest updates override the previous description.
To activate a update: Close the browser, Reopen the chart and apply the indicator.
【加密货币突破预警】指标绘制一系列资产的突破事件,提供突破预警
任何大趋势都开始于一系列的价格突破。通过监控突破事件,可以俯瞰市場的運動
版本 DEMO
---------- 产品特征------------
用户自定义的加密货币品种列表,或者其他资产列表,多达30个品种, DEMO 有限品种
用户自定义的突破门槛
适用于宽泛的时间维度:5秒--1月, DEMO 有限制
绘制整个市场的突破历史
漸進顏色 根據突破的力度
------------- 指标设置说明 -------------------
"展示牛熊突破?": 展示牛突破,熊突破或者两者
“用户自定义突破门槛”: 自己定义突破门槛,999代表默认的设置,详见下方“默认的突破门槛”
"比特币突破门槛修正": 比特币的波动性远远低于其他加密货币,这个比率用来调低比特币的门槛
"切换通知标签": 用来开关通知标签
"綠色為牛?": 切換標籤顏色,默認綠色為牛
“交易所”:用来定义资产名称,可以为空
“资产后缀”: 用来定义资产名称,不可以为空
---------默認的突破門檻-------------
5s 0.5%
15s 0.75%
30s 0.9%
1m 1.2%
2m 1.4%
3m 1.6%
5m 1.8%
8m 2%
15m 3%
20m 3.5%
30m 4%
60m 5%
120m 6.5%
240m 8%
480m 10%
1D 12%
1W 20%
---------- 版本描述 ----------------
產品特徵後續可能變化,恕不事先通知
DEMO版本供試用
----------- 獲取指標使用權 ------------
通過私信聯繫作者,要求訂閱或試用
----------- 安裝指標 -----------------
加指標 -》 Invite-Only (左邊欄目)
點贊或者收藏指標
點擊安裝指標
----------- 關於載入時間 ---------------
可能需要1--3分鐘來完成載入,取決於用戶的電腦和網絡速度,方便起見可以保持相關頁面持續開啟
------- FAQ ----------
1. 如何查看更早的突破歷史
由於系統限制,500 個標籤是上限
為了查看更早的突破,請選擇牛或者熊,而不是兩者;或者提高"用戶自定義突破門檻" 來過濾掉弱突破
2. 如何監控更多資產?
由於系統限制,30個資產是上限
為了監控更多資產,可以在第二個圖表加載指標,保存圖表,分別在不同的圖表設置突破預警
---------- 免責聲明 ----------
在要求獲得本指標使用權之前以及在使用本指標之前,用戶認可已經完全了解和接受:本指標僅供學習交流目的, 它不構成任何交易建議或者投資建議。用戶如果將指標用於其他用途,應自行承擔所有風險和責任。
本指標的開發者並非專業投資顧問,因此不對用戶的任何行为負責。
最近的更新會覆蓋之前的說明。請參閱更新來查看指標的新特徵和功能。

Anchorman - EMA Channel + EMA + MTF Status Table PRICE BREAKOUTUses a high/low EMA Channel to tell you when strong price breakouts are happening plus comes with a EMA to help follow the trend if you like. I designed it so it can alert you when a single TF touch happens or a breakout alignment on MTF happens (I recommend this) its up to you also its single alert so no need to do bullish or bearish signals just one signal will alert you when a breakout happens in EITHER direction.

Breakouts with Trailing Stops V6 + AlertsBreakouts with Trailing Stops in Trading
Breakout trading is a strategy where traders aim to profit from an asset's price moving outside a defined support or resistance level, signaling a potential new trend. Trailing stops are a key risk management tool often used with breakouts to protect profits and limit potential losses.
What is a breakout?
A breakout occurs when an asset's price moves decisively above a resistance level (for a bullish breakout) or below a support level (for a bearish breakdown). This often signals increased momentum and potential for a significant price movement in the direction of the breakout.
Why use trailing stops with breakouts?
Trailing stops are particularly useful in breakout trading because they allow traders to capture potential profits as the price moves in their favor, while automatically adjusting to protect against sudden reversals.
How do trailing stops work with breakouts?
Initial Stop-Loss: When entering a breakout trade, a traditional stop-loss order is placed at a predetermined level to limit potential losses if the price reverses. For example, in a long position after a resistance breakout, the initial stop-loss might be placed below the former resistance level (which can now act as support).
Trailing Stop Activation: Once the price moves a favorable distance beyond the entry point, the trailing stop loss is activated. As highlighted by StoneX, it is a dynamic order that follows the price as it continues to move in the desired direction, maintaining a set distance below (for a long position) or above (for a short position) the current market price.
Profit Locking: If the price continues to rise (or fall for a short position), the trailing stop will move with it, "locking in" profits by raising the stop-loss level.
Exit Strategy: If the price reverses and hits the trailing stop, the position is automatically closed, ensuring that the trader retains a portion of the gains made while in the trade.
Advantages of using trailing stops with breakouts:
Locks in profits: Trailing stops help protect profits generated from successful breakout trades.
Automates exits: They automate the exit process, helping traders avoid emotional decision-making when the price reverses.
Allows for potential gains: They allow traders to stay in profitable trades as long as the trend continues.
Disadvantages of using trailing stops with breakouts:
Whipsaw risk: In volatile markets, the trailing stop may be triggered prematurely by minor price fluctuations.
Potential for missed gains: If the trailing stop is set too tightly, it may prevent the trader from capturing the maximum potential gains if the price experiences a minor pullback before continuing in the desired direction.
Tips for using trailing stops with breakouts:
Consider the asset's volatility: Adjust the trailing stop distance based on the asset's volatility to minimize the risk of premature stops.
Test different trailing stop methods: Experiment with different trailing stop methods to find what works best for your trading style and the specific asset you are trading.
Backtest your strategy: Before applying a trailing stop strategy to live trading, backtest it on historical data to evaluate its performance under different market conditions.
Combine with other indicators: Use other technical indicators, such as volume or momentum oscillators, to confirm the validity of breakouts and improve the effectiveness of your trailing stop strategy.
By carefully considering the market dynamics, using appropriate indicators, and implementing proper risk management techniques, traders can effectively utilize trailing stops with breakouts to capture potential profits while minimizing risk.
Have a good trade.

ADR Checker - Breakouts📈 ADR Checker – Breakouts
Gain the edge by knowing when a stock has already made its move.
🚀 What It Does:
The ADR Checker - Breakouts is a powerful yet simple visual tool that helps traders instantly assess whether a stock has already exceeded its Average Daily Range (ADR) for the day — a critical piece of information for momentum traders, swing traders, and especially those following breakout, VCP, or CANSLIM strategies.
Using a customizable on-screen table that always stays in view (regardless of zoom or chart scaling), this script shows:
✅ Average ADR% – 20-day average range, calculated in %.
📊 Today’s Move – how much the stock has moved today.
🔥 % of Avg ADR – today's move relative to its historical average, with live color feedback:
🟥 Over 100% (Overextended – danger!)
🟧 70-100% (Caution zone)
🟩 Below 70% (Room to move)
💡 Why It Matters:
One of the most overlooked mistakes by breakout traders is entering a trade after the move has already happened. If a stock has already moved more than its typical daily range, the odds of further continuation sharply decrease, while the risk of pullback or chop increases.
With this tool, you can:
🚫 Avoid chasing extended breakouts
🎯 Time entries before the real move
⚠️ Quickly assess risk/reward potential intraday
🧠 Example Use Case:
Imagine you're watching a classic VCP setup or flat base breakout. The stock breaks out on volume—but when you check this indicator, you see:
Today’s Move: 7.2%
Avg ADR: 5.3%
% of ADR: 135% 🟥
This tells you the stock is already well beyond its average daily range. While it may continue higher, odds now favor a consolidation, shakeout, or pullback. This is your cue to wait for a better entry or pass entirely.
On the flip side, if the breakout just started and the % of ADR is still under 50%, you have confirmation that there’s room to run — giving you more confidence to enter early.
⚙️ Fully Customizable:
Choose position on screen (top/bottom left/right)
Customize text color, background, and size
🔧 Install This Tool and:
✅ Stop chasing extended moves
✅ Add discipline to your entries
✅ Improve your breakout win rate
Perfect for VCP, CANSLIM, and BREAKOUT traders who want a clean, edge-enhancing visual guide.

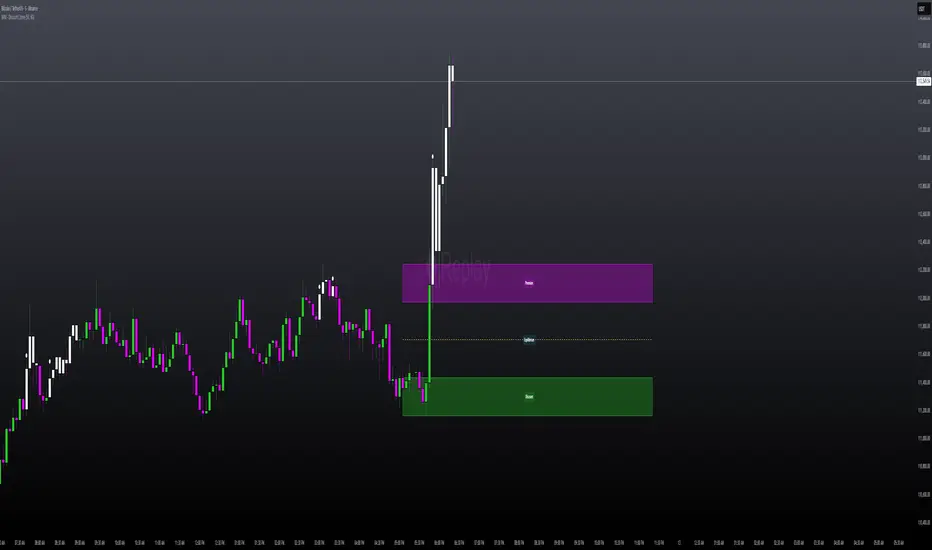
MILLION MEN - Discount Zone BreakoutsWhat it is
MILLION MEN — Discount Zone Breakouts (Lite & Stable) highlights a structure-based trading range from the latest confirmed swing high/low, renders Premium/Equilibrium/Discount zones, and raises one-shot breakout signals when price closes outside the range. It focuses on stable visuals and simple breakout logic suitable for intraday and swing trading.
How it works (high-level)
Confirmed swings: Uses ta.pivothigh/ta.pivotlow with auto or manual pivot length.
Range & zones: From the swing range, the tool derives Premium (top 25%), Equilibrium (50%), and Discount (bottom 25%).
Anchoring: Left edge is locked at the bar where the pivot confirms; the right edge can extend N bars.
One-shot breakouts:
Up breakout: first close > swingHigh (resets on new range).
Down breakout: first close < swingLow (resets on new range).
Optional on-close only mode to avoid intrabar noise.
Clean UI: Optional zone boxes, dashed equilibrium line, mid-labels (“Premium / Equilibrium / Discount”), and minimal candle coloring by regime.
How to use
Treat Discount as value area in bullish contexts and Premium as distribution area in bearish contexts.
Breakout dots (up/down) mark regime shifts beyond the current range; confirm with your higher-TF bias, volume, or momentum.
Tune pivot length and forward extension to your timeframe (e.g., smaller for scalping, larger for swings).
Originality & value
Unlike generic S/R overlays, this lite tool prioritizes confirmed swing structure with a fixed anchor, clear 25/50/75 zone mapping, and one-shot breakout logic to prevent repetitive signals until a new range forms. The emphasis is on stability + readability, making it a dependable building block in multi-indicator workflows.
Limitations & transparency
Breakouts on strong trends can retest or fail; always add confirmation (structure/volume).
Pivots confirm with delay equal to pivot length—this reduces repaint and is intentional.
Non-standard bar types are not supported for signal logic.
This indicator provides analysis, not financial advice.
Arabic
يعرض السكربت آخر مدى مؤكد من قمّة/قاع ويرسم مناطق Premium / Equilibrium / Discount، ويعطي إشارة اختراق لمرة واحدة عند إغلاق السعر فوق القمّة أو تحت القاع. الفكرة بسيطة وثابتة بصريًا، وتصلح للإنترادي والسوينغ. يُفضّل تأكيد الاختراق بهيكل أعلى إطار أو فوليوم/مومنتُم. تذكير: تأكيد القمم/القيعان متأخر بحسب طول البيفوت لتفادي إعادة الرسم.
Trendline Breakouts With Volume Strength [TradeDots]Trendline Breakouts With Volume Strength is an innovative indicator designed to identify potential market turning points using pivot-based trendline detection and volume confirmation. By merging dynamic trendline analysis with multi-tiered volume filters, this tool helps traders quickly spot breakouts or breakdowns that may signal significant shifts in price action.
📝 HOW IT WORKS
1. Pivot-Based Trendline Detection
The script automatically scans for recent pivot highs and lows over a user-defined lookback period.
When it finds higher pivot lows, it plots green uptrend lines; when it finds lower pivot highs, it plots red downtrend lines.
These dynamic lines update as new pivots form, providing continuously refreshed trend guidance.
2. Volume Ratio Analysis
A moving average of volume is compared against the current bar’s volume to calculate a ratio (e.g., 1.5×, 2×).
Higher ratios suggest above-average volume, often interpreted as stronger participation.
The script applies color-coded cues to highlight the intensity of volume surges.
3. Breakout & Breakdown Detection
Each trendline is monitored for a defined “break threshold,” which helps avoid minor penetrations that can trigger premature signals.
When price closes beyond a threshold below an uptrend line, the indicator labels it a “BREAKDOWN.” If it closes above a threshold on a downtrend line, it labels it a “BREAKOUT.”
Volume surges accompanying these breaks are highlighted with contextual emojis and distinct color gradients for quick visual reference.
4. Trend Direction Table
A small on-chart table provides a snapshot of the current market trend—Uptrend, Downtrend, or Sideways—based on a simple moving average slope and the number of active uptrend or downtrend lines.
This table also displays quick stats on how many lines are actively tracked, helping traders assess the broader market posture at a glance.
🛠️ HOW TO USE
1. Choose a Timeframe
This script works on multiple timeframes. Intraday traders can monitor minute or hourly charts for frequent pivot updates, while swing and position traders may prefer daily or weekly intervals to reduce noise.
2. Observe Trendlines & Labels
Watch for newly drawn green/red lines connecting pivots.
When you see a “BREAKOUT” or “BREAKDOWN” label, confirm whether volume was abnormally high based on the ratio or color-coded bars.
3. Consult the Trend Table
Use the table in the bottom-right corner to quickly check if the market is trending or range-bound.
Look at the count of active uptrend vs. downtrend lines to gauge broader sentiment.
4. Employ Additional Analysis
Combine these signals with other tools (e.g., candlestick patterns, oscillators, or fundamental analysis).
Validate potential breakouts using standard techniques like retests or support/resistance checks.
❗️LIMITATIONS
Delayed Pivots: Trendlines only adjust once new pivot highs or lows form, which can introduce a slight lag in highly volatile environments.
Choppy Markets: Rapid, back-and-forth price moves may produce conflicting trendline signals and frequent breakouts/breakdowns.
Volume Data Reliability: Gaps in volume data or unusual market conditions (holidays, low-liquidity sessions) can skew ratio readings.
RISK DISCLAIMER
Trading any financial instrument involves substantial risk, and this indicator does not guarantee profits or prevent losses. All signals and visual cues are for educational and informational purposes only; past performance does not assure future outcomes. You retain full responsibility for your trading decisions, including proper risk management, position sizing, and the use of additional confirmation methods. Always consider the possibility of losing some or all of your original investment.

Session Breakout Detector (SBD)Overview:
The Session Breakout Detector (SBD) is a TradingView indicator designed to identify and visualize breakouts from major trading sessions. It tracks a selected session (Tokyo, London, or New York) and detects price movements beyond the session's high or low, assisting traders in spotting potential breakout opportunities.
Key Features:
- Session Selection: Choose between Tokyo, London, or New York sessions.
- Breakout Detection Modes:
- Confirmed Bar: Detects breakouts when a candle closes beyond the session's range.
- Intrabar: Detects breakouts as soon as the price exceeds the session's high or low within a
candle.
- Visual Indicators:
- Displays session high, low, and range with a colored box for clear visualization.
- Marks breakouts with green (bullish) or red (bearish) triangles.
- Optional 50-Period SMA: Adds a 50-period Simple Moving Average to the chart for trend
analysis.
- Alerts: Configurable alerts for bullish and bearish breakouts.
Usage Instructions:
1. Select Session: Choose the desired trading session (Tokyo, London, or New York) from the
input settings.
2. Choose Breakout Detection Mode: Select between 'By confirmed bar' or 'By intrabars' based
on your trading preference.
3. Enable SMA (Optional): Toggle the 'Use SMA?' option to display the 50-period Simple Moving
Average.
4. Set Alerts: Configure alerts for breakout signals as per your trading strategy.
⚠️Note: This indicator is intended for informational purposes only and should not be construed as financial advice. Users are encouraged to conduct their own research and consider their individual risk tolerance before making trading decisions.

Closing Range BreakoutIndicator Description:
This tool tracks the closing price range of a trading session (like New York or London market hours) and highlights potential breakout opportunities. It shows:
Extended Range Lines: Drawn after the session closes, marking the high/low of the session's final hour.
Breakout Arrows: Appear when prices close above/below the range for a user-defined number of consecutive bars.
Session Background: Gray highlight during the selected market's closing hour.
It helps traders spot momentum shifts by focusing on price behavior relative to the closing range, with customizable alerts for confirmed breakouts.
How to Use:
Select Session: Choose your market's closing hour (e.g., New York/London).
Set Confirmation: Adjust how many closes are needed to confirm a breakout.
Watch Visuals:
Gray background = Active closing session
Blue range = Extended high/low from last session
Arrows = First breakout signal
Trade Signals: Price closing outside the range triggers alerts (labels update automatically).
Focus on breakouts with momentum, using the range as support/resistance.

3 Pivots Interpolation BreakoutsI designed the '3 Pivots Interpolation Breakouts' indicator to intuitively identify breakout opportunities using pivot points. This tool stems from my need to anticipate market direction and capitalize on breakouts. It uses a line interpolated from three pivot highs or lows to forecast upcoming breakouts. This offers a straightforward way to visualize potential bullish and bearish breakouts with color-coded extrapolations. The aim is to simplify breakout detection, enhancing your trading strategy with precise, actionable insights.
Sublime Trading | Donchian Breakout SignalsWhat kind of traders/investors are we?
We are trend followers. Our scripts are designed to be used on the higher timeframes (weekly/daily) to catch the large moves/trends in the market.
Most have heard of long-term trend following. Few know how to execute the strategy.
Our scripts are designed specifically to identify and invest in long-term market trends.
What does this script do?
It produces entry signals in a confirmed bull and bear trend.
The logic is based on Donchian 20, which serves the following two purposes:
1. Confirms end-of-day entry points in a long-term trend
2. Filters out entry points in a sideways market
The signal is produced on a break and close of the Donchian 20 high in a bull trend and a break and close of the Donchian 20 low in a bear trend.
How is the entry price produced?
The entry is based on a percentage value of the range of the breakout bar added to the high of the bar in a bull trend.
In a bear trend, the percentage is subtracted from the low of the bar.
This gives an objective entry when placing a position once the OHLC of a bar is confirmed at the end of the trading day.
How is the stoploss price produced?
The script uses the formula ATR 15 x 4.
We use ATR as it produces a stoploss which is unique to the volatility of the asset. The more volatile the asset, the wider the stoploss.
We use ATR 15 as it brings an average reading across half a month, incorporating days of extreme volatility.
The multiplier 4 works well to avoid positions being stopped out prematurely on pullbacks.
When the stoploss is hit, there is when traders and investors may consider exiting positions.
What is the best timeframe to use the script?
We recommend the daily timeframe as this is where trader and investors identify and enter long-term market trends.
The higher timeframes are where traders and investors take fewer positions but hold for longer time periods.
As a result, trend followers place priority on the quality of the entry rather than quantity.
What makes this script unique?
This script has been coded specifically for the daily timeframe to:
Highlight the start of a potential long-term trends.
Confirm entry points at the end of the trading day, absorbing intraday noise.
Reduce fake breakouts in a trend.
Continue to create entry points as the trend develops to allow for compounding.
Filter out breakouts in a sideways market.
This entry signal script helps traders and investors focus on the quality of a potential position when investing in long-term market trends.

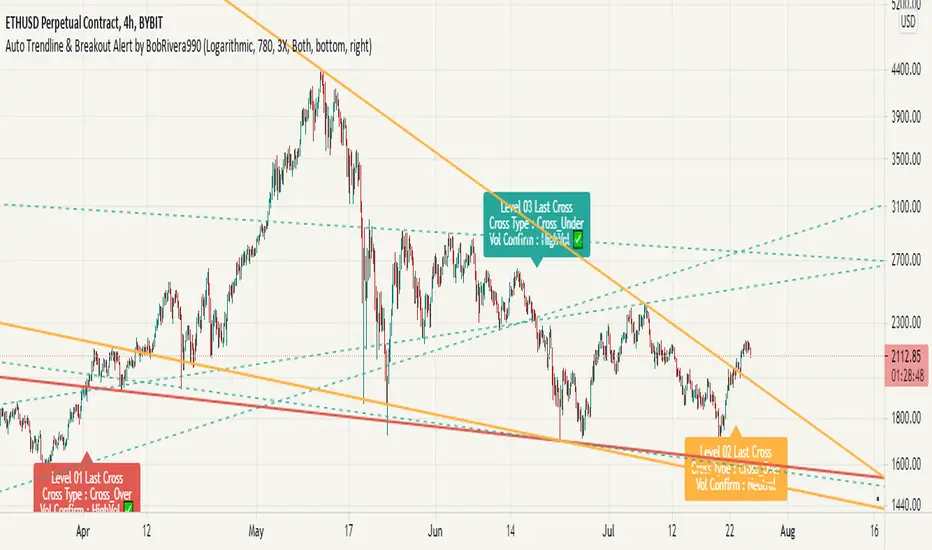
Auto Trendline & Breakout Alert(Linear / Log) Full-VersionContents
Overall Introduction
Does it repaint?
Features
Settings menu parameters
How to setup
Limits
Errors and Performance
Examples
Overall Introduction
This indicator is the best tool for breakout traders.
Drawing and evaluating the trend lines of multiple charts in different time frames is a very time-consuming and tedious task. In addition, being aware of breakouts in the shortest possible time requires constant monitoring.
With this tool, you can draw and classify trend lines in a fraction of a second and by placing an alert on any chart, you can receive notifications about breakouts, wherever you are.
The classification of trend lines is done based on the reaction of the price chart to the trend lines and the analysis of the trading volume.
This indicator is designed to reclassify trend lines with each reaction of the price chart. These lines are classified into 6 levels and these levels are distinguished by different colors. Thus, any touching or crossing of the price chart can make a difference.
Does it repaint?
Any tool that shows trend lines must repaint because trend lines are constantly changing. Some lines lose their strength and new ones are formed, so some lines should be removed and replaced with new lines and that means repainting.
The indicator should reflect the latest changes. So while repainting is a bad thing in a strategy, it is essential in this indicator.
This indicator is designed to reclassify trend lines with each reaction of the price chart. Thus, any touching or crossing of the price chart can make a difference.
Note that unlike alerts, breakout labels are not trading signals:
Breakout labels show the latest breakout for each level based on the lines that appear on the chart, so they may repaint or have delay.
But Alerts work differently, Alerts are triggered when one of the trend lines is broken and then the next candle is opened and has no any delay.
Features
This indicator is designed for use on both linear and logarithmic scales. It works linearly by default. If you are using a logarithmic chart, enter the settings menu and set the chart scale parameter to “Log”.
The indicator is equipped with the volume status tool to identify and avoid false breakouts. Note that you can't completely avoid false breakouts, but you can minimize risk and loss. I have already published volume status as a separate script.
Several filters are provided to customize alerts. You can limit alerts based on the level and strength of broken trend lines, volume status, and type of breakout (Cross-Over, Cross-Under, or both).
The last breakouts panel gives an overview of the current market situation. You can activate it in the settings menu. the figure below shows the panel:
Settings menu parameters
{Chart Scale …} =>
Set it according to the chart. If you are using a linear chart, select the "Linear" option or if you are using a logarithmic chart, select the "Log" option
{Max Operational Range Length ...} =>
This parameter specifies the number of candles processed by the indicator (By default, the last 1000 bars)
{Filter Out-Of-Range Lines} =>
The filter removes diverging or out-of-range lines and reduces the clutter of the chart
{Visible Trend Lines ...} =>
In this section you can specify which level of trend lines should be visible. Level 1 contains the strongest lines and level 6 contains the weakest.
{Alert Condition 01 _ Trendline Levels} =>
In this section, you can specify which level of trend lines will trigger an alert after the breakout. This section has been added to customize alerts.
{Alert Condition 02 _ Cross Type} =>
In this section, you can limit alerts based on the type of breakout (Cross-Over, Cross-Under or both). This section has been added to customize alerts.
{Alert Condition 03 _ Volume Status} =>
In this section, you can limit alerts by volume to avoid fake breakouts. This section has been added to customize alerts.
{Last Breakout Label} =>
In this section, you can enable or disable the last breakout labels.
{Panel} =>
In this section, you can enable or disable the last breakout panel or set its position on the chart.
How to setup
There are many parameters in the settings menu, but two are more important. One is “Chart Scale” and the other is the “Max Operational Range Length".
Set the “chart scale” parameter according to the chart, otherwise the trend lines drawn by the indicator do not match the price chart.
If you are using a linear chart, select the "Linear" option or if you are using a logarithmic chart, select the "Log" option.
Max Operational Range Length Limits the range of the price chart that is processed by the indicator.
By increasing this parameter:
The strength and durability of the trend lines increases.
The number of breakout signals decreases.
The importance of breakout signals increases.
The indicator processing load increases.
In the following figure, you can see the effects of increasing the “Max Operational Range Length" parameter:
Limits
Since this indicator makes extensive use of trading volume, it is necessary to use a chart with volume information.
But if the volume information is not provided by the vendor, indicator will continue to work based on the price chart only, and a warning message will be displayed below the chart to let you know.
Errors and Performance
The performance of this indicator depends on the “Max Operational Range Length” parameter in the settings menu because it performs calculations, within a range with the length of this parameter.
By increasing this parameter, the processing load increases. Sometimes you may encounter the following error: “Loop takes too long to execute (>200 ms)”
If you see this error, do one of the following:
Reduce the “Max Operational Range Length”.
Reset the indicator. To do this, double-click on the “Hide” button in front of the indicator name.
Examples
EURUSD (FX:EURUSD) – 1D // Scale: Logarithmic, Max Range Length = 1000, Filter: 2X
NASDAQ 100 (CME_MINI:NQ1!) - 1D // Scale: Logarithmic, Max Range Length = 700
GOLD (COMEX:GC1!) – 1D // Scale: Logarithmic, Max Range Length = 650, Filter: 2X
NATURAL GAS (NYMEX:NG1!) – 1D // Scale: Logarithmic, Max Range Length = 625, Filter: 4X
AMAZON (NASDAQ:AMZN) – 1D // Scale: Logarithmic, Max Range Length = 1750, Filter: 2X
APPLE INC (NASDAQ:AAPL) – 1D // Scale: Logarithmic, Max Range Length = 340, Filter: 4X
GBPUSD (FX:GBPUSD) – 1D // Scale: Logarithmic, Max Range Length = 1000, Filter: 3X
SILVER (COMEX:SI1!) – 1D // Scale: Logarithmic, Max Range Length = 550, Filter: 3X
BITCOIN (KUCOIN:BTCUSDT) – 4H // Scale: Logarithmic, Max Range Length = 1250, Filter: 3X
MICROSOFT (NASDAQ:MSFT) – 1D // Scale: Logarithmic, Max Range Length = 340, Filter: 4X
TOTAL (CRYPTOCAP:TOTAL) – 2H // Scale: Logarithmic, Max Range Length = 1075, Filter: 3X
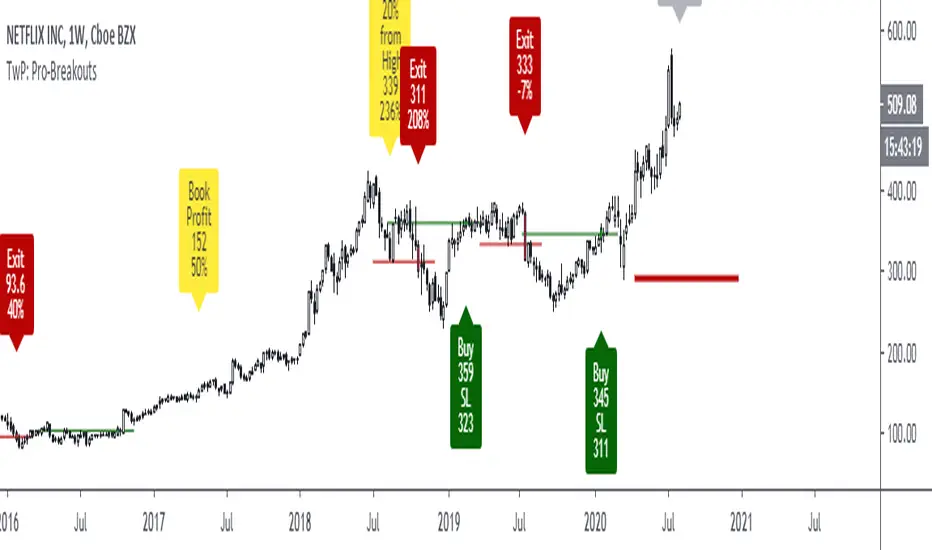
TradewithPuneet: Pro-BreakoutsThe Pro-Breakouts strategy is designed to get into a LONG position when a stock enters an Uptrend after a breakout. This strategy gives you:
• BUY signals : On a breakout, with strong probability of continuing up-moves.
• No SHORT signals are included in this strategy.
Through this strategy, we aim to ride a big chunk of the Uptrend till it reverses.
The strategy uses certain filters to avoid fake breakouts. Once those filter conditions are met, the stock waits for a breakout of key resistance level. Upon the breakout, the stock gives a BUY signal. Finally, when the stock breaks its key support level, it gives an EXIT signal.
The strategy guides you the price level at which to BUY and EXIT. You can also input your acceptable stop loss and profit booking levels, which are then displayed on the chart. The resistance and support lines (which result in trades) are drawn automatically on the chart.
The strategy is for medium to long-term traders . It works only on Daily timeframes and on closing prices. Hence, during the market hours, if a stock breaks out of its key-resistance level, you will see a BUY signal, but if it closes below it, the signal will disappear.
This strategy is only built for stocks, not for indices or any other financial instrument.
Breakout Signal (Trend+ATR+ADX+Score)Breakout Signal – Trend + ATR + ADX + Strength Score
This indicator detects high-quality bullish breakout conditions using a multi-filter confirmation system designed to reduce false signals and highlight only strong momentum events.
A breakout signal triggers when all core conditions align:
📌 Breakout Conditions
1. Price Breakout
Breakout occurs when the current high exceeds the previous close by X%.
This avoids noisy open-based signals and focuses on genuine upward expansion.
2. Volume Spike
Current volume must be higher than the average volume × multiplier.
This ensures the breakout is supported by real trading activity.
3. Trend Filter (MA)
Price must be trading above a moving average.
This prevents counter-trend breakouts and focuses on momentum continuation.
4. ATR Rising
ATR must be rising relative to its own moving average.
A rising ATR confirms volatility expansion — a key ingredient of valid breakouts.
5. ADX Trend Strength
ADX must exceed a user-defined threshold (default: 20).
This confirms the market is in a strong trend environment, reducing false signals.
⭐ Breakout Strength Score (0–5)
Each of the 5 filters contributes 1 point:
Trend OK
Volume Spike
ATR Rising
ADX Strong
Price Breakout
A score label appears on valid breakouts:
5/5 → Very strong breakout
4/5 → Strong breakout
3/5 → Moderate breakout
0–2 → Weak / avoided signals

HTF Cross Breakout [CHE] HTF Cross Breakout — Detects higher timeframe close crossovers for breakout signals, anchors VWAP for trend validation, and flags continuations or traps with visual extensions for delta percent and stop levels.
Summary
This indicator spots moments when the current chart's close price crosses a higher timeframe close, marking potential breakouts only when the current bar shows directional strength. It anchors a volume-weighted average price line from the breakout point to track trend health, updating labels to show if the move continues or reverses into a trap. Extensions add a dotted line linking the breakout level to the current close with percent change display, plus a stop-loss marker at the VWAP end. Signals gain robustness from higher timeframe confirmation and anti-repainting options, reducing noise in live bars compared to simple crossover tools.
Motivation: Why this design?
Traders often face false breakouts from intrabar wiggles on lower timeframes, especially without higher timeframe alignment, leading to whipsaws in volatile sessions. This design uses higher timeframe close as a stable reference for crossover detection, combined with anchored volume weighting to gauge sustained momentum. It addresses these by enforcing bar confirmation and directional filters, providing clearer entry validation and risk points without overcomplicating the chart.
What’s different vs. standard approaches?
Reference baseline
Standard crossover indicators like moving average crosses operate solely on the chart timeframe, ignoring higher timeframe context and lacking volume anchoring.
Architecture differences
- Higher timeframe data pulls via security calls with optional repainting control for stability.
- Anchored VWAP resets at each signal, accumulating from the breakout bar only.
- Label dynamics update in real-time for continuation checks, with extensions for visual delta and stop computation.
- Event-driven line finalization prunes old elements after a set bar extension.
Practical effect
Charts show persistent lines and labels that extend live but finalize cleanly on new events, avoiding clutter. This matters for spotting trap reversals early via label color shifts, and extensions provide quick risk visuals without manual calculations, improving decision speed in trend trades.
How it works (technical)
The indicator first determines a higher timeframe based on user selection, pulling its close price securely. It checks for crossovers or crossunders of the current close against this higher close, but only triggers on confirmed bars with matching directional opens and closes. On a valid event, a horizontal line and label mark the higher close level, while a dashed VWAP line starts accumulating typical price times volume from that bar onward. During the active phase, the breakout line extends to the current bar, the label repositions and updates text based on whether the current close holds above or below the level for bulls or bears. A background tint warns if the close deviates adversely from the current VWAP. Extensions draw a vertical dotted line at the last bar between the breakout level and close, placing a midpoint label with percent difference; separately, a label at the VWAP end shows a computed stop price. Persistent variables track the active state and accumulators, resetting on new events after briefly extending old elements. Repaint risk from security calls is mitigated by confirmed bar gating or user opt-in.
Parameter Guide
Plateau Length (reserved for future, currently unused): Sets a length for potential plateau detection in extensions; default 3, minimum 1. Higher values would increase stability but are not active yet—leave at default to avoid tuning.
Line Width: Controls thickness of breakout, VWAP, and extension lines; default 2, range 1 to 5. Thicker lines improve visibility on busy charts but may obscure price action—use 1 for clean views, 3 or more for emphasis.
+Bars after next HTF event (finalize old, then delete): Extends old lines and labels by this many bars before deletion on new signals; default 20, minimum 0. Shorter extensions keep charts tidy but risk cutting visuals prematurely; longer aids review but builds clutter over time.
Evaluate label only on HTF close (prevents gray traps intrabar): When true, label updates wait for higher timeframe confirmation; default true. Enabling reduces intrabar flips for stabler signals, though it may delay feedback—disable for faster live trading at repaint cost.
Allow Repainting: Permits real-time security data without confirmation offset; default false. False ensures historical accuracy but lags live bars; true speeds updates but can repaint on HTF closes.
Timeframe Type: Chooses HTF method—Auto Timeframe (dynamic steps up), Multiplier (chart multiple), or Manual (fixed string); default Auto Timeframe. Auto adapts to chart scale for convenience; Multiplier suits custom scaling like 5 times current; Manual for precise like 1D on any chart.
Multiplier for Alternate Resolution: Scales chart timeframe when Multiplier type selected; default 5, minimum 1. Values near 1 mimic current resolution for subtle shifts; higher like 10 jumps to broader context, increasing signal rarity.
Manual Resolution: Direct timeframe string like 60 for 1H when Manual type; default 60. Match to trading horizon—shorter for swing, longer for positional—to balance frequency and reliability.
Show Extension 1: Toggles dotted line and delta percent label between breakout level and current close; default true. Disable to simplify for basic use, enable for precise momentum tracking.
Dotted Line Width: Thickness for Extension 1 line; default 2, range 1 to 5. Align with main Line Width for consistency.
Text Size: Size for delta percent label; options tiny, small, normal, large; default normal. Smaller reduces overlap on dense charts; larger aids glance reads.
Decimals for Δ%: Precision in percent change display; default 2, range 0 to 6. Fewer decimals speed reading; more suit low-volatility assets.
Positive Δ Color: Hue for upward percent changes; default lime. Choose contrasting for visibility.
Negative Δ Color: Hue for downward percent changes; default red. Pair with positive for quick polarity scan.
Dotted Line Color: Color for Extension 1 line; default gray. Neutral tones blend well; brighter for emphasis.
Background Transparency (0..100): Opacity for delta label background; default 90. Higher values fade for subtlety; lower solidifies for readability.
Show Extension 2: Toggles stop-loss label at VWAP end; default true. Turn off for entry focus only.
Stop Method: Percent from VWAP end or fixed ticks; options Percent, Ticks; default Percent. Percent scales with price levels; Ticks suits tick-based instruments.
Stop %: Distance as fraction of VWAP for Percent method; default 1.0, step 0.05, minimum 0.0. Tighter like 0.5 reduces risk but increases stops; wider like 2.0 allows breathing room.
Stop Ticks: Tick count offset for Ticks method; default 20, minimum 0. Adjust per asset volatility—fewer for tight control.
Price Decimals: Rounding for stop price text; default 4, range 0 to 10. Match syminfo.precision for clean display.
Text Size: Size for stop label; options tiny, small, normal, large; default normal. Scale to chart zoom.
Text Color: Foreground for stop text; default white. Ensure contrast with background.
Inherit VWAP Color (BG tint): Bases stop label background on VWAP hue; default true. True maintains theme; false allows custom black base.
BG Transparency (0..100): Opacity for stop label background; default 0. Zero for no tint; up to 100 for full fade.
Reading & Interpretation
Breakout lines appear green for bullish crosses or red for bearish, extending live until a new event finalizes them briefly then deletes. Labels start blank, updating to Bull Cont. or Bear Cont. in matching colors if holding the level, or gray Bull Trap/Bear Trap on reversal. VWAP dashes yellow for bulls, orange for bears, sloping with accumulated volume weight—deviations trigger faint red background warnings. Extension 1's dotted vertical shows at the last bar, with midpoint label green/red for positive/negative percent from breakout to close. Extension 2 places a left-aligned label at VWAP end with stop price and method note, tinted to VWAP for context.
Practical Workflows & Combinations
For trend following, enter long on green Bull Cont. labels above VWAP with higher highs confirmation, filtering via rising structure; short on red Bear Cont. below. Pair with volume surges or RSI above 50 for bulls to avoid traps. For exits, trail stops using the Extension 2 level, tightening on warnings or gray labels—aggressive on continuations, conservative post-trap. In multi-timeframe setups, use default Auto on 15m charts for 1H signals, scaling multiplier to 4 for daily context on hourly; test on forex/stocks where volume is reliable, avoiding low-liquidity assets.
Behavior, Constraints & Performance
Signals confirm on bar close with HTF gating when strict mode active, but live bars may update if repainting enabled—opt false for backtest fidelity, true for intraday speed. Security calls risk minor repaints on HTF closes, mitigated by confirmation offsets. Resources cap at 1000 bars back, 50 lines/labels total, with event prunes to stay under budgets—no loops, minimal arrays. Limits include VWAP lag in low-volume periods and dependency on accurate HTF data; gaps or holidays may skew anchors.
Sensible Defaults & Quick Tuning
Defaults suit 5m-1H charts on liquid assets: Auto HTF, no repaint, 1% stops. For choppy markets with excess signals, enable strict eval and bump multiplier to 10 for rarer triggers. If sluggish in trends, shorten extend bars to 10 and allow repainting for quicker visuals. On high-vol like crypto, widen stop % to 2.0 and use Ticks method; for stables like indices, tighten to 0.5% and keep Percent.
What this indicator is—and isn’t
This is a signal visualization layer for breakout confirmation and basic risk marking, best as a filter in discretionary setups. It isn’t a standalone system or predictive oracle—combine with price structure, news awareness, and sizing rules for real edges.
Disclaimer
The content provided, including all code and materials, is strictly for educational and informational purposes only. It is not intended as, and should not be interpreted as, financial advice, a recommendation to buy or sell any financial instrument, or an offer of any financial product or service. All strategies, tools, and examples discussed are provided for illustrative purposes to demonstrate coding techniques and the functionality of Pine Script within a trading context.
Any results from strategies or tools provided are hypothetical, and past performance is not indicative of future results. Trading and investing involve high risk, including the potential loss of principal, and may not be suitable for all individuals. Before making any trading decisions, please consult with a qualified financial professional to understand the risks involved.
By using this script, you acknowledge and agree that any trading decisions are made solely at your discretion and risk.
Do not use this indicator on Heikin-Ashi, Renko, Kagi, Point-and-Figure, or Range charts, as these chart types can produce unrealistic results for signal markers and alerts.
Best regards and happy trading
Chervolino

D-Shape Breakout Signals [LuxAlgo]The D-Shape Breakout Signals indicator uses a unique and novel technique to provide support/resistance curves, a trailing stop loss line, and visual breakout signals from semi-circular shapes.
🔶 USAGE
D-shape is a new concept where the distance between two Swing points is used to create a semi-circle/arc, where the width is expressed as a user-defined percentage of the radius. The resulting arc can be used as a potential support/resistance as well as a source of breakouts.
Users can adjust this percentage (width of the D-shape) in the settings ( "D-Width" ), which will influence breakouts and the Stop-Loss line.
🔹 Breakouts of D-Shape
The arc of this D-shape is used for detecting breakout signals between the price and the curve. Only one breakout per D-shape can occur.
A breakout is highlighted with a colored dot, signifying its location, with a green dot being used when the top part of the arc is exceeded, and red when the bottom part of the arc is surpassed.
When the price reaches the right side of the arc without breaking the arc top/bottom, a blue-colored dot is highlighted, signaling a "Neutral Breakout".
🔹 Trailing Stop-Loss Line
The script includes a Trailing Stop-Loss line (TSL), which is only updated when a breakout of the D-Shape occurs. The TSL will return the midline of the D-Shape subject to a breakout.
The TSL can be used as a stop-loss or entry-level but can also act as a potential support/resistance level or trend visualization.
🔶 DETAILS
A D-shape will initially be colored green when a Swing Low is followed by a Swing High, and red when a Swing Low is followed by a Swing High.
A breakout of the upper side of the D-shape will always update the color to green or to red when the breakout occurs in the lower part. A Neutral Breakout will result in a blue-colored D-shape. The transparency is lowered in the event of a breakout.
In the event of a D-shape breakout, the shape will be removed when the total number of visible D-Shapes exceeds the user set "Minimum Patterns" setting. Any D-shape whose boundaries have not been exceeded (and therefore still active) will remain visible.
🔹 Trailing Stop-Loss Line
Only when a breakout occurs will the midline of the D-shape closest to the closing price potentially become the new Trailing Stop value.
The script will only consider middle lines below the closing price on an upward breakout or middle lines above the closing price when it concerns a downward breakout.
In an uptrend, with an already available green TSL, the potential new Stop-Loss value must be higher than the previous TSL value; while in a downtrend, the new TSL value must be lower.
The Stop-Loss line won't be updated when a "Neutral Breakout" occurs.
🔶 SETTINGS
Swing Length: Period used for the swing detection, with higher values returning longer-term Swing Levels.
🔹 D-Patterns
Minimum Patterns: Minimum amount of visible D-Shape patterns.
D-Width: Width of the D-Shape as a percentage of the distance between both Swing Points.
Included Swings: Include "Swing High" (followed by a Swing Low), "Swing Low" (followed by a Swing High), or "Both"
Style Historical Patterns: Show the "Arc", "Midline" or "Both" of historical patterns.
🔹 Style
Label Size/Colors
Connecting Swing Level: Shows a line connecting the first Swing Point.
Color Fill: colorfill of Trailing Stop-Loss

Breakout Support & Resistance SwiftEdgeBreakout Support & Resistance
The Breakout is a technical analysis tool designed to identify breakout opportunities in the market by detecting price movements through support and resistance levels. It plots potential entry points, stop-loss (SL), and take-profit (TP) levels based on user-defined percentages, helping traders visualize breakout setups on their charts.
How It Works
Support and Resistance Detection: The indicator uses pivot points to identify support and resistance levels over a user-defined lookback period.
Breakout Identification: A breakout is confirmed when the price crosses above a resistance level (bullish) or below a support level (bearish) and remains there for a specified number of bars.
Entry, SL, and TP Levels: Upon a confirmed breakout, the indicator sets an entry point at the closing price and calculates SL, TP1, and TP2 levels based on user-defined percentages.
Directional Filtering: To avoid conflicting signals, the indicator filters breakouts based on the current trade direction. A new entry in the opposite direction is only set if the price moves a user-defined percentage away from the previous entry or if the previous trade hits its SL, TP1, or TP2.
Visuals: The indicator plots support and resistance lines, breakout labels, and entry/SL/TP levels on the chart. Users can choose to display only the latest entry or up to 5 recent entries.
Features
Customizable Settings: Adjust the lookback period for pivot points, breakout confirmation bars, SL/TP percentages, and more.
Directional Change Control: A direction change is indicated when the price moves significantly in the opposite direction, helping to manage trend reversals.
Multiple Entry Display: Option to show up to 5 recent entries for tracking multiple breakouts.
Alerts: Receive alerts when a breakout is confirmed, including entry, SL, TP1, and TP2 levels.
Settings
Pivot Lookback Length: Number of bars to look back for identifying support and resistance levels (default: 5).
Breakout Confirmation Bars: Number of bars the price must stay above/below the level to confirm a breakout (default: 2).
Take Profit 1 (%): First take-profit level as a percentage above/below the entry (default: 2.0%).
Take Profit 2 (%): Second take-profit level as a percentage above/below the entry (default: 4.0%).
Stop Loss (%): Stop-loss level as a percentage below/above the entry (default: 1.0%).
Show Multiple Entries: Toggle to display up to 5 recent entries or only the latest (default: false).
Direction Change Threshold (%): Percentage the price must move away from the entry to allow a direction change (default: 2.0%).
How to Use
Add the Breakout Scanner to your chart.
Adjust the settings to match your trading style (e.g., tweak the pivot lookback or SL/TP percentages).
Watch for breakout labels ("Breakout") on the chart, indicating a confirmed breakout.
Use the plotted entry, SL, TP1, and TP2 levels to plan your trades.
Enable alerts to be notified of new breakouts in real-time.
Notes
This indicator is designed to assist with identifying breakout opportunities and does not guarantee specific results. Always combine it with other analysis and risk management techniques.
The direction change feature helps filter breakouts in the opposite direction, but significant price movements may still trigger a new entry in the opposite direction.
For best results, test the indicator on a demo account to understand its behavior in your preferred market and timeframe.

Smart Money Breakout Signals [AlgoAlpha]Introducing the Smart Money Breakout Signals, a cutting-edge trading indicator designed to identify key structural shifts and breakout opportunities in the market. This tool leverages a blend of smart money concepts like Break of Structure (BOS) and Change of Character (CHoCH) to provide traders with actionable insights into market direction and potential entry or exit points.
Key Features :
✨ Market Structure Analysis : Automatically detects and labels BOS and CHoCH for trend confirmation and reversals.
🎨 Customizable Visualization : Tailor bullish and bearish colors for breakout lines and signals to suit your preferences.
📊 Dynamic Take-Profit Targets : Displays three tiered take-profit levels based on breakout volatility.
🔔 Real-Time Alerts : Stay ahead of the game with notifications for bullish and bearish breakouts.
📋 Performance Dashboard : Monitor signal statistics, including win rates and total signals, directly on your chart.
How to Use :
Add the Indicator : Add the script to your favourites ⭐ and customize settings like market structure horizon and confirmation type.
Monitor Breakouts : Observe BOS and CHoCH labels to identify potential trend shifts. Use the breakout lines and tiered take-profit levels to plan trades effectively.
Set Alerts : Enable alerts for bullish or bearish breakouts to act on opportunities without constant monitoring.
How It Works :
The indicator identifies market structure by analyzing pivot highs and lows over a user-defined time horizon. A breakout is confirmed based on either candle closes or wicks surpassing previous pivot points. Upon detection, the script generates signals with breakout lines and calculates take-profit targets based on the distance from the breakout level. A built-in dashboard tracks performance metrics like total signals and win rates, giving traders real-time feedback on strategy effectiveness.

Reversal and Breakout Signals [AlgoAlpha]🚀🌟 Introducing the Reversal and Breakout Signals by AlgoAlpha 🌟🚀
This innovative tool is crafted to enhance your chart analysis by identifying potential reversal and breakout opportunities directly on your charts. It's designed with both novice and experienced traders in mind, providing intuitive visual cues for better decision-making. Let's dive into the key features and how it operates:
### Key Features:
🔶 Dynamic Period Settings: Customize the sensitivity of the indicator with user-defined periods for both the indicator and volume strength.
📊 Volume Threshold: Set a threshold to define what constitutes strong volume, enabling the identification of significant market movements.
💡 Trend Coloring: Option to color candles during trends, making it easier to visualize bullish and bearish market conditions.
🌈 Customizable Visuals: Choose your preferred colors for bullish, bearish, and breakout signals, personalizing the chart to your liking.
🚨 Advanced Alert System: Configure alerts for reversal and breakout signals, ensuring you never miss a potential trading opportunity.
### How to Use:
To maximize the effectiveness of the Reversal and Breakout Signals tool, follow these steps:
1. 🔧 Set Up Your Preferences:
- Adjust the Indicator Period and Volume Strength Period to match the timeframe of your trading strategy. This fine-tuning allows the indicator to better align with your specific market analysis needs.
- Define the Strong Volume Threshold to distinguish between ordinary and significant volume movements. This helps in identifying breakout or reversal signals with higher confidence.
2. 🎨 Customize Visuals:
- Choose colors for Bullish , Bearish , and Breakout Signals to visually differentiate between different types of market activities. This customization facilitates quicker decision-making while scanning charts.
3. 🔍 Reversal Signals:
- Bullish Reversal : Look for a triangle below the bar indicating a potential upward movement. It's identified when the price dips below the lower level but closes above it, suggesting a rejection of lower prices.
- Bearish Reversal : A triangle above the bar signals a potential downward movement. This occurs when the price spikes above the upper level but closes below, indicating a rejection of higher prices.
4. 📈 Trend and Breakout Signals:
- Diamonds represent breakout signals. A bullish breakout is marked below the bar when the price closes above the upper level, suggesting strong buying pressure. Conversely, a bearish breakout above the bar indicates strong selling pressure as the price closes below the lower level.
- The tool also features a Trend Tracker that highlights the current market trend using the Hull Moving Average (HMA). This can help you stay aligned with the overall market direction for your trades.
By integrating these steps into your trading strategy, the Reversal and Breakout Signals tool can provide actionable insights to help identify potential entry and exit points, enhancing your trading decisions with visual cues and alerts for market reversals and breakouts.
### How It Works:
The core logic revolves around calculating weighted moving averages of high and low prices over a user-defined period, identifying the highest and lowest points within this period to establish potential breakout or breakdown levels while reducing the amount of noise, hence the use of moving averages.
1. Weighted Moving Averages Calculation:
sh = ta.wma(high, len)
sl = ta.wma(low, len)
h = ta.highest(sh, len)
l = ta.lowest(sl, len)
2. Breakout and Reversal Detection:
The script then employs logic to detect bullish and bearish breakouts and reversals based on the closing price's position relative to these levels, combined with volume analysis to confirm the strength of the move.
if not (h < h or h > h )
hstore := h
if not (l < l or l > l )
lstore := l
bullishbreakout := (breakout or ((breakout or breakout or breakout or breakout ) and candledir == 1)) and strongvol and not (bullishbreakout or bullishbreakout or bullishbreakout )
bearishbreakout := (breakdown or ((breakdown or breakdown or breakdown or breakdown ) and candledir == -1)) and strongvol and not (bearishbreakout or bearishbreakout or bearishbreakout )
3. Visual Indicators and Alerts:
Visual cues such as triangle shapes for reversals and diamonds for breakouts, along with colored bars, make it easy to spot these opportunities. Additionally, alerts can be set up for these events, ensuring traders can react promptly to potential trading setups.
plotshape(bullishrej and not (state ==- 1) ? low * 0.9995 : na, " Bullish Reversal ", shape.triangleup, location.belowbar, color.new(green, 0), size = size.tiny, text = "𝓡", textcolor = color.gray)
plotshape(bearishrej and not (state == 1) ? high * 1.0005 : na, " Bearish Reversal ", shape.triangledown, location.abovebar, color.new(red, 0), size = size.tiny, text = "𝓡", textcolor = color.gray)
plotshape(bullishbreakout ? low * 0.999 : na, " Bullish Breakout ", shape.diamond, location.belowbar, color.new(yellow, 0), size = size.tiny, text = "𝓑", textcolor = color.gray)
plotshape(bearishbreakout ? high * 1.001 : na, " Bearish Breakout ", shape.diamond, location.abovebar, color.new(yellow, 0), size = size.tiny, text = "𝓑", textcolor = color.gray)
This script is a versatile tool designed to aid in the identification of key reversal and breakout points, helping traders to make informed decisions based on technical analysis. Its customization options allow for a tailored analysis experience, fitting the unique needs and strategies of each trader.

[Pivots Consolidation Breakout Screener] with Alerts (TSO) This is a pivots consolidation screener indicator, with ability to choose up to 12 different symbols/instruments with alert to be notified when consolidation happens on either one with the new pivots formation (new R3(inner resistance) pivot formed below previous one and new S3(inner support) pivot formed above previous one). Once the alert on a certain symbol/instrument is received - there is an ability to set a Breakout alert for the consolidated symbol/instrument.
This is a very powerful strategy, which doesn't happen often, but when happens - it often causes big moves after a breakout!
NOTE: Every calculation is done on a confirmed closed candle bar state, so the indicator will never repaint!
===========================================================================
Explanation of all the Features/Inputs/Settings
---------------------------------------------------------------------------
>>> On the very top, please read the important NOTES/TIPs.
>>> Next section is where the desired symbols can be turned on/checked to be screened for consolidation - the selected/checked symbols at creation of a 'Any alert() function call' alert will alert on any of the selected/checked symbols. Also, once consolidation forms, until next pivots formation - it will show it on the "Consolidation Stats" table. Once alerted on a specific symbol for consolidation - manual alert - 'Consolidation BREAKOUT' - can be created (MUST be done on the actual symbol chart, Right-Click > Add Alert) to be notified when actual breakout takes place.
>>> Pivots Settings section is where a manual timeframe/length can be set for the pivots as by Default it uses "Daily" timeframe. So, if want to experiment with more signals, but less accurate - a smaller timeframe can be set for Pivots Timeframe with smaller chart timeframe.
>>> Final section is simply the "Consolidation Stats" table location.
===========================================================================
Adding Alerts in TradngView
---------------------------------------------------------------------------
1) Consolidation alert(s) for the selected/checked symbols
- Select/check/find the desired symbols/instruments (when selecting symbols, make sure - they are from correct BROKER/SOURCE as pricing may differ between different brokers, causing confusion (under 1 broker/source, the symbol will be consolidated, under another it will not...))
-Right-click anywhere on any TradingView chart
-Click on Add alert
-Condition: Select this indicator by it’s name
-Immediately below, change it to "alert() function calls only"
-Expiration: Open-ended (that may require higher tier TradingView account, otherwise the alert will need to be occasionally re-triggered)
-Alert name: Whatever you desire
-Hit “Create”
-Note: If you change ANY Settings within the indicator – you must DELETE the current alert and create a new one per steps above, otherwise it will continue triggering alerts per old Settings!
* Once alert triggers, don't get confused, as it will show "Alert on SYMBOL", the SYMBOL will be where you created the major alert for all the symbols within the screener list! Within the alert, on the bottom, it will say: "EURUSD: Camarilla Pivots R3S3 Consolidation ALERT!" - this is where the correct symbol is for which the alert for consolidation was triggered!
---------------------------------------------------------------------------
2) Consolidation BREAKOUT alert(s)
-Right-click anywhere on any TradingView chart
-For the actual symbol (which got consolidated), open the chart (make sure timeframe is the same as with which "Consolidation alert(s)" were created prior), then Right-Click on the chart > Add Alert
-Click on Add alert
-Condition: Select this indicator by it’s name
-Immediately below, change it to "Consolidation BREAKOUT1"
-Expiration: Open-ended (that may require higher tier TradingView account, otherwise the alert will need to be occasionally re-triggered)
-Alert name: Whatever you desire
-Hit “Create”
* It will alert when a breakout occurs in any direction - once you open the chart for the symbol/instrument for which alert has occurred - you can immediately see into which direction the breakout occured, it will be marked on the chart with green/red triangle.
===========================================================================
If you have any questions or issues with the indicator, please message me directly via TradingView.
---------------------------------------------------------------------------
Good Luck! (NOTE: Trading is very risky, past performance is not necessarily indicative of future results, so please trade responsibly!)

Banded Chikou Breakout — Quantifying Ichimoku MomentumTitle: Banded Chikou Breakout — Quantifying Ichimoku Momentum
Overview:
Banded Chikou Breakout (BCB) is a unique, algorithmic script designed to augment the capabilities of traders seeking substantial breakout opportunities. Constructed on the robust principles of the Ichimoku trading strategy, BCB is designed to quantify and filter the Chikou Span's significant breakouts above or below the price action. This script does not aim to replace the Ichimoku system; instead, it enhances it, providing an optimized tool for momentum trading.
Rationale:
Ichimoku traders often scrutinize the Chikou Span's position relative to price action to identify market trends. However, determining whether the Chikou Span is above or below due to a genuine trend or mere market noise can be challenging in choppy markets. BCB resolves this predicament by offering a unique way to interpret the Chikou Span's movement. It does so by quantifying the Chikou Span's momentum and utilizing Bollinger Bands to determine its significance. By effectively differentiating substantial movements from the insignificant, BCB can help traders better navigate the market and increase their potential for profitable trades.
How it Works:
BCB combines three key elements: a Momentum Script (simulating Chikou Span), a Bollinger Band Script, and a Timeframe Switcher, all working together to provide a refined trading perspective.
Momentum Script: Calculates the price difference between the current price and the price 'n' periods ago, transforming the Chikou Span into a quantifiable momentum value that signifies the strength and speed of a market move.
Bollinger Band Script: Computes a Simple Moving Average (SMA) around the momentum, plotting two 'bands' at a specified standard deviation from this SMA. This functionality allows traders to discern when the Chikou Span's momentum is abnormally high or low, signifying a potential significant breakout.
Timeframe Switcher: This feature lets traders apply the BCB script to a different timeframe from the one they are currently viewing. This capability can help traders identify higher timeframe breakouts and trade them with precision on the lower timeframe.
How to Use:
BCB is designed to complement the Ichimoku strategy for effective breakout identification.
Add the BCB script to your trading chart. It plots the momentum (yellow line) and Bollinger Bands (green lines) with the area between the bands shaded blue.
Utilize the Ichimoku strategy to identify larger and smaller timeframe trends.
Optional: Leverage the timeframe switcher to synchronize your trades with higher timeframe trends while operating on lower timeframes.
If the BCB momentum line crosses the upper Bollinger Band while the Ichimoku indicates a bullish trend, it signifies a potential significant upward breakout. Similarly, a cross below the lower band during a bearish trend could denote a significant downward breakout.
Remember, without the context provided by the Ichimoku system's trend analysis, BCB can yield false breakouts. It is, therefore, crucial to use these tools in tandem. I like to check for an Ichimoku trend on the 4H and 1H charts, and then use BCB on charts <60 minutes to capture trends with precision.
