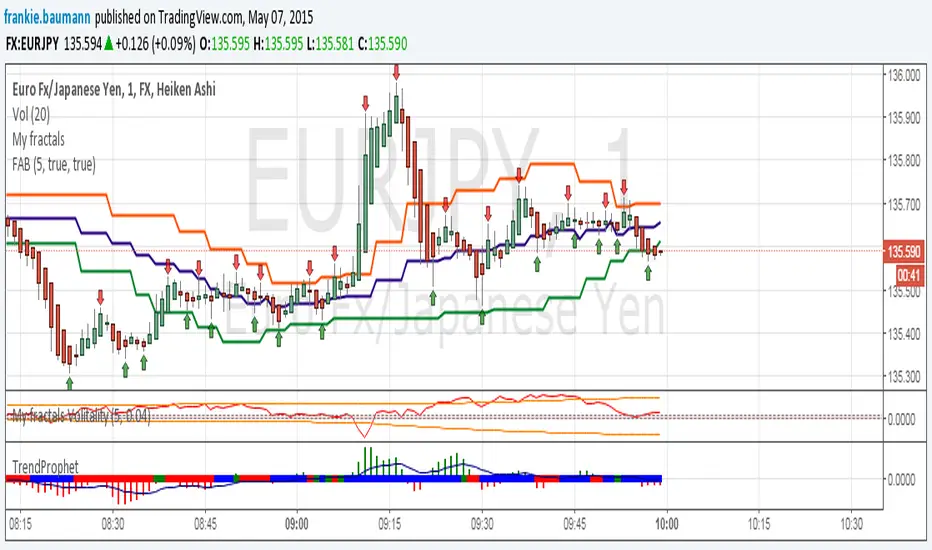
Fractals average breakout [FB]My first indicator. A simple average of last 1 to 10 fractals (top and bottom) Trade breakouts of top or bottom lines. Feel free to use and experiment with. Frank Baumannאינדיקטור Pine Script®מאת frankie.baumann2020 1.8 K
XAUUSD Breakout Retest Sniper StrategyThis strategy is designed to demonstrate a structured breakout + retest approach using trend confirmation and volatility-based risk management. It is built for educational and research purposes to help traders understand how breakout continuation moves can be analyzed systematically. The logic focuses on identifying key breakout zones from recent highs and lows, then waiting for price confirmation in the direction of the prevailing trend before simulating entries. Core Logic Behind the Strategy Uses a trend filter (EMA) to define directional bias Identifies recent resistance and support using lookback highs/lows Waits for breakout confirmation and retest behavior Applies ATR-based stop loss and risk-to-reward target projection Designed for intraday charts such as 5M–15M (can be adjusted) The strategy aims to model how price often moves from one liquidity zone to another after breaking key levels. It avoids trading in consolidation and focuses only on confirmed directional moves. How It Works • Bullish conditions when price is above trend EMA • Bearish conditions when price is below trend EMA • Breakout of recent structure signals potential continuation • ATR used to simulate dynamic SL and TP levels • Built-in backtesting for study and optimization Important Notes This script is a technical model for chart study and strategy development. It does not guarantee performance and should not be used as financial advice or a signal service. Users are encouraged to test, modify, and adapt it according to their own trading plans and risk management rules. Best Use Learning breakout + retest behavior Backtesting structured entry models Studying trend-based continuation setups Developing personal trading systems Disclaimer This publication is for educational and informational purposes only. Trading involves risk, and past performance does not guarantee future results. Always perform your own analysis before making trading decisions. xauusd, gold, strategy, breakout, price action, algorithmic trading, trend tradingאסטרטגיית Pine Script®מאת JaxonJackFX186
Apex Wallet - Opening Range Breakout (ORB) & Session LevelsOverview The Apex Wallet Opening Range Breakout (ORB) is a professional intraday tool designed to capture the volatility of the first minutes of the trading session. By defining a clear range at the market open, this indicator provides traders with high-probability breakout levels and psychological targets based on mathematical extensions of the initial move. Core Mechanics Customizable Session: Easily define your preferred opening range duration (e.g., first 5, 15, or 30 minutes) and session start time. Dynamic Timezone Adjustment: Includes a built-in UTC offset feature to ensure session times align perfectly with your local market, regardless of where you are trading from. Automated Level Tracking: The script automatically identifies and locks the high and low of the specified opening period. Key Features: Psychological Mid-Lines: Calculates the 50% median of the range (ORB Mid) as a pivot point for trend strength. Advanced Volatility Extensions: Plots internal and external targets (High+Mid, Low+Mid) to identify potential exhaustion zones or secondary breakout levels. Intraday Optimization: Designed specifically for low-timeframe traders (1m to 15m) looking for clear execution zones at the bell. How to use: Wait for the opening range to be established. A breakout above the ORB High often indicates bullish dominance, while a break below the ORB Low suggests bearish momentum. Use the internal extension lines as take-profit targets or areas to move your stop-loss to breakeven.אינדיקטור Pine Script®מאת Apex-Wallet25
DAX 9-10 Breakout Strategy IndicatorOpening Hour Breakout (ORB) indicator for intraday trading. WHAT IT DOES: • Identifies the price range of a specific hour (default: 9:00-10:00) • Detects breakout direction (Long/Short) when price breaks above HIGH or below LOW • Automatically calculates Take Profit and Stop Loss zones based on range size • Tracks trade outcome (Win/Lose) when TP or SL is hit HOW TO USE: 1. Set the session hour according to your chart's timezone 2. Wait for the session range to form (yellow box) 3. Enter on breakout above HIGH (Long) or below LOW (Short) 4. TP and SL levels are automatically calculated DEFAULT SETTINGS: • TP Multiplier: 1.41x range (Risk:Reward ≈ 1:2.7) • SL Multiplier: 0.52x range FEATURES: • Works on any timeframe (H1, M15, M30, etc.) • Visual zones for session range, TP, and SL • Price labels for all key levels • Entry arrows and direction letters (L/S) • Win/Lose markers (W/X) when trade closes • Fully customizable - show/hide any element • Info panel with live status and R:R ratio • Alert conditions for Entry, TP hit, SL hit BEST USED ON: • DAX (Germany 40) • Other indices: US30, US500, NAS100 • Forex majors during London/NY open NOTE: This is an indicator for visual analysis. Use the Strategy version for backtesting. אינדיקטור Pine Script®מאת HubertLorenz92
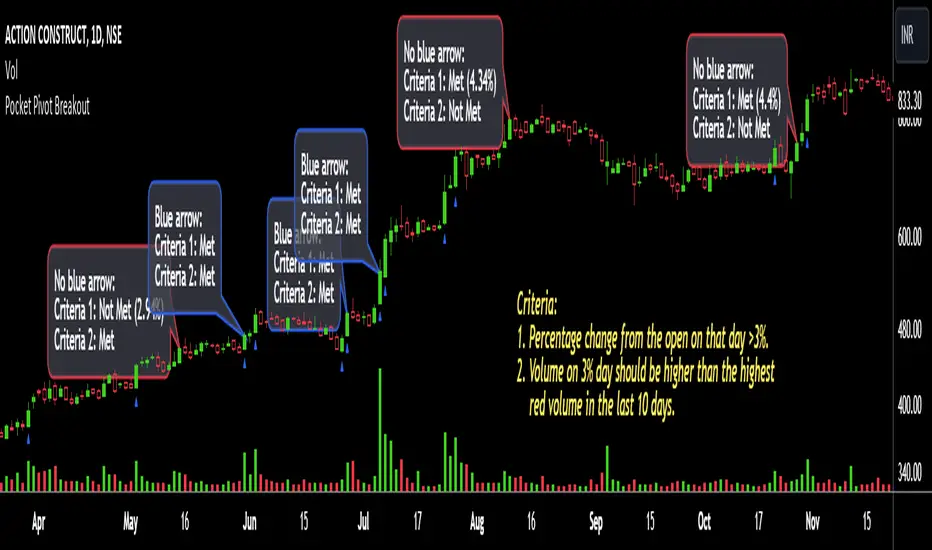
Pocket Pivot BreakoutPocket Pivot Breakout Indicator The pocket pivot breakout indicator will show a blue arrow under the candle if both the following conditions are met: 1. The percentage change of the candle on that day from open is greater than 3%. 2. The volume on the day of 3% candle is higher than the highest red volume in the past 10 days. The second condition is based on the 'Pocket Pivot' concept developed by Gil Morales and Chris Kacher. If only one of the conditions is met, while the other is not, there will be no arrow. How to use the Pocket Pivot Breakout indicator? 1. If the stock is breaking out of a proper base like (cup & handle, Darvas box etc.), you can use the blue arrow as an indicator to make your initial buy. 2. If you already own a stock, the blue arrow indicator can be used for pyramiding, following a continuation breakout from a proper base. 3. Avoid making a new entry or continuation entry if the stock is too extended from 10ma. Gap-up > 0.5% Indicator Gap-up Indicator displays a blue colored candle when a stock gaps up by more than 0.5% compared to previous day's close. It is turned off by default. To activate it, check the box next to Gap-up > 0.5% in the indicator options. How to use the Gap-up Indicator? 1. When a stock gaps up, it usually indicates strength, especially if on the day of the gap-up, the stock closes strongly. 2. This indicator should not be used in isolation but with a proper base breakout from a tight consolidation. 3. If a stock is already extended from 10ma, avoid taking any new or continuation entries. Precautions 1. Avoid buying longs when the general market conditions are not favorable. 2. Avoid buying stocks below 200ma. 3. Avoid making a new entry or pyramid entry if a stock is too extended from 10ma. Important Points 1. Always choose fundamentally strong stocks showing strong growth in earnings/margins/sales. 2. Buy these fundamentally strong stocks when they are breaking out of proper bases. 3. To learn more about pocket pivots and buyable gap-ups, read the book, Trade Like an O'Neil Disciple (by Gil Morales & Chris Kacher). Cheers Simranjitאינדיקטור Pine Script®מאת simatricksמעודכן 2828 1.6 K
JZ_Chaikin HTF Volatility BreakoutFirst off, all credit to Harry Potter as this is a minor customization of his indicator. Basic additions: -- Added a Higher Timeframe that is set to Daily but can be changed. Timeframe does wait until barstate.isconfirmed so won't repaint. -- Added HMA smoothing line to both Chart and HTF. Can be used as it's own signal, as confirmation or in combination with faster signal line -- Breakout signal & Range Highlight use both. -- Added optional coloring of HMA based on whether increasing or decreasing. -- Added a low volatility option that highlights Range/No Trade zones. Defval is off so needs to be selected from inputs. Breakout Signals are very simple and both take the HTF signal and HMA. When the faster Volatility line rises from below zero and comes within the range of -10 to 0, AND the HMA signals is increasing (and also below zero) for confirmation, generates a breakout signal of an incoming big move. You can alter the breakout threshold to be greater or less than -10, I just found that works best for filtering out the noise and false signals. Won't catch everything, but pretty reliable when it does. Tested mostly on BTC so can't vouch for other assets and would likely need modification. I've JUST taught myself coding from scratch (and to say I'm an amateur is an understatement), so apologies in advance if anything is unclear or could be coded better. Open to any suggestions.אינדיקטור Pine Script®מאת JazzByrdמעודכן 69
[Pt] Premarket Breakout StrategyThis is a 1 trade per day strategy for trading SPY or QQQ index. By default, this is designed for 1 min time frame. This was an experimental script that seems to be profitable at the time of publication. How it works: Pre-market high and low is defined per trading day between 9:00 to 9:30 EST. Then we looking for the first breakout on either PM high or PM low. - Breakout high = long trade - Breakout low = short trade If long trade, we wait until Stochastic RSI D signal line to hit a lower threshold (18 by default). Then we enter long when K crosses above D line. If short trade, we wait until Stochastic RSI D signal line to hit an upper threshold (82 by default). Then we enter short when K crosses below D line. Stop loss for long - set to PM low if entry is above PM high + %ATR buffer - or set to PM range + %ATR buffer Stop loss for short - set to PM high if entry is below PM low + %ATR buffer - or set to PM range + %ATR buffer Profit target is set to 2x the risk by default. *Note: Different Stochastic RSI lengths should be used if trading 5 min time frame. See tooltip. Happy trading~~!אסטרטגיית Pine Script®מאת PtGambler1515789
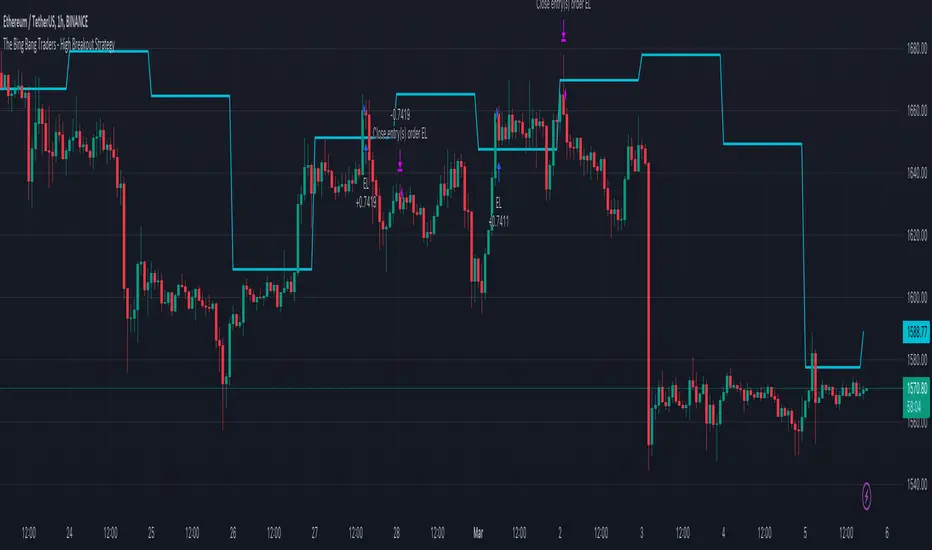
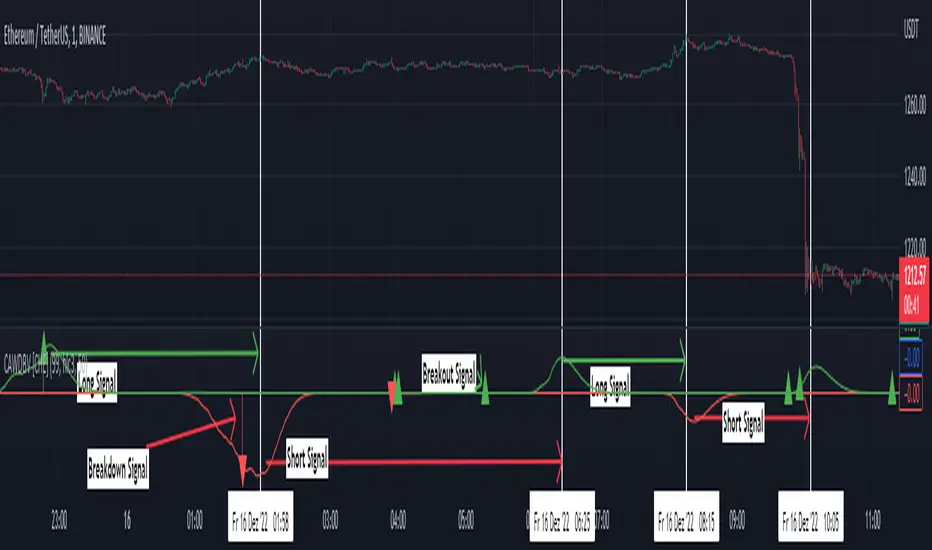
TheBigBangTraders BreakoutName: TheBigBangTraders Breakout Category: Trend Follower Operating mode: Spot Trades duration: Intraday Timeframe: 1H Suggested usage: the purpose of this strategy is to help to investigate if the asset is sensitive to breakout approach. Entry: Trigger point can be choose by the user between: High of the N days ago High of the N weeks ago Exit: End of Day Usage: ⁃ It can be useful to use this script to test the behaviour of a definite asset ⁃ This is a raw system that can be considered a base to realize a complete breakout strategy Configuration: - N/A Backtesting ⁃ Exchange: BINANCE ⁃ Pair: ETHUSDT ⁃ Timeframe: !H ⁃ Fee 0.075% ⁃ Slippage 0 - Start : 2020-01-03 How you or we can improve? Source code is open so share your ideas!אסטרטגיית Pine Script®מאת TheSocialCryptoClubמעודכן 258
CCI Breakout TraderWorks well on Bitcoin or most altcoins on a 15min chart or higher. What is this exactly? This is an indicator that uses horizontal RSI + EMA lines with a CCI line on top of it to provide optimal entry and exit positions for trading. There is also a breakout indicator based on the width of Bollinger Bands. How to use: If the blue stream passes upwards on the red heading to the white - it's heading towards a good BUY signal. To be safe you wait until it passes above the white line, then BUY LONG. Another signal to buy long is when the blue stream passes above the white and green lines. Selling is essentially the opposite, if the blue stream is passing down from the green or white lines, then it's time to sell and exit your trade. If you need help knowing when to enter and exit a trade the indicator will draw a grey candle on your chart to signal it's time to exit a long trade and it will draw a purple candle when it's time to enter a long. -- Breakout alert: If you see a green vertical bar it's a warning that there is a potential breakout in price coming for whichever coin you are looking at. The price breakout could go either direction, so make sure you watch the blue stream. -- Important tips: The direction of the green/white/red lines are important - if they are heading down that means it might not be the best time to enter your trade, even if the blue stream crosses up on the red and/or white lines. The colored horizontal lines are there to let you know if the blue stream is near the bottom of those lines (anywhere from hline 15 to 50) and heading upwards, you will more likely have a longer positive trade. If the blue stream is above 60 hline and it looks like a good trade (passing up on the red and white lines), expect to have a shorter trade. I use this for swing trading various crypto currencies, once you learn how to read it, you can catch amazing uptrends really early and you can exit trades before some big drops happen.אינדיקטור Pine Script®מאת mmoiwgg33240
Trend Surfers - Premium Breakout + AlertsTrend Surfers - Premium Breakout Strategy with Alerts I am happy today to release the first free Trend Surfers complete Breakout Strategy! The strategy includes: Entry for Long and Short Stoploss Position Size Exit Signal Risk Management Feature How the strategy works This is a Trend Following strategy. The strategy will have drawdowns, but they will be way smaller than what you would go through with buy and old. As a Trend Following strategy, we will buy on strength, when a breakout occurs. And sell on weakness. The strategy includes a FIX Stoploss determined by an ATR multiple and a trailing Stoploss/Takeprofit also determined by an ATR multiple. You can also manage your risk by entering the maximum % you are willing to risk on every trade. Additionally, there is an option to enter how many pairs you will be trading with the strategy. This will change your position size in order to make sure that you have enough funds to trade all your favorite pairs. Use the strategy with alerts This strategy is alert-ready. All you have to do is: Go on a pair you would like to trade Create an alert Select the strategy as a Trigger Wait for new orders to be sent to you Every Entry (Long/Short) will include: Market Entry (Enter position NOW!) Stoploss price Position Size Leverage * If you do not wish to use leverage, you can multiply the Position Size by the Leverage. But doing that, you might end up with a position greater than your equity. Trading on Futures is better in order to have accurate risk management. Exit signals: When you receive an exit signal, you need to close the position ASAP. If you want to keep your results as close as possible to the backtest results, you need to execute quickly and follow what the strategy is telling you. Do not try to outsmart the strategy Leave your emotion out of trading! If you trust the strategy, you will have way better returns than if you try to outsmart it. Follow each signal you receive even if it doesn't seem logical at the moment. Become a machine that executes. Don't look at fundamentals. Follow the trend! Trust the strategy! I hope you enjoy it!אסטרטגיית Pine Script®מאת TrendSurfersSignalsמעודכן 2525 2.2 K
DIGAQM BreakoutDiga QM Breakout chart pattern according to first Qullamaggie setup use it in daily chart, buy if break blue lineאסטרטגיית Pine Script®מאת prajogodiga1
MidZone Breakout Pro 🚀 MidZone Breakout Pro — Smart Balance Zone Signals 🧭 Equilibrium-Based Market Insight MidZone Breakout Pro identifies key balance levels in the market and highlights directional opportunities when price decisively moves away from equilibrium. 📐 Dynamic Midpoint Zone Mapping Automatically plots a central price balance zone derived from recent market ranges, helping traders visualize fair value and expansion areas. 🎯 Clear Buy & Sell Signals Generates clean bullish and bearish signals when price exits the balance zone with momentum. 🎨 High-Visibility Zone Visualization Color-coded zones, background shading, and bold signal markers provide instant clarity without chart clutter. 🎚 Customizable Sensitivity Adjustable lookback period and zone width allow seamless adaptation across scalping, intraday, and swing trading. 🕰 Non-Repainting Signals All signals are calculated using confirmed price action and remain stable on historical charts. ⚡ Lightweight & Fast Performance Optimized design ensures smooth performance across all instruments and timeframes. 🛠 How to Use (Safe Version) 📉 **Buy Signal**: Appears when price moves strongly above the balance zone 📈 **Sell Signal**: Appears when price moves strongly below the balance zone 🟨 **Neutral Zone**: Indicates consolidation or equilibrium conditions Best used in combination with trend direction, support/resistance, or volume confirmation. ⚠️ Disclaimer: This indicator is for educational and analytical purposes only. It does not provide financial advice. Always apply proper risk management. אינדיקטור Pine Script®מאת ChandraBose200244839
Breakout Scanner (Screener)Breakout Scanner (Screener style — single indicator to drop in Screener tab)אינדיקטור Pine Script®מאת thackerandcomumbai5
Trendline Breakout Navigator [LuxAlgo]The Trendline Breakout Navigator indicator shows three trendlines, representing trends of different significance between Swing Points. Dots highlight a Higher Low (HL) or Lower High (LH) that pierces through the Trendline without the closing price breaking the Trendline. A bar color and background color option is included, which offers insights into the price against the trendlines. 🔶 USAGE Trendlines (TL) are drawn, starting as a horizontal line from a Swing Point. When an HL (in the case of a bullish TL) or an LH (bearish TL) is found, this Swing Point is connected to the first Swing Point. In both cases, the TL can be optimized when one or more historical close prices breach the TL (see DETAILS). A solid-styled long-term trendline represents the overall market direction, while a dashed-styled medium-term trendline captures medium-term movements within the long-term trend. Finally, a dotted-styled short-term trendline tracks short-term fluctuations. 🔹 Swing Points vs. Trend A "Higher High" (HH) or "Lower Low" (LL) will initialize a new trendline, respectively, starting from the previous "Swing Low" or Swing High". To spot the trend shift, "HH/LL" labels and an optional background color are included. They can be enabled/disabled or set at "Long, Medium, or Short" term TL (Settings—"MS", "HH/LL" and "Background Color"). These features are linked to one Trendline of choice only. Where the "HH/LL" labels can show a potential trend shift, the background color is: Green from the moment the close price breaks above a bearish trendline or when an HH occurs Red from the moment the close price breaks below a bullish trendline or when an LL occurs 🔹 Bar Color The bar color will depend on the location of the closing price against the three trendlines. When a trendline is unavailable (for example, if the close price breaks the TL and there is no HH/LL), the last known trendline value will be considered. All three trendlines influence the bar color. If the close price is above the "Long Term" TL, the bar color will show a gradient of green, darker when the close price is below the "Medium Term" and/or "Short Term" TLs. On the other hand, when the close price is below the "Long Term" TL, the bar color will show a gradient of red, which becomes darker when the close price is above the "Medium Term" and/or "Short Term" TLs. To keep the above example simple, only the "Long Term" TL is considered. The white line (not included in the script) resembles the actual value of the TL at each bar, where you can see the effect on the bar color. Combined with the trendlines and dots, the bar color can provide extra depth and insights into the underlying trends. 🔹 Tested Trendlines If a new HL/LH pierces the Trendline without the close price breaking the Trendline, the Trendline will be updated. The exact location where the price exceeded the Trendline is visualized by a dot, colored blue on a bullish trendline and orange when bearish. These dots can be indicative of a potential trend continuation or reversal. 🔹 Higher TimeFrame Option The "Period" setting enables users to visualize higher-timeframe trendlines as long as the line length doesn't exceed 5000 bars. 🔶 DETAILS When a new trendline is drawn, the script first draws a preliminary line and then checks whether a historical close price exceeded this line above (in the case of a bearish TL) or below (in a bullish case). Subsequently, the most valid point in between is chosen as the starting point of the Trendline. 🔶 SETTINGS Period: Choose "chart" for trendlines from the current chart timeframe, or choose a higher timeframe 🔹 Swing Length Toggle and Swing Length for three trendlines: Period used for the swing detection, with higher values returning longer-term Swing Levels. 🔹 Style Trendline: color for bullish/bearish Trendline Wick Dot: color for bullish/bearish trendline test Term: Long-, medium- or short-term HH/LL: Show HH/LL labels (with or without previous Swing High/Low) of chosen Term Background Color: Green when the closing price is above the trendline of choice, red otherwise Bar Color אינדיקטור Pine Script®מאת LuxAlgo2121 8.7 K
High-Low Breakout Strategy with ATR traling Stop LossThis script is a TradingView Pine Script strategy that implements a High-Low Breakout Strategy with ATR Trailing Stop.created by SK WEALTH GURU, Here’s a breakdown of its key components: Features and Functionality Custom Timeframe and High-Low Detection Allows users to select a custom timeframe (default: 30 minutes) to detect high and low levels. Tracks the high and low within a user-specified period (e.g., first 30 minutes of the session). Draws horizontal lines for high and low, persisting for a specified number of days. Trade Entry Conditions Long Entry: If the closing price crosses above the recorded high. Short Entry: If the closing price crosses below the recorded low. The user can choose to trade Long, Short, or Both. ATR-Based Trailing Stop & Risk Management Uses Average True Range (ATR) with a multiplier (default: 3.5) to determine a dynamic trailing stop-loss. Trades reset daily, ensuring a fresh start each day. Trade Execution and Partial Profit Taking Stop-loss: Default at 1% of entry price. Partial profit: Books 50% of the position at 3% profit. Max 2 trades per day: If the first trade hits stop-loss, the strategy allows one re-entry. Intraday Exit Condition All positions close at 3:15 PM to ensure no overnight risk. אסטרטגיית Pine Script®מאת Wealth-Guruמעודכן 22454
Bollinger Bands - Breakout StrategyThe Bollinger Bands - Breakout Strategy is a trend-following optimized for short-term trading in the crypto market. This strategy employs the Bollinger Bands, a widely recognized technical indicator, as its primary instrument for pinpointing potential trades. It is capable of executing both long and short positions, depending on whether the market is in a spot or futures, and is particularly effective in trending markets. The strategy boasts a high degree of configurability, allowing users to set the Bollinger Bands period and deviation, trend filter, volatility filter, trade direction filter, rate of change filter, and date filter. Furthermore, it offers options for Take Profit, Stop Loss, and Trailing Stop for both long and short positions, ensuring a comprehensive risk management approach. The inclusion of a maximum intraday loss feature adds another layer of protection, making this strategy a valuable tool for traders seeking a professional and adaptable trading system. Name : Bollinger Bands - Breakout Strategy Category : Trend Follower based on Bollinger Bands Operating mode : Long and Short on Futures or Long on Spot Trade duration : Intraday Timeframe : 2H, 3H, 4H, 5H Market : Crypto Suggested usage : Trending Markets Entry : When the price crosses above or below the Bollinger Bands Exit : Opposite Cross or Profit target, Trailing stop or Stop loss Configuration : - Bollinger Bands period and deviation - Trend Filter - Volatility Filter - Trade direction filter - Rate of Change filter - Date Filter (for backtesting purposes) - Take Profit, Stop Loss and Trailing Stop for long and short positions - Risk Management: Max Intraday Loss Backtesting : ⁃ Exchange: BINANCE ⁃ Pair: BTCUSDT.P ⁃ Timeframe: 4H ⁃ Fee: 0.025% ⁃ Slippage: 1 - Initial Capital: 10000 USDT - Position sizing: 10% of Equity - Start : 2019-09-19 (Out Of Sample from 2022-12-23) - Bar magnifier: on Credits : - LucF of Pine Coders for f_security function to avoid repainting using security. - QuantNomad for Monthly Table. Disclaimer : Risk Management is crucial, so adjust stop loss to your comfort level. A tight stop loss can help minimise potential losses. Use at your own risk. How you or we can improve? Source code is open so share your ideas! Leave a comment and smash the boost button! Thanks for your attention, happy to support the TradingView community. אסטרטגיית Pine Script®מאת TheSocialCryptoClub77 2 K
Clean ADX with bidirectional Breakout VolumeThe default Average Directional Index (ADX) helps traders determine the strength of a trend, not its actual direction. The Clean ADX helps traders determine the strength of a trend on a longer time, and the possible direction on different timeframes. The bidirectional Breakout Volume determines both directions of breakout or breakdown volume. When volume is high by comparing the previous volume high over n periods to the current volume or when volume is lower by comparing the previous volume low over n periods to the current volume. If the current volume exceeds the previous volume high or low, then the indicator columns will turn red or green. This indicator should make trading easier and improve analysis. Nothing is worse than indicators that give confusingly different signals. The combination of the first and second indicator therefore makes perfect sense to me and now you are able to find your long or short trends earlier. I hope you enjoy my new ideas best regards Chervolinoאינדיקטור Pine Script®מאת chervolino88391
[-_-] Level Breakout, Auto Backtesting StrategyDescription: A Long only strategy based on breakout from a certain level formed by High price. It has auto-backtesting capabilities (you set ranges for the three main parameters: Lookback, TP and SL; the strategy then goes through different combinations of those parameters and displays a table with results that you can sort by Percentage of profitable trades AND/OR Net profit AND/OR Number of trades). So you can, for example, sort only by Net profit to find combination of parameters that gives highest net profit, or sort by Net profit and Percentage profitable to find a combination of parameters that gives the best balance between profitability and profit. The auto-backtesting also takes into account the commission which is set in % in the inputs (make sure to set the same value in properties of the strategy so that auto-backtesting and real backtesting results match). NOTE: auto-backtesting only find the best combinations and displays them in a table, you will then need to manually set the Lookback, TP and SL inputs for real backtesting to match. Parameters: - Lookback -> # of bars for filtering signals; recommended range from 2 to 5 - TP (%) -> take profit; recommended range from 5 to 10 - SL (%) -> stop loss; recommended range from 1 to 5 - Commission (%) -> commission per trade - Min/Max Lookback -> lookback range for auto-backtesting - Min/Max TP -> take profit range for auto-backtesting - Min/Max SL -> stop loss range for auto-backtesting - Percentage profitable -> sort by percentage of profitable trades - Net profit -> sort by net profit - Number of trades -> sort by number of tradesאסטרטגיית Pine Script®מאת sabricat55391
Consolidation Breakout [Indian Market Timing]OK let's get started , A Day Trading (Intraday) Consolidation Breakout Indication Strategy that explains time condition for Indian Markets . The commission is also included in the strategy . The basic idea is , 1) Price crosses above upper band , indicated by a color change (green) is the Long condition . 2) Price crosses below lower band , indicated by a color change (red) is the Short condition . 3) ATR is used for trailing after entry // ═══════════════════════════════// // ————————> TIME CONDITION <————————— // // ═══════════════════════════════// The Indian Markets open at 9:15am and closes at 3:30pm. The time_condition specifies the time at which Entries should happen . "Close All" function closes all the trades at 2:57pm. All open trades get closed at 2:57pm , because some brokers dont allow you to place fresh intraday orders after 3pm. NSE:NIFTY1! // ═══════════════════════════════════════════════ // // ————————> BACKTEST RESULTS ( 114 CLOSED TRADES )<————————— // // ═══════════════════════════════════════════════ // LENGTH , MULT (factor) and ATR can be changed for better backtest results. The strategy applied to NIFTY (3 min Time-Frame and contract size 5) gives us 60% profitability , as shown below It was tested for a period a 8 months with a Profit Factor of 2.2 , avg Trade of 6000Rs profit and Sharpe Ratio : 0.67 The graph has a Linear Curve with consistent profits. NSE:NIFTY1! Save it favorites. Apply it to your charts Now !! Thank me later ;) אסטרטגיית Pine Script®מאת The_Algo_Engineer33364
Pivot Point BreakoutThis is a strategy taken from Perry Kaufman's book, Trading Systems and Methods. Just like the title says, it's a breakout strategy. It works by buying when the current high is higher than the last pivot high, and selling when the low is lower than the last pivot low. It does not have a good success probability, and relies on the good reward to risk ratio. Definitely not recommended for someone with weak hands.אסטרטגיית Pine Script®מאת EduardoMattje11218
Breakout in 20 daysbreakout condition 1. current close price must be higher than all close prices in 20 days 2. close prices change in 20 days must be less than 20% 3. current volume must be greater than previous volume by 10% ブレイクアウト条件 1. 最新の終値が直近20日のすべての終値より高い 2. 直近X日の終値の変動率が20%以下 3. 最新の出来高が前日の出来高より10%大きいאינדיקטור Pine Script®מאת kei525dowמעודכן 11133
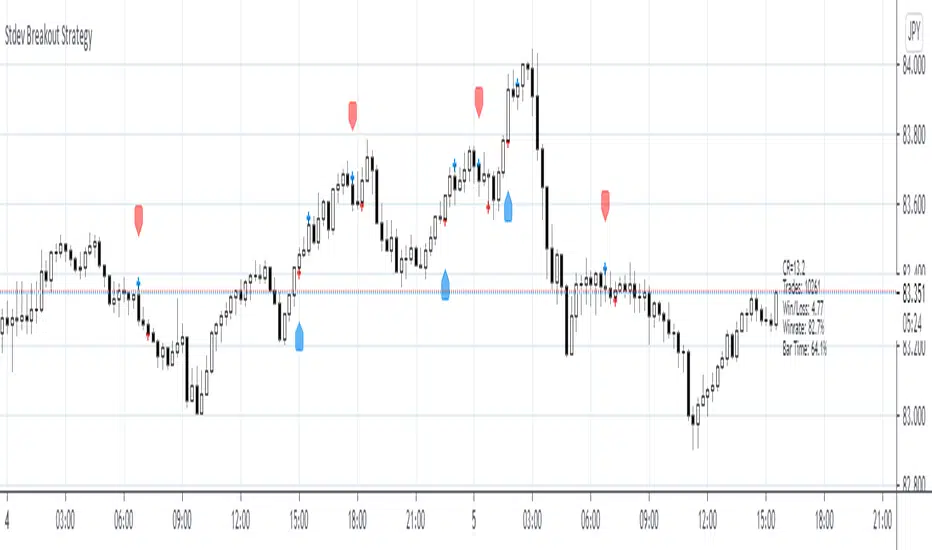
Stdev Breakout StrategyStdev Breakout Strategy Description: This script generates a long entry signal when the Standard Deviation crosses over the Simple Moving Average and the Close is greater than the Open, and/or generates a short entry signal when the Standard Deviation crosses under the Simple Moving Average and the Close is less than the Open.אינדיקטור Pine Script®מאת capissimo22789
True Range Breakout [racer8]TRB (True Range Breakout) plots the current TR (true range) as well as the previous TR high over n periods. If the current TR is greater than the previous TR high, then the TR histogram will become red. Red signals high volatility. Enter trades only when the histogram is above the TR high line. Happy trading! 🥳אינדיקטור Pine Script®מאת racer844210