Dynamic Buy/Sell VisualizationDynamic Trend Visualization Indicator
Description:
This simple and easy to use indicator has helped me stay in trades longer.
This indicator is designed to visually represent potential buy and sell signals based on the crossover of two Simple Moving Averages (SMA). It's crafted to assist traders in identifying trend directions in a straightforward manner, making it an excellent tool for both beginners and experienced traders.
Features:
Customizable Moving Averages: Users can adjust the period length for both short-term (default: 10) and long-term (default: 50) SMAs to suit their trading strategy.
Visual Signals: Dynamic lines appear at the points of SMA crossover, with labels to indicate 'BUY' or 'SELL' opportunities.
Color and Style Customization: Customize the appearance of the buy and sell lines for better chart readability.
Alert Functionality: Alerts are set up to notify users when a crossover indicating a buy or sell condition occurs.
How It Works:
A 'BUY' signal is generated when the short-term SMA crosses above the long-term SMA, suggesting an upward trend.
A 'SELL' signal is indicated when the short-term SMA crosses below the long-term SMA, pointing to a potential downward trend.
Use Cases:
Trend Following: Ideal for markets with clear trends. For example, if trading EUR/USD on a daily chart, setting the short SMA to 10 days and the long SMA to 50 days might help in capturing longer-term trends.
Scalping: In a volatile market, setting shorter periods (e.g., 5 for short SMA and 20 for long SMA) might catch quicker trend changes, suitable for scalping.
Examples of how to use
* Short-term for Quick Trades:
SMA 5 and SMA 21:
Purpose: This combination is tailored for day traders or those looking to engage in scalping. The 5 SMA will react rapidly to price changes, providing early signals for buy or sell opportunities. The 21 SMA, being a Fibonacci number, offers a slightly longer-term view to confirm the short-term trend, helping to filter out minor fluctuations that might lead to false signals.
* Middle-term for Swing Trading:
SMA 10 and SMA 50:
Purpose: Suited for swing traders who aim to capitalize on medium-term trends. The 10 SMA picks up on immediate market movements, while the 50 SMA gives insight into the medium-term direction. This setup helps in identifying when a short-term trend aligns with a longer-term trend, providing a good balance for trades that might last several days to a couple of weeks.
* Long-term Trading:
SMA 50 and SMA 200:
Purpose: Investors focusing on long-term trends would benefit from this pair. The crossover of the 50 SMA over the 200 SMA can indicate the beginning or end of major market trends, ideal for making decisions about long-term holdings that might span months or years.
Example Strategy if not using the Buy / Sell Label Alerts:
Entry Signal: Enter a long position when the shorter SMA crosses above the longer SMA. For example:
SMA 10 crosses above SMA 50 for a medium-term bullish signal.
Exit Signal: Consider exiting or initiating a short position when:
SMA 10 crosses below SMA 50, suggesting a bearish turn in the medium-term trend.
Confirmation: Use these crossovers in conjunction with other indicators like volume or momentum indicators for better confirmation. For instance, if you're using the 5/21 combination, look for volume spikes on crossovers to confirm the move's strength.
When Not to Use:
Sideways or Range-Bound Markets: The indicator might generate many false signals in a non-trending market, leading to potential losses.
High Volatility Without Clear Trends: Rapid price movements without a consistent direction can result in misleading crossovers.
As a Standalone Tool: It should not be used in isolation. Combining with other indicators like RSI or MACD for confirmation can enhance trading decisions.
Practical Example:
Buy Signal: If you're watching Apple Inc. (AAPL) on a weekly chart, a crossover where the 10-week SMA moves above the 50-week SMA could suggest a buying opportunity, especially if confirmed by volume increase or other technical indicators.
Sell Signal: Conversely, if the 10-week SMA dips below the 50-week SMA, it might be time to consider selling, particularly if other bearish signals are present.
Conclusion:
The "Dynamic Trend Visualization" indicator provides a visual aid for trend-following strategies, offering customization and alert features to streamline the trading process. However, it's crucial to use this in conjunction with other analysis methods to mitigate the risks of false signals or market anomalies.
Legal Disclaimer:
This indicator is for educational purposes only. It does not guarantee profits or provide investment advice. Trading involves risk; please conduct thorough or consult with a financial advisor. The creator is not responsible for any losses incurred. By using this indicator, you agree to these terms.
חפש סקריפטים עבור "buy sell"

True Strength Index with Buy/Sell Signals and AlertsThe True Strength Index (TSI) is a momentum oscillator that helps traders identify trends and potential reversal points in the market. Here’s how it works:
1. **Price Change Calculation**:
- **`pc = ta.change(price)`**: This calculates the change in price (current price minus the previous price).
2. **Double Smoothing**:
- **`double_smooth(src, long, short)`**: This function smooths the price change data twice using two Exponential Moving Averages (EMAs):
- The first EMA smooths the raw data.
- The second EMA smooths the result of the first EMA.
- **`double_smoothed_pc`**: The double-smoothed price change.
- **`double_smoothed_abs_pc`**: The double-smoothed absolute price change, which helps normalize the TSI value.
3. **TSI Calculation**:
- **`tsi_value = 100 * (double_smoothed_pc / double_smoothed_abs_pc)`**: This calculates the TSI by dividing the double-smoothed price change by the double-smoothed absolute price change, then multiplying by 100 to scale the value.
- The TSI oscillates around the zero line, indicating momentum. Positive values suggest bullish momentum, while negative values suggest bearish momentum.
4. **Signal Line**:
- **`signal_line = ta.ema(tsi_value, signal)`**: This creates a signal line by applying another EMA to the TSI value. The signal line is typically used to identify entry and exit points.
5. **Buy and Sell Signals**:
- **Buy Signal**: Occurs when the TSI crosses above the signal line (`ta.crossover(tsi_value, signal_line)`), indicating that bullish momentum is strengthening, which might suggest a buying opportunity.
- **Sell Signal**: Occurs when the TSI crosses below the signal line (`ta.crossunder(tsi_value, signal_line)`), indicating that bearish momentum is strengthening, which might suggest a selling opportunity.
6. **Visual Representation**:
- The TSI line and the signal line are plotted on the chart.
- Buy signals are marked with green "BUY" labels below the bars, and sell signals are marked with red "SELL" labels above the bars.
**How to Use It**:
- **Trend Identification**: When the TSI is above zero, it suggests an uptrend; when it's below zero, it suggests a downtrend.
- **Buy/Sell Signals**: Traders often enter a buy trade when the TSI crosses above the signal line and enter a sell trade when the TSI crosses below the signal line.
- **Divergences**: TSI can also be used to spot divergences between the indicator and price action, which can signal potential reversals.
The TSI is particularly useful in identifying the strength of a trend and the potential turning points, making it valuable for trend-following and swing trading strategies.

EMA Crossover Buy/Sell IndicatorScript Overview
This script is a trading indicator designed to identify potential buy and sell signals based on the crossover of two Exponential Moving Averages (EMAs):
Indicator Title and Setup:
The script is named "EMA Crossover Buy/Sell Indicator" and is plotted directly on the price chart.
EMAs Calculation:
It calculates two EMAs: a 20-period EMA and a 50-period EMA. These are used to analyze the market trends over different time frames.
Plotting EMAs:
The 20-period EMA is shown on the chart in blue.
The 50-period EMA is shown in orange.
These lines help visualize the current trend and potential points of interest where the moving averages intersect.
Generating Signals:
A buy signal is triggered when the 20-period EMA crosses above the 50-period EMA.
A sell signal is triggered when the 20-period EMA crosses below the 50-period EMA.
These signals suggest potential buying or selling opportunities based on the crossover of the EMAs.
Displaying Signals:
Buy signals are marked with green labels below the bars on the chart.
Sell signals are marked with red labels above the bars on the chart.
This visual representation helps traders quickly identify potential trading opportunities.
Alerts:
Alerts are set up to notify the trader when a buy or sell signal occurs.
The alert messages specify whether the signal is a buying opportunity or a selling opportunity based on the EMA crossovers.

Movement based on Buying/Selling VolumeDescription:
The "Buying Selling Volume" indicator calculates buying and selling volumes based on price movements within a specified lookback period. It then computes exponential moving averages (EMAs) of these volumes to determine trend direction. The indicator visually represents trend direction on the chart.
Volume Calculation and Normalization (Lines #1 - #12):
The indicator first computes the buying volume (BV) and selling volume (SV) based on price movements within the specified lookback period. These volumes are calculated proportionally to the distance between the closing price and the high and low of each candle.
To ensure consistent behavior and prevent division by zero, the volumes are normalized using a conditional statement to handle cases where the high and low are equal, which implies a lack of price movement.
Additionally, the volume (vol) is normalized to ensure non-zero division in subsequent calculations.
Total Volume and Proportional Volume Calculation (Lines #13 - #20):
The total volume (TP) is computed by summing the buying and selling volumes.
The proportional buying volume (BPV) and selling volume (SPV) are then calculated based on their respective contributions to the total volume.
These proportional volumes are scaled by the total volume to ensure accurate representation relative to market activity.
Evaluating Buying and Selling Pressure (Lines #21 - #24):
The code segment assigns positive or negative values to represent buying and selling pressure, respectively, based on the comparison between BPV and SPV. This step involves determining whether the buying pressure exceeds the selling pressure or vice versa.
The calculated values, denoted as BPc1 and SPc1, encapsulate the relative strength of buying and selling forces within the market.
EMA Calculation and Trend Identification (Lines #25 - #32):
The BPc1 and SPc1 values are subjected to exponential moving average (EMA) calculations using the specified lookback period (LookbackL). This process involves smoothing out the buying and selling pressure data to reveal underlying trends.
The resulting EMAs, represented by ema1B and ema1S, serve as crucial indicators of trend direction. A bullish trend is indicated when ema1B exceeds ema1S, while a bearish trend is signaled when ema1B falls below ema1S.
Secondary Volume Analysis and Trend Confirmation (Lines #33 - #42):
A similar volume analysis and EMA calculation process is repeated in this segment, using a different lookback period (LookbackL2). This allows for a secondary assessment of market dynamics and trend direction.
The resulting EMAs, denoted as ema1B2 and ema1S2, are compared to validate the trend direction identified in the primary analysis.
Visual Representation and Trend Display (Lines #43 - #46):
Finally, the indicator visualizes the identified trends on the chart by plotting colored shapes based on the comparison between the primary and secondary trend directions.
A green color indicates alignment in bullish trends, a red color signifies alignment in bearish trends, while a neutral color (gray) represents no clear consensus between the primary and secondary analyses.
Ideal Usage:
1. **Trend Confirmation:** Traders can use this indicator to confirm trend direction before entering trades.
2. **Reversal Signals:** Changes in trend direction, indicated by shifts in plotted shape colors, can signal potential market reversals.
Warnings:
1. **False Signals:** Like any technical indicator, false signals may occur, especially during low-volume or choppy market conditions. Additional analysis and risk management techniques are essential to mitigate potential losses.
2. **Parameter Sensitivity:** Adjusting lookback periods can impact the indicator's sensitivity to price movements. Traders should test different parameter settings and consider market conditions when using the indicator.

TradeDots - Buy Sell SignalsThe TradeDots Buy Sell Indicator is a sophisticated multi-strategy analytics tool designed to discern market direction and identify potential trading opportunities.
The TradeDots indicator utilizes a trend-following strategy that initially identifies the long-term market trend, whether bullish or bearish, at a macro level. It then zooms in on pullback and reversal price action patterns within this broader trend. These patterns are confirmed by a micro-level candlestick analysis, which leads to the issuance of a "buy" alert. This process ensures both macro and micro elements of the market are considered before entering a trade.
How Does It Work?
In more detail, the procedure begins at the macro level where the advanced indicator applies an Exponential Moving Average (EMA) within the current timeframe. This EMA is then cross-verified with another EMA of the same length from a higher timeframe, ensuring a reliable assessment of long-term market trends. This approach helps establish whether the market situation favors long or short positions.
Following this, a complex mathematical model uses a designated window of candlesticks to calculate price action changes, storing all significant reversal patterns for subsequent comparison. The algorithm then identifies similar repeated reversal patterns in the chart, pinpointing potential market turning points.
For precision and reliability, the confirmation of these reversal patterns involves further refinement and filtering at a micro level. By calculating market momentum in tandem with an exhaustive analysis, e.g. Average True Value (ATR), candlestick body and wick data, the algorithm can affirm the reversal. Finally, the buy or sell signals are plotted on the chart in real-time.
The indicator includes 4 distinct entry strategies for both "Long" and "Short" orders. Each strategy represents different levels of rigorousness in their analysis rules. For instance, a "Weak Buy" signal represents a lighter pullback strength compared to a "Strong Buy" signal, with "Reversal Buy" exhibiting the robust pullback strength based on the change in price action value.
Each type of order comes with its minimum threshold and conditions for profit-taking to prevent excessive trading activity that could lead to high commission costs. Once these conditions are met and coupled with a reversal signal — generated with the same concepts as mentioned earlier but in the opposite direction — a sell signal is then triggered in real time. It's a systematic process that ensures an optimal balance between timely entries and exits in the market.
Generating Trading Ideas Catering To Traders Of All Kinds
TradeDots Buy Sell Indicator includes multiple strategies and many features:
4+ Types of Trading Alerts: Strong, Weak, Reversal, and Breakout for different market conditions (Should not be followed blindly).
2+ Trading Styles: Buy and Hold, Swing Trading (Should not be followed blindly).
Facilitates both "Long" and "Short" trades.
+ more. (Check the changelog below for current features)
HOW TO USE
⭐️ TRADING STRATEGY
Buy and Hold: An approach suitable for long-term investments or as an alternative to a dollar-cost averaging strategy by identifying only the undervalued positions in markets with long-term growth potential like stocks and indices.
Note: This strategy does not provide an exit strategy.
Swing Trading: This method targets buying low and selling high, adapted for traders looking to make the most of short to mid-term market volatility.
⭐️ ORDER DIRECTION
Order direction is for “Swing trading” strategy and other strategies that comes with an exit strategy. It is to choose the direction of the market that you wish to place your order on.
Long: Primarily targeting markets that exhibit a left-skewed trend (more often it rises than falls), this strategy focuses on "long" trading opportunities, avoiding "short" market actions.
Short: Apt for markets displaying a right-skewed trend (more often it falls than rises), this approach targets "short" opportunities exclusively, refraining from "long" market actions.
Long and Short: This comprehensive strategy identifies trading opportunities for both "long" and "short" market actions, facilitating increased opportunities for volatile assets.
⭐️ ALERT TYPES
Strong: These alerts designate high risk/reward return opportunities with a reasonable win rate. They tend to appear near previous support pivots where a Change in Character (CoCh) may often occur, typically coupled with a tight stop-loss strategy.
Weak: Indicative of opportunities balancing risk/reward return and win-rate, these alerts often appear during strong momentum markets.
Reversal: These signals identify potential reversals by highlighting extreme oversold or overbought states, thus revealing markets that are underpriced or overpriced for swift trading actions.
Breakout: They are to identify a change in trend and market breakout by gaps created post earnings or significant economic events, purposed for "Buy high, sell higher" strategies.
⭐️ STOP LOSS
The stop-loss feature offers customization options, enabling users to close a position upon reaching a predefined percentage drawdown. As volatility varies across different timeframes and markets, tuning this feature in accordance with the market allows optimal usage of this indicator.
CONCLUSION
While technical indicators are certainly vital in trading analysis, they are just one part of the equation. The individual trader's style and mindset significantly influence their trading outcomes, making them equally crucial in the process. Therefore, relying solely on indicators for a successful trading outcome may not be the most effective strategy.
Understanding and leveraging these indicators requires substantial time and significant effort from traders. They need to deeply engage with these tools to truly grasp their behavior and functionality. Taking this into consideration, our aim is to create highly advanced, customizable, and user-friendly technical indicators. This tool is designed to illuminate the fundamental role that technical indicators play as a supportive decision-making apparatus, aiding traders to more swiftly embark on their journey towards successful trading.
See Author's instructions below to get instant access to this indicator.
RISK DISCLAIMER
Trading entails substantial risk, and most day traders incur losses. All content, tools, scripts, articles, and education provided by TradeDots serve purely informational and educational purposes. Past performances are not definitive predictors of future results.

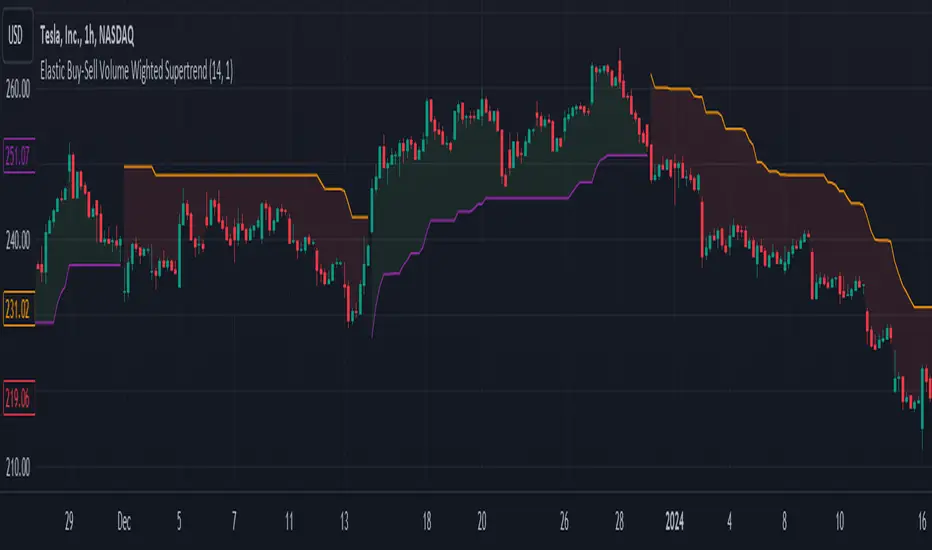
Elastic Buy-Sell Volume Wighted SupertrendCredits: This uses Trading View's buy and sell volume script and the Super trend script.
Elastic Buy-Sell Volume Wighted Supertrend can be used like a traditional supertrend indicator however we do not have to arbitrarily choose a multiplier depending on the stock and time frame the code dynamically adjust the multiplier and this is described below.
The buy and sell ATR (Average True Range) play a crucial role in determining the levels for potential buy and sell signals in the market. These ATR values are calculated based on volume-weighted averages, providing insights into the strength of buying and selling pressures. By incorporating volume into the ATR calculation, the indicator can better adapt to market dynamics, as volume often reflects the intensity of price movements. Instead of using Volume as whole this uses up and down volume derived from lower time frames which is used to calculate buy and sell ATR.
The multiplier is a key factor in the Supertrend calculation, which adjusts the width of the trend bands. The multiplier in this indicator dynamically adjusts itself based on two key components: the ratio of the asset's Average True Range (ATR) to that of a broader market benchmark and the coefficient of variation (CV) of the True Range (TR). The ratio comparison provides a historical context of the asset's volatility relative to the wider market over a longer time frame, while the CV accounts for short-term fluctuations in volatility.
By comparing the asset's ATR to that of the benchmark, traders gain insights into the asset's historical volatility behavior. A higher multiplier suggests that the asset's volatility has historically exceeded that of the benchmark, indicating potentially larger price movements compared to the broader market. Conversely, a lower multiplier suggests the opposite.
The CV component measures short-term variability in the asset's volatility, ensuring that the multiplier adapts to both long-term trends and short-term fluctuations. This combined approach enables traders to make informed decisions, considering both historical volatility relative to the broader market and short-term variability. Ultimately, the dynamic multiplier enhances traders' ability to adjust their strategies effectively across various market conditions.
Overall, the use of buy and sell ATR, along with a dynamically adjusted multiplier, enhances the indicator's ability to identify trend directions and to use a dynamic stop loss level.
DNS Relax Buy/SellDNS Relax Buy/Sell Indicator
It is a very simple indicator to use for long-term investors.
It uses ema 3 in Buy and Sell alerts. If ema 3 crosses the baseline line (ema200 Daily) up, it means Buy, and if it breaks down, it means Sell.
There is also a 'take profit line' to determine and see the profit rate.
It can be changed from the settings.
Additionally, the blue line on the indicator (appears as full blue) is the closing price line of the bar where the buy signal is located. It can be turned off from the style settings.
You can also turn buy and sell signals on and off from the settings.
My advice to you is to use this indicator in small time periods. for example, in 1-minute, 3-minutes or 5-minutes time periods.
It can be used in all financial instruments.
Wishing you to always win.

YinYang Fear and Greed Index (FGI)Overview:
YinYang Fear and Greed Index is used for seeing how people are feeling towards the current price. It works similar to an RSI, but fluctuates differently. Essentially you want to be Greedy when the Index displays Fear and Fearful when it displays Greed. Our Indicator displays a Green Circle (Greed Signal) on the YinYang Fear and Greed Index when there is a large amount of Greed at this price point. It displays a Red Circle (Fear Signal) when there is a large amount of Fear. The Fear and Greed Signals can happen at any Fear and Greed Index but generally they correlate with the Index level. The Fear and Greed Signals are much more important at dictating a swing in momentum than the actual Index itself. The Index is more of a guide and is useful for seeing when the Index level crosses the Ma (the yellow line) as you can see a shift in momentum. However for large swings in momentum, the Fear and Greed Signals should be used. Do NOT Ignore these signals, they are quite powerful at predicting momentum swings.
Tutorial:
As you can see, the Fear and Greed Index looks somewhat similar to an RSI, but it has the ability to gain drastic momentum when there are strong changes in Fear and Greed.
When it comes to identifying buy/sell locations you generally want to ensure 2 things:
For a buy, the Fear and Greed Index (FGI) is less than 30.
For a sell, the FGI is greater than 70.
A signal has occurred. For buy that is the red circle and for sell that is the green circle.
The reason we generally want to ensure these 2 rules is to ensure you have the highest chance of being right with the lowest risk of being wrong. The way you want to use this indicator is; Be Fearful when others are Greedy and Greedy when others are Fearful.
There will be times when a fear or greed signal appears when the index is between 30-70. When these occur, they are still generally strong signal locations that represent a high chance of momentum in the direction they signal, however they face a higher risk of being wrong and therefore shouldn’t be used on its own to make a trade.
In the photo above we can see that the FGI’s color changed from Red to Orange in the candle after the Fear Signal. This happened because there was high price movement right after it (which is normal) and caused the Fear level to drop.
The color the FGI displays is based not off the FGI but by the STATE it is currently in. When the color is Green it is in a state of HIGH GREED, when the color is Red it is in a state of HIGH FEAR. When the color is Teal it is in a state of SLIGHT GREED, when the color is Orange it is in a state of SLIGHT FEAR. These colors hold true for the Information Tables as well.
As we can also see from the example above, it is 100% possible to have a state of HIGH GREED when the FGI is low. For instance look at the Fear (BUY) signals circled. Right before the Fear Signals happened, it was in a state of HIGH GREED (Green). The opposite is also true with Fear. We can have a high state of Fear when the FGI is high. However, please do remember, the lowest risk and best time to make trades is still:
FGI is higher than 70 and there is a Greed Signal = SELL
FGI is lower than 30 and there is a Fear Signal = BUY
You may notice there are sometimes occurrences that we call ‘Oddballs’. These oddballs are quite rare but they do happen and when they do they’re generally in clusters (close together). These Oddballs are when a Greed Signal occurs when the FGI is very low or when a Fear Signal occurs when the FGI is very high. Basically, they are occurring in the opposite location that they are supposed to. These may not seem like they matter but they matter a lot. As you can see based on where the blue vertical lines are, the price moved in the direction the signal identified shortly after the signal.
You may be wondering, are Oddball’s stronger price influencers than the regular signal? The issue with Oddballs is they sometimes CAN BE. But generally they aren’t. They generally do signal price movement will occur in the direction they are influencing, but generally not as much movement as if it occurred properly (Fear signal under 30 or Greed signal above 70).
The takeaway from Oddballs is to acknowledge their existence and potentially use them as markers for smaller purchases or DCA locations. We don’t recommend treating them as a legitimate purchase signal as they generally are weaker and less predictable, but nevertheless don’t dismiss them.
Our Information Tables are there to show you the FGI on 6 different Time Frames at the same time. This can be very useful for knowing how the other Time Frames are fairing while you are trading without needing to constantly change the Time Frame you are on.
For example, you see a Fear Signal on the 1 Day Time Frame, you then swap to the 15 minute Time Frame to find your entry location. Well, once you’re locked into that trade, you’ll likely be fixated on the 15 minute Time Frame. There’s a chance while you’re still waiting for your exit that levels and states of the FGI could change on higher Time Frames. This could drastically influence when and where your exit on the lower Time Frame should be.
This concludes our Tutorial on how to use YinYang Fear and Greed Index (FGI). However, continue reading for a description and better understanding of the Settings available to you for customization within this Indicator.
Settings:
1. Information Tables:
1.1. Show Information Tables:
Our Information Tables display 6 different Time Frames (resolutions) so that you can see the current level of Fear and Greed (FGI) that is prevalent on each Time Frame. There are 4 different states the FGI can be in:
Fear (Red)
Minor Fear (Orange)
Greed (Green)
Minor Greed (Teal)
The color of each Time Frame Cell (on Oscillator and in the table) is based on the following:
Red: Red represents that it is currently in a state of Fear. When it is in a state of fear it means traders are being overly bearish and selling when they likely shouldn’t. While it is in a state of Fear, there is a high chance of BULLISH price movement occurring. Remember, Be Fearful when others are Greedy and Greedy when others are Fearful.
Orange: Orange represents that it is currently in a state of Minor Fear. Minor Fear means that the FGI is less than 50, but it’s not currently in a state of Fear or Greed. While it is in this state, there is a better chance for BULLISH price action than there is bearish but it's nowhere near as likely as when in a state of Fear.
Green: Green represents that it is currently in a state of Greed. When it is in a state of Greed, it means traders are being overly bullish and buying when they shouldn’t. While it is in a state of Greed, there is a high chance of BEARISH price movement occurring.
Teal: Teal represents that it is currently in a state of Minor Greed. Minor Greed means that the FGI is greater than 50, but it’s not currently in a state of Fear or Greed. While it is in this state, there is a better chance for BEARISH price actions than there is bullish; but it’s nowhere near as likely as when its in a state of Greed.
2. Res1 / Res2/ Res3 / Res4 / Res5 / Res6:
These represent the different resolutions (Time Frames) being used in your information tables and can be modified to display whatever resolution works best for your trading style. By default they are:
Res1: Current Timeframe
Res2: 15 Minute
Res3: 1 Hour
Res4: 4 Hour
Res5: 1 Day
Res6: 1 Week
Backup Res (not changeable): 5 Minute (this is only used if your Current Timeframe in Res1 is a duplicate of one of the other resolutions)
Our Fear and Greed Index can be very useful for understanding how people are feeling in the market and when large price swings will occur. Remember, Be Greedy when others are Fearful and Fearful when others are Greedy!
If you have any Questions or Concerns, don’t hesitate to contact us.
HAPPY TRADING!

thuyliemforever EMA Scalper - Buy/Sellthuyliemforever EMA Scalper - Buy/Sell
Indicator that help you make decision buy or sell.

MM SIGMA STC+ADXThe Schaff Trend Cycle (STC) is a charting indicator that is commonly used to identify market trends and provide buy and sell signals to traders. Developed in 1999 by noted currency trader Doug Schaff, STC is a type of oscillator and is based on the assumption that, regardless of time frame, currency trends accelerate and decelerate in cyclical patterns.12
How STC Works
Many traders are familiar with the moving average convergence/divergence (MACD) charting tool, which is an indicator that is used to forecast price action and is notorious for lagging due to its slow responsive signal line . By contrast, STC’s signal line enables it to detect trends sooner. In fact, it typically identifies up and downtrends long before MACD indicator.
While STC is computed using the same exponential moving averages as MACD, it adds a novel cycle component to improve accuracy and reliability. While MACD is simply computed using a series of moving average, the cycle aspect of STC is based on time (e.g., number of days).
It should also be noted that, although STC was developed primarily for fast currency markets, it may be effectively employed across all markets, just like MACD. It can be applied to intraday charts, such as five minutes or one-hour charts, as well as daily, weekly, or monthly time frames.
Introduction to ADX
ADX is used to quantify trend strength. ADX calculations are based on a moving average of price range expansion over a given period of time. The default setting is 14 bars, although other time periods can be used.1 ADX can be used on any trading vehicle such as stocks, mutual funds, exchange-traded funds and futures.
ADX is plotted as a single line with values ranging from a low of zero to a high of 100. ADX is non-directional; it registers trend strength whether price is trending up or down.2 The indicator is usually plotted in the same window as the two directional movement indicator (DMI) lines, from which ADX is derived (shown below).Quantifying Trend Strength
ADX values help traders identify the strongest and most profitable trends to trade. The values are also important for distinguishing between trending and non-trending conditions. Many traders will use ADX readings above 25 to suggest that the trend is strong enough for trend-trading strategies. Conversely, when ADX is below 25, many will avoid trend-trading strategies.
ADX Value Trend Strength
0-25 Absent or Weak Trend
25-50 Strong Trend
50-75 Very Strong Trend
75-100 Extremely Strong Trend
Low ADX is usually a sign of accumulation or distribution. When ADX is below 25 for more than 30 bars, price enters range conditions, and price patterns are often easier to identify. Price then moves up and down between resistance and support to find selling and buying interest, respectively. From low ADX conditions, price will eventually break out into a trend. Below, the price moves from a low ADX price channel to an uptrend with strong ADX.
Added Buy/Sell alerts
ADX filters based on the threshold you put in the settings.
great for trend and trade confirmation

Long Term Buy/Sell Signal by BonyThis script attempts to use Exponential Moving averages (short-term and long-term convergence) of different lengths in order to identify trade entries and exits for bullish & bearish trades. I would strongly recommend using this as a guide to enter or exit long-term swing trades on growth names such as Apple, Tesla, Microsoft to keep your emotions out of the trading. You use this script by entering a trade when it signals a green BUY signal with a UP arrow and exiting when it signals red. The general idea is that one is fast and one is slow-moving EMA and these indicate when to buy/sell when they crossover the overbought/sold lines.
Disclaimer:
This script is for educational purposes only. The market is always moving up or down, so always trade with caution and use your best judgment for every trade.

ExpertToken Buy/Sell SignalExpertToken Buy/Sell Signal เป็นอินดิเคเตอร์ที่สามารถบอกสัญญาณการซื้อขาย และบอกแนวโน้มของราคาได้
หลักการทำงาน
สัญญาณ Buy/Sell ถูกกำหนดโดยการใช่ CCI วัดโมเมนตัมการซื้อขาย หาก CCI ส่งสัญญาณว่าแรงขายเยอะเกินไป และมีแนวโน้มราคาจะกลับตัวสูงขึ้น ก็จะส่งสัญญาณ Buy แต่หาก CCI ส่งสัญญาณว่าแรงซื้อเยอะเกินไป และมีแนวโน้มราคาจะกลับตัวต่ำลง ก็จะส่งสัญญาณ Buy
เส้นสีน้ำเงินเป็นเส้น EMA 200 ไว้ใช้บอกแนวโน้มระยะยาว
เมฆขาว ประกอบไปด้วย เส้นสีเขียว(เส้น EMA เคลื่อนที่เร็ว) และเส้นสีแดง(เส้น EMA เคลื่อนที่ช้า) โดยให้ทั้งสองเส้นตัดกันเพื่อบอกสัญญาณการกลับตัว ค่าเริ่มต้นของทั้งสองเส้นเป็น 20, 50
วิธีการใช้อินดิเคเตอร์
ขั้นตอนแรก ให้ดูเส้นสีน้ำ หากราคาอยู่เหนือเส้นสีน้ำเงิน อาจมีแนวโน้มที่ราคาจะขึ้น
ขั้นตอนที่สอง ให้ดูเมฆ ที่ถูกสร้างขึ้นโดยการน้ำเส้น EMA 2 เส้น สีเขียวและสีแดง หากเส้นสีเขียวอยู่เหนือเส้นสีแดง ราคาอาจมีแนวโน้มที่ขึ้น หากเส้นสีแดงอยู่เหนือเส้นสีเขียว ราคาอาจจะลง แต่ถ้าหากราคาอยู่ในโซนเมฆขาว(ราคาอยู่ระหว่างเส้นเขียวกับสีแดง) ราคาอยู่ในช่วงเป็นกลาง
สุดท้าย หากมีข้อความบอกสัญญาณบอกว่า Buy หรือ Sell ให้พิจารณาจากสองขั้นตอนก่อนหน้านี้ หากมันสอดคล่องกับสองขั้นตอนก่อนหน้านี้ ให้พิจารณาการเปิดตำแหน่งตามสัญญาณ
################################################################################################
ExpertToken Buy/Sell Signal is an indicator that can give you trading signals. and tell the trend of the price
How it works
Buy/Sell signals are determined by using CCI to measure trading momentum.
If CCI signals too much selling pressure and there is a tendency for the price to reverse higher It sends a buy signal, but if CCI signals that it is overbought and the price tends to reverse lower will send signal Buy
The blue line is the EMA 200 line to indicate a long-term trend.
The white cloud consists of a green line (fast moving EMA line) and a red line (slow moving EMA line), with the two lines intersecting to signal a reversal. The default values for both lines are 20, 50.
How to use the indicator
The first step is to look at the watercolor lines. If the price is above the blue line There may be a tendency for prices to go up.
The second step is to look at the clouds that are created by watering the 2 EMA lines, green and red. If the green line is above the red line The price may tend to go up. If the red line is above the green line, the price may go down, but if the price is in the white cloud zone (the price is between the green and red line), the price is in the neutral range.
Finally, if there is a signal to say Buy or Sell, consider the previous two steps. If it complies with the previous two steps Consider opening a position based on a signal.

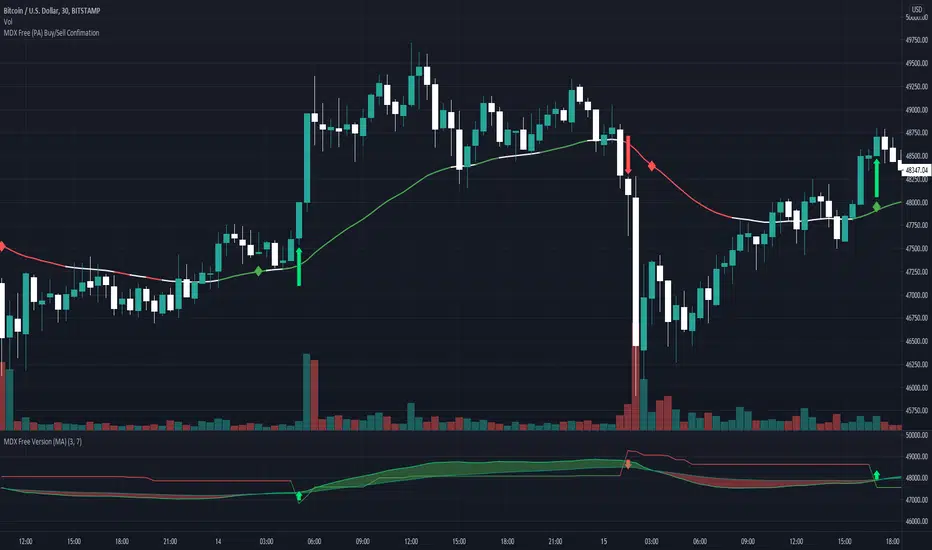
MDX Free (PA) Buy/Sell ConfimationThis is a free version of the MDX Crypto trading "bot". Note that this indicator and the MDX version are based on simple code available on trading view or via google search.
This indicator is based on the super trend indicator to provide buy/sell signals at inflection points of uptrends and downtrends. These inflection points are commonly used as entry/exit points for trading. They are represented on the chart as green (buy) or red (sell) arrow.
This also uses two exponential moving averages. One average is set over 21 bars (fast) and the other is set over 55 bars (slow). When the plots intersect it represents a change in momentum. This is shown on the chart as a red (negative change) or green (positive change) diamonds. When a green diamond follows a green arrow it is considered a confirmed buy. When a red diamond follows a red arrow it is a confirmed sell.
Caution:
Caution this indicator is not reliable on its own, especially on low time scales. When looking back in time this indicator will almost always show a "confirmed buy" before a large increase in price, but on many occasions you can have a "confirmed buy" which is followed by a dump in price, that will not trigger sell signal in time. For best results use with 15m to 1h timeframes
Disclaimer:
This indicator is for informational purposes and should be used for educational purposes only. If you rely on this for trading without additional information you will loose money. I am not a financial advisor, or a professional trader. Use at your own risk.
This is an unpolished version. It may be updated and the source code published if it is used.
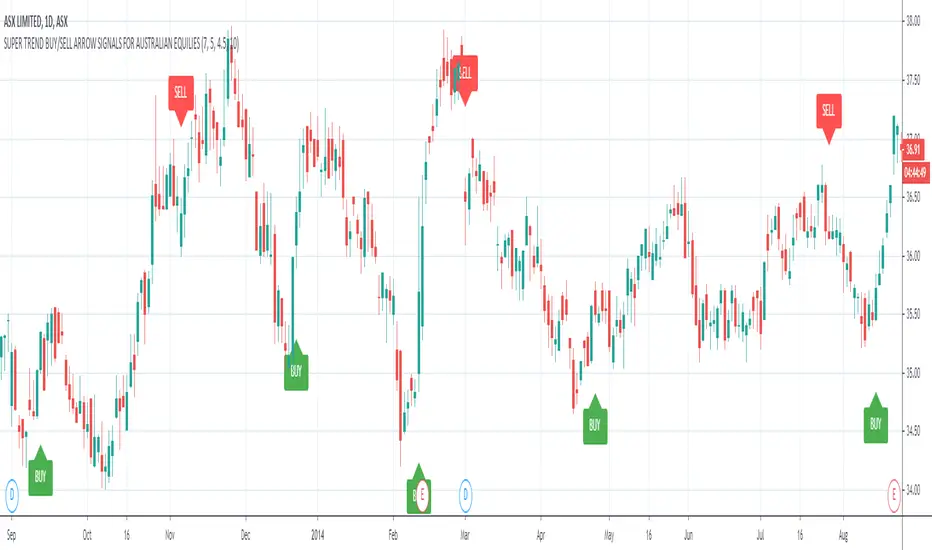
ASX Buy/Sell Arrow Signals For Australian Equities TradingASX Buy/Sell Arrow Signals For Australian Equities Trading.
ASX:ASX
This indicator is specifically designed to trade on assets on the Australian Stock Exchange.
The indicator analyzes historical data and predicts short-term trends and reversal points, as well as generates alert Buy/Sell or Long/Short trading signals.
A distinctive feature of this indicator is that the signals are filtered and high-precision signals are displayed.
The script is useful for trading as an independent trading system, as well as in combination with other indicators, as an addition to any existent trading system.
This script was compiled at the request of our subscribers and we hope it will be useful in trading.
The indicator uses a combination of few popular indicators such as MACD, RSI, Moving Averages.
Recommended for trading on timeframes: D1, W1.
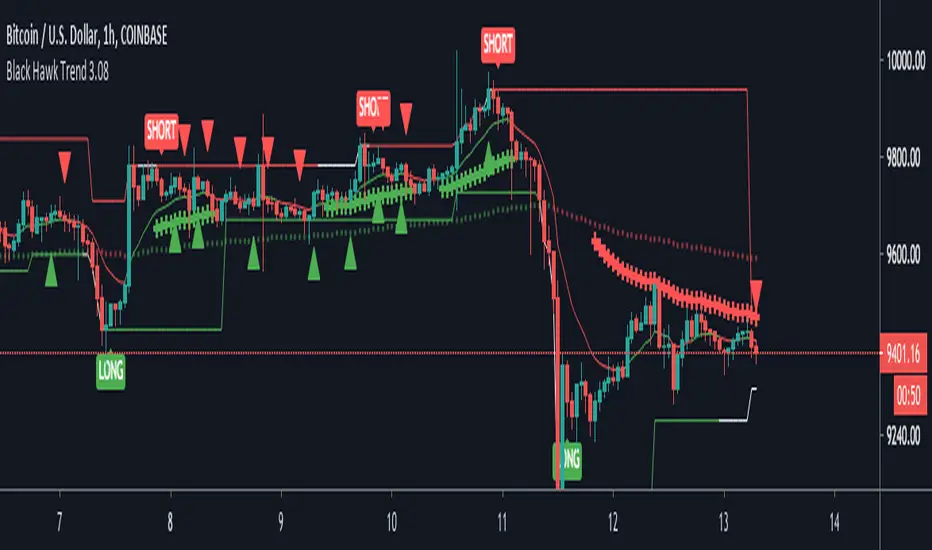
Black Hawk Trend 3The Black Hawk Trend indicator uses data from sources (such as EMAs, RSI, Stochs) to derive a trend direction. This indicator contains a pivot line that turns green when there is a buy position (lower bar) and it turns red when there is an active sell position (upper bar).
When there is a buy/sell signal, this does not mean buy immediately at this point, but rather look for a potential entry.
This indicator has the ability to treat buy and sells separately (Default: 2 account method) or it can use them in tandem (1 account method).
There is a toggle in the settings to modify the code for Bitcoin vs Forex (& Stocks).
When there is a strong trend, a red/green “+” sign shows up; this typically means take caution when trying to take a position countertrend.
There are also red/green triangles that signify a potential area to add to a position.
#Disclaimer:
1. I am not a financial advisor.
2. I do not guarantee this script will provide consistent profits or that anyone can make money with it.
Use the link below to obtain access to this indicator.
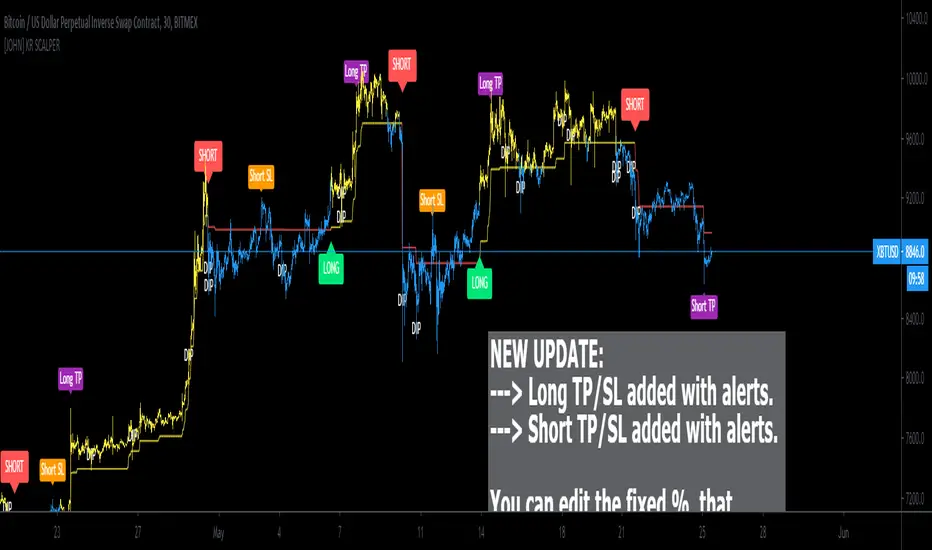
[JOHN] KR SCALPERHello this is KR SCALPER indicator. (work on crypto market)
---------------------------------
How this indicator work?
KR SCALPER script work with bollinger bands, price volatility and ATR (average true range).
This system provide
- HIGH QUALITY BUY/SELL Signals with a reasonable ROI.
- DIPS noted on chart with "DIP" TEXT, thanks to the use of bbands parameters.
- Work in cryptocurrency market, tested with top 10 coins, with good results.
- Tested on LTF (from 5m to 1h), work even on 4h, 1d.
How use it?
Indicator is setup for cryptocurrency. You can long and short by following the indications below:
GREEN LABEL = LONG
RED LABEL = SHORT
DIP noted on chart
This system write on chart with "DIP" text whenever a decrease of price/selloff occour, usually a good place to make attention if you are looking for a trade.
This is possible with the use of Bbands that helped me on this add.
Below some timeframes examples.
5 minute chart
15 minute chart
1H timeframe chart
4H timeframe chart
Below ETH USD 4H timeframe chart for reference.
----------------------------------
I hope you like and enjoy.
Good trading traders!
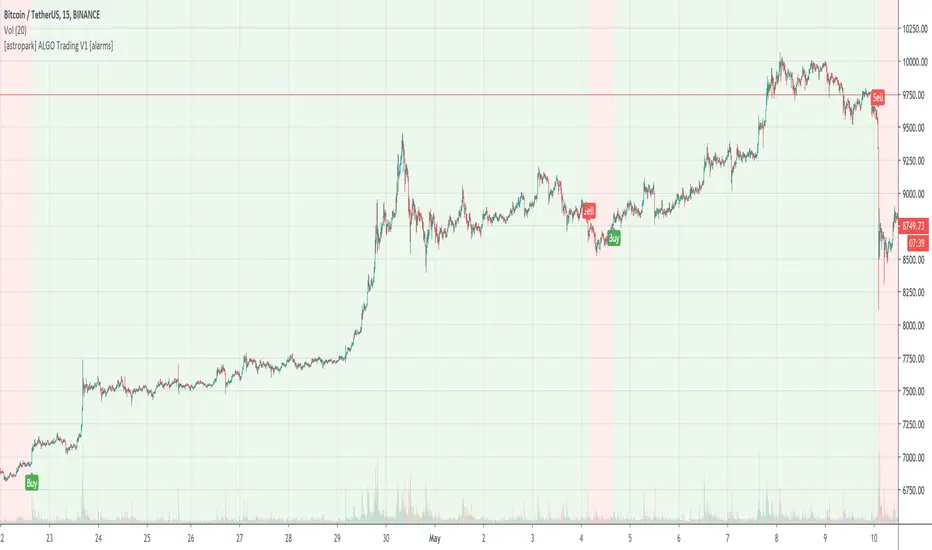
[astropark] ALGO Trading V3 [alarms]Dear Followers,
today another awesome Swing and Scalping Trading Strategy indicator, runnable on a bot , which works great on many timeframes (from 1h and above is suggested), just write me in order to help you find correct settings).
It must be said that this strategy works even better on 1m Renko chart!
If you are a scalper or you are a swing trader, you will love suggested entries for fast and long-lasting profit.
Keep in mind that a proper trailing stop strategy and risk management and money management strategies are very important (DM me if you need any clarification on these points).
This is not an evolution of "ALGO Trading V1" or "ALGO Trading V2" , but a twin sister of them.
For your reference, here it is the "ALGO Trading V1" indicator
and here the "ALGO Trading V2"
This strategy has the following options:
enable/disable signals on chart
enable/disable bars and background coloring based on trend
enable/disable a "filter noise" option , which try to reduce overtrading (you can easily check it on backtesting)
enable/disable a Take Profit / Stop Loss option (you can easily check it on backtesting too)
enable/disable a secret SmartOption which may improve profit on your chart (again, check it on you chart if it helps or not)
This strategy only trigger 1 buy or 1 sell. If you enable Take Profit / Stop Loss option, consider that many TP can be triggered before trend reversal, so take partial profit on every TP an eventually buy/sell back lower/higher to maximize your profit.
This script will let you set all notifications you may need in order to be alerted on each triggered signals.
The one for backtesting purpose can be found by searching for the astropark's "ALGO Trading V3" and then choosing the indicator with "strategy" suffix in the name, or you can find here below
Strategy results are calculated on the time window from 1995 to now, so on more than 15 years, using 1000$ as initial capital and working at 1x leverage (so no leverage at all! If you like to use leverage, be sure to use a safe option, like 3x or 5x at most in order to have liquidation price very far).
This is not the "Holy Grail", so use a proper risk management strategy.
This script will let you backtest how the indicator will perform on any chart and timeframe you may like to test and/or trade. Of course results will be very different depending on the chart and timeframe you will open. I tested a lot of charts and always you can find a combination that keep this strategy in profit on swing trading style (and this means that if you can have a daily look at the chart you can always manage to maximize your profit on each trade!)
This is a premium indicator , so send me a private message in order to get access to this script.

[astropark] ALGO Trading V2 [alarms]Dear Followers,
today another awesome Swing and Scalping Trading Strategy indicator, runnable on a bot , which works great on many timeframes (ones between 1h and 1D are suggested, but just write me in order to help you find correct settings).
It must be said that this strategy works even better on 1m Renko chart!
If you are a scalper or you are a swing trader, you will love suggested entries for fast and long-lasting profit.
Keep in mind that a proper trailing stop strategy and risk management and money management strategies are very important (DM me if you need any clarification on these points).
This is not an evolution of "ALGO Trading V1" or "ALGO Trading V3" , but a twin sister of them. Search them on TradingView to know them better.
Here you can find ALGO Trading V1
This strategy has the following options:
enable/disable signals on chart
enable/disable bars and background coloring based on trend
enable/disable a "filter noise" option , which try to reduce overtrading (you can easily check it on backtesting)
enable/disable a Take Profit / Stop Loss option (you can easily check it on backtesting too)
enable/disable a secret SmartOption which may improve profit on your chart (again, check it on you chart if it helps or not)
This strategy only trigger 1 buy or 1 sell. If you enable Take Profit / Stop Loss option, consider that many TP can be triggered before trend reversal, so take partial profit on every TP an eventually buy/sell back lower/higher to maximize your profit.
This script will let you set all notifications you may need in order to be alerted on each triggered signals.
The one for backtesting purpose can be found by searching for the astropark's "ALGO Trading V2" and then choosing the indicator with "strategy" suffix in the name, or you can find here below
Strategy results are calculated on the time window from January 2018 to now, so on more than 2 years, using 1000$ as initial capital and working at 1x leverage (so no leverage at all! If you like to use leverage, be sure to use a safe option, like 3x or 5x at most in order to have liquidation price very far).
This is not the "Holy Grail", so use a proper risk management strategy.
This is a premium indicator , so send me a private message in order to get access to this script.

[astropark] ALGO Trading V1 [alarms]Dear Followers,
today another awesome Swing and Scalping Trading Strategy indicator, runnable on a bot , which works great on Low Timeframes (1h is suggested) but also on even lower ones (till 15m) and on higher ones (no further than 1D), just write me in order to help you find correct settings).
It must be said that this strategy works even better on 1m Renko chart!
If you are a scalper or you are a swing trader, you will love suggested entries for fast and long-lasting profit.
Keep in mind that a proper trailing stop strategy and risk management and money management strategies are very important (DM me if you need any clarification on these points).
This is not an evolution of "ALGO Trading V2" or "ALGO Trading V3" , but a twin sister of them. Search them on TradingView to know them better.
This strategy has the following options:
enable/disable signals on chart
enable/disable bars and background coloring based on trend
enable/disable a "filter noise" option , which try to reduce overtrading (you can easily check it on backtesting)
enable/disable a Take Profit / Stop Loss option (you can easily check it on backtesting too)
enable/disable a secret SmartOption which may improve profit on your chart (again, check it on you chart if it helps or not)
This strategy only trigger 1 buy or 1 sell. If you enable Take Profit / Stop Loss option, consider that many TP can be triggered before trend reversal, so take partial profit on every TP an eventually buy/sell back lower/higher to maximize your profit.
This script will let you set all notifications you may need in order to be alerted on each triggered signals.
The one for backtesting purpose can be found by searching for the astropark's "ALGO Trading V1" and then choosing the indicator with "strategy" suffix in the name, or you can find here below
Strategy results are calculated on the time window from January 2019 to now, so on more than 1 year, using 1000$ as initial capital and working at 1x leverage (so no leverage at all! If you like to use leverage, be sure to use a safe option, like 3x or 5x at most in order to have liquidation price very far).
This is not the "Holy Grail", so use a proper risk management strategy.
This is a premium indicator , so send me a private message in order to get access to this script.
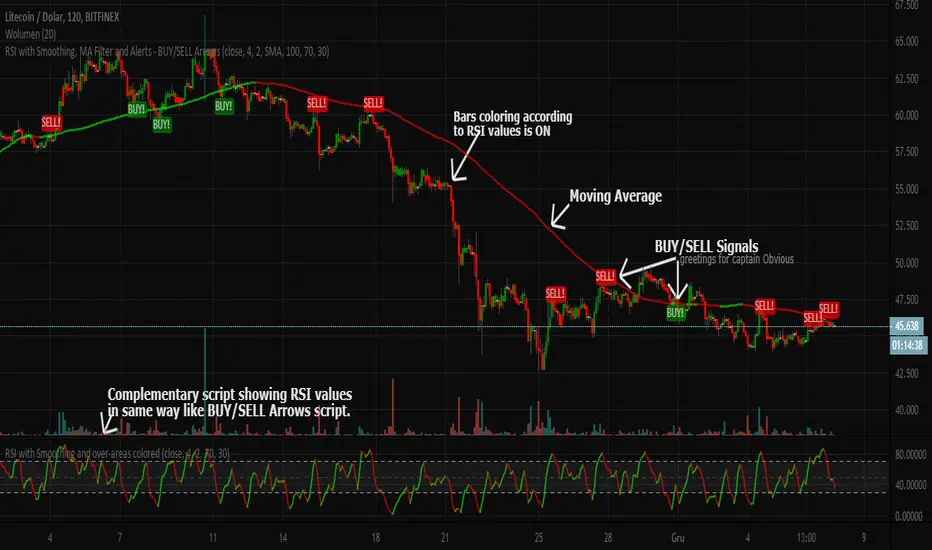
RSI with Smoothing, MA Filter and Alerts - BUY/SELL ArrowsEnglish description:
Here you have kind of better RSI (with smoothing) that can improve your decision-making process when you would like to trade.
Script has the following characteristics:
- Candles colorization
- RSI length
- RSI smoothing
- Moving Average Filter
- Moving Average to choose between: SMA and EMA
- Few differents methods of BUY/SELL signals to choose from and combine together
- Possibility to set Upper/Lower bands for over-bought/sold areas
This BUY/SELL Arrows script is invite-only for the members of our trading group (info in signature).
If you would like to have the oscillator visible on chart above, here is the complementary script:
Polish description:
Niniejszy skrypt, dzięki nieco ulepszonym wskaźniku RSI (z opcją wygładzenia jego linii sygnałowej) ma za zadanie wspomóc proces decyzyjny przy zakładaniu pozycji na giełdzie.
Możliwości są następujące:
- Kolorowanie świec na wykresie zgodnie z kierunkiem danych ustaleń wskaźnika RSI
- Długość/okres RSI
- Wygładzenie RSI
- Filtrowanie sygnałów Średnią Kroczącą
- Wybór pomiędzy dwoma rodzajami średnich kroczących: SMA i EMA
- Kilka różnych metod generowania sygnałów KUPNA/SPRZEDAŻY, które można włączać/wyłączać lub łączyć razem
- Możliwość ręcznego ustawienia domyślnych wartości górnej i dolnej bandy wskaźnika RSI, czyli stref wykupienia/wyprzedania.
Skrypt jest publikowany na zasadzie invite-only(zasada przydzielania dostępu na TradingView), a zatem dostępny jest tylko dla aktywnych użytkowników naszej grupy traderskiej, do której link można znaleść w mojej sygnaturze poniżej.
Jeśli chciałbyś również mieć na wykresie oscylator widoczny w oknie powyżej, tutaj jest odnośnik do skryptu uzupełniającego:
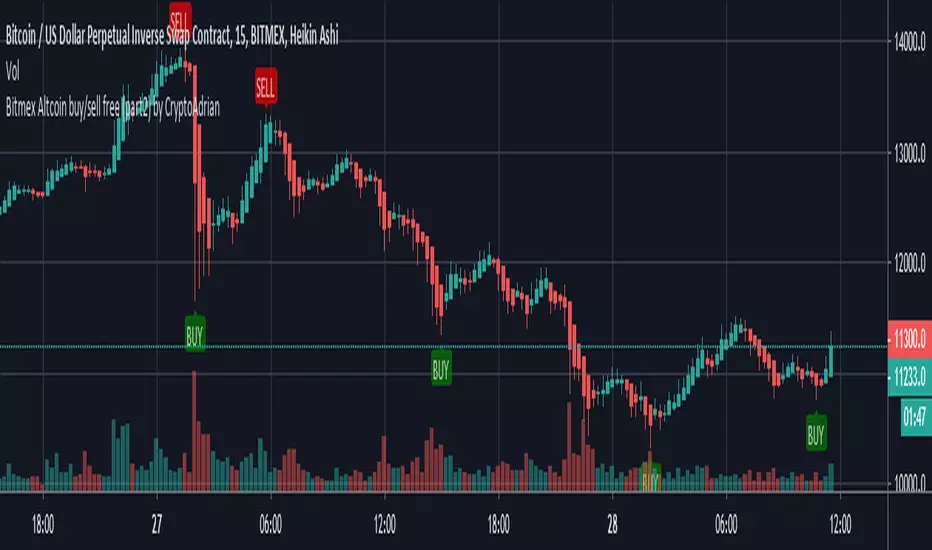
Bitmex Altcoin buy/sell free (part2) by CryptoAdrianThis script has two parts Bitmex Altcoin buy/sell free (part1) by CryptoAdrian and Bitmex Altcoin buy/sell free (part2) by CryptoAdrian
Combination of two will give you better results with clarification.
(soon will be published as one script)
For better results observe it for some time. If you didn't get how to use it PM me I will brief you :)
Hope you will like this. For any detail or doubts you can PM me on TV. I will try to reach you out ASAP .
Part-1
Part-2
Part-1 + Part-2
Please add this script to your fav so incase you find it difficult to find it can be seen in your fav and you will get it.
Thank You and happy trading :)

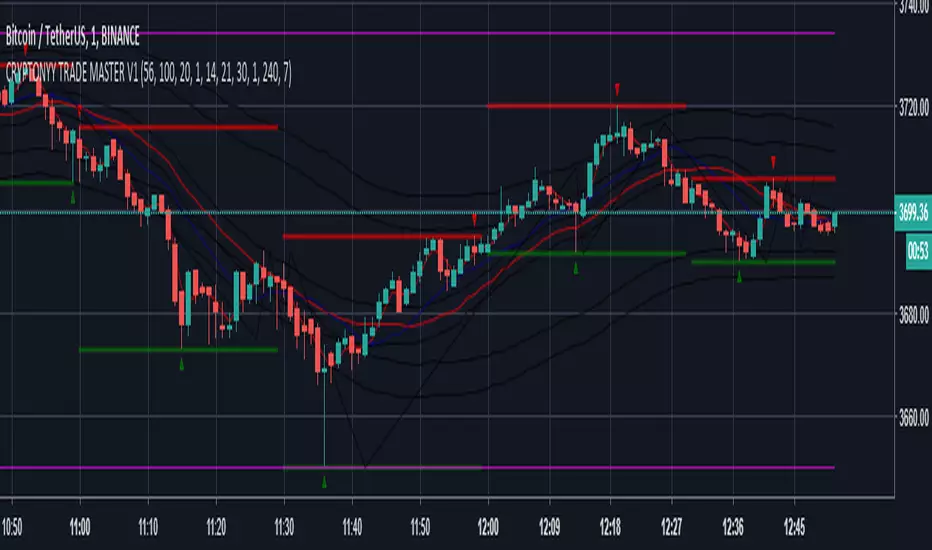
CRYPTONYY TRADE MASTER V1THIS SCRIPT IS ONLY MADE FOR BITMEX TRADERS.
IT WORKS ON 1MINUTE TIMEFRAME SMOOTHLY.
ADVANTAGES:
1. AUTO BUY/SELL SIGNALS.
2. 95% ACCURACY.
3. U WILL NEVER BE IN LOSS BECAUSE WE DEVELOPED THIS WITH OUR PERSONAL VOLATILITY INDICATOR.SO IF MARKET GOES OPPOSITE IT WILL GIVE U THE SIGNAL BEFORE YOUR LAST ENTRY PRICE.
4. DOUBLE CROSS INDICATOR.
5. MUCH VOLATILE=INCREASE THE SIGNAL ACCURACY.
6. 1MINUTE TIMEFRAME IS BEST TO TRADE WITH THIS SOFTWARE.
THOSE WHO WANT TO BUY THIS OR WANT DEMO COMMENT BELOW,I WILL MESSAGE YOU.