חפש סקריפטים עבור "camarilla"

Camarilla Pivot Points V2 Backtest Camarilla pivot point formula is the refined form of existing classic pivot point formula.
The Camarilla method was developed by Nick Stott who was a very successful bond trader.
What makes it better is the use of Fibonacci numbers in calculation of levels.
Camarilla equations are used to calculate intraday support and resistance levels using
the previous days volatility spread. Camarilla equations take previous day’s high, low and
close as input and generates 8 levels of intraday support and resistance based on pivot points.
There are 4 levels above pivot point and 4 levels below pivot points. The most important levels
are L3 L4 and H3 H4. H3 and L3 are the levels to go against the trend with stop loss around H4 or L4 .
While L4 and H4 are considered as breakout levels when these levels are breached its time to
trade with the trend.
WARNING:
- For purpose educate only
- This script to change bars colors.

Camarilla Pivot Points V2 Strategy Camarilla pivot point formula is the refined form of existing classic pivot point formula.
The Camarilla method was developed by Nick Stott who was a very successful bond trader.
What makes it better is the use of Fibonacci numbers in calculation of levels.
Camarilla equations are used to calculate intraday support and resistance levels using
the previous days volatility spread. Camarilla equations take previous day’s high, low and
close as input and generates 8 levels of intraday support and resistance based on pivot points.
There are 4 levels above pivot point and 4 levels below pivot points. The most important levels
are L3 L4 and H3 H4. H3 and L3 are the levels to go against the trend with stop loss around H4 or L4 .
While L4 and H4 are considered as breakout levels when these levels are breached its time to
trade with the trend.
WARNING:
- For purpose educate only
- This script to change bars colors.
Camarilla Pivot Points V2 Camarilla pivot point formula is the refined form of existing classic pivot point formula.
The Camarilla method was developed by Nick Stott who was a very successful bond trader.
What makes it better is the use of Fibonacci numbers in calculation of levels.
Camarilla equations are used to calculate intraday support and resistance levels using
the previous days volatility spread. Camarilla equations take previous day’s high, low and
close as input and generates 8 levels of intraday support and resistance based on pivot points.
There are 4 levels above pivot point and 4 levels below pivot points. The most important levels
are L3 L4 and H3 H4. H3 and L3 are the levels to go against the trend with stop loss around H4 or L4 .
While L4 and H4 are considered as breakout levels when these levels are breached its time to
trade with the trend.
WARNING:
- For purpose educate only


Camarilla PivotsA slimmed down/cleaner version of the "Pivot Points Standard" indicator. This is for Camarilla pivots only. The S and R pivots are renamed to L/H and the colors of pivot 1 and 2 are faded out by default since those pivots are less used in the Camarilla trading system. They can also be disabled of course.

Camarilla screenerBasic script to screen up to 10 tickers with regards to their central pivot range and camarilla pivots.
Same color layout as the Danarilla script ().
The colors in the screener mean the following:
Blue : bar close price is > H4 or < L4
Red : bar close price is < H3 and > CPR top
Fuchsia : bar close price is < CPR top and > CPR bottom
Green : bar close price is < CPR bottom and > L3
No color means it is between H4/H3 or L3/L4
Resolution can be changed for the calculation of the pivots.
Script contains snippets from other screeners and the Danarilla script so many thanks to all who publish their scripts.
Camarilla Strategy - breakouts of H4 and L4Breakout strategy of H4 and L4 levels. Manual entries and exits - higher profits BUT because I am a novice in pinescript,
Can someone please:
1. Show me how to add exit strategy lines : close> ema(close,3) for exit short and opposite for long. I added myself but I can't make it to work in relation to camarilla entries; instead it shows all ema crossings..
2.Why some entries over/above my pivots are not shown.. Example:11.15 AM (short) and 13.10 PM (long) AAPL, October 15, today? Today would've been 3 signals, not one..
Thank you in advance for any advice. I am a strong Camarilla follower, but I am not a coder.
Waddah Attar Weekly Camarilla Pivots [Loxx]Waddah Attar Weekly Camarilla Pivots is an indicator built by Ahmad Waddah Attar that draws weekly Camarilla over lower timeframes.
What are Camarilla pivots?
Camarilla Pivot Points is a math-based price action analysis tool that generates potential intraday support and resistance levels. Similar to classic pivot points, it uses the previous day's high price, low price, and closing price.
Camarilla Pivot Points is a modified version of the classic Pivot Point. Camarilla Pivot Points were introduced in 1989 by Nick Scott, a successful bond trader. The basic idea behind Camarilla Pivot Points is that price has a tendency to revert to its mean until it doesn’t. What makes it different than the classic pivot point formula is the use of Fibonacci numbers in its calculation of pivot levels. Camarilla Pivot Points is a math-based price action analysis tool that generates potential intraday support and resistance levels.
Details
-Used for intraday trading to identify support/resistance levels
-Restricted to timeframes 4 hours and below
-Unlike most versions of Weekly Camarilla Pivots, this version allows you to customize the Fibonacci levels

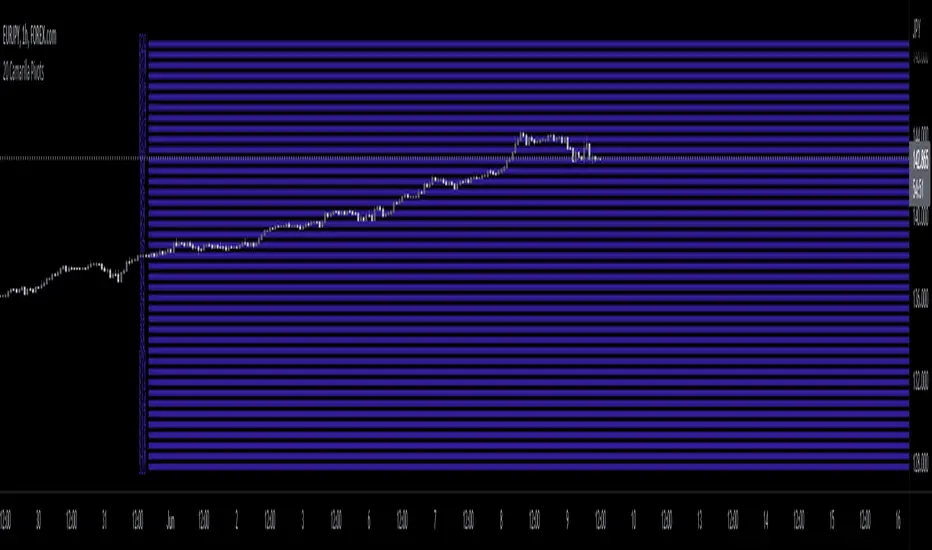
20 Camarilla Pivot PointsThis indicator plots 20 Camarilla pivot points above and below the pivot based on the selected time frame. This is useful when price goes between the standard 3 and 4 pivots and above 4. Note that the normal 4 pivot point is labeled as 6 in this indicator. You can change the color of each set of pivots so you can mark the standard Camarilla pivots if you wish. The image is using monthly Camarilla pivots on a 1 hour time frame.
VPTbollfib & Camarilla (Danarilla)I do not own the original indicators. This is just a combination of the two because of their nature to work in a similar way.
Camarilla Pivots run on the basis of intraday range trading. Usually after daily open you look the fade whatever move happened before. by shorting R3/H3 levels or longing R3/L3. Targeting the other side of the range. This is the infamous PivotBoss level calculations and you would want to activate camarilla and turn off the normal pivots. They use the previous days volatility to plot the next days levels.
But what about some confirmation?
Well RafaelIzoni (who made it open source for improvement) threw together this VPTbollfib. It is volume price trend crossing down a fib line using bollinger bands as price envelope. The beauty of this is that It will signal usually counter to current price action based on selling into uptrends or vise versa. Meaning you get signals to counter price. Which is what you might be looking for on range day trade scalps for camarilla. A wick reversal or engulfing + volume based signal is a very happy pairing together. And those signals are usually suitable for the target of the range you are day trading. Hourly time frame works quite well for both. And camarilla should also be on daily settings.
Special Thanks to Nanda (who published the pivotboss indicator AND) Helped to merge the scripts together.
This indicator alone is an entire trade system. Camarilla already is. If you know the rules. it can be used for entries, exits, risk management to trade the range on TREND, COUNTER TREND, and BREAKOUT plays. The bollinger band fibs add confirmation to the trends levels. And the VPT adds a secondary confirmation to take a camarilla trade.
Try it out. I think you will find both the levels on camarilla and the VPT signals quite suprising.

CamarillaStrategy -V1 - H4 and L4 breakout - exits addedExits added using trailing stops.
2.6 Profit Factor and 76% Profitable on SPY , 5M - I think it's a pretty good number for an automated strategy that uses Pivots. I don't think it's possible to add volume and day open price in relation to pivot levels -- that's what I do manually ..
Still trying to add EMA for exits.. it will increase profitability. You can play in pinescript with trailing stops entries..

CPR, Camarilla & Moving AverageThis script is created primarily for Intraday trading but can also be used for short and long term trading. This is a combination of Central Pivot Range (CPR), Moving Averages and Camarilla Pivot levels (with inner levels). This helps you to combine the strategies of CPR and Moving Averages to identify the best trading opportunities with greater edge. Central Pivot Range and Camarilla pivots are taken from PivotBoss by Franc Ochoa.
Key features:
# Daily CPR levels
# Weekly CPR levels
# Monthly CPR levels
# Previous Day High and Lows
# Previous Week Highs and Lows
# Previous Month Highs and Lows
# Camarilla Pivots with inner Levels
# CPR Levels for the next Day, Week and Month
# 5 Simple moving averages and 5 Exponential Moving Averages
What separates this script from other scripts with CPR and Moving averages?
# One of the few indicators (if not the only one) which combines the 2 types of Moving Averages, CPR and also Camarilla Pivots.
# CPR Levels for not just the next Day, but for next Week(Weekly CPR) and Month(Monthly CPR) also.
# Hide the previous day's levels according to your wish. This is the most unique feature of this indicator. You can set the number of Daily CPR levels you want to load in the chart. This is not just for the Daily CPR but also for the Weekly and Monthly CPR also. This makes the chart less cluttered and prevents the candles from getting buried in the indicators. Please notice how the previous day's CPR levels are hidden in the displayed demo chart on the script page. In the chart, only one trading day's data is shown(by default).
# This script is OPEN SOURCE.
Strategies :
For CPR & Camarilla Strategies for intraday trading and swing trading refer to the book 'Secrets of a Pivot Boss: Revealing Proven Methods for Profiting in the Market' by Franklin O. Ochoa.
Moving averages strategies :
Moving averages can be combined and also used individually for several strategies
* 9 EMA can be used as trailing stop loss for strong moving trends that helps you to catch big moves.
* 20sma can be used not just trailing stop loss but also for taking re-entry to the trend.
* Golden cross - The golden cross occurs when a short-term moving average crosses over a major long-term moving average to the upside. This indicates a bullish turn in the market. Eg: 50 SMA cuts 200 SMA from below.
* Death Cross - The death cross occurs when the short term moving average crosses the long-term average from above. This indicates a bearish turn in the market. Eg: 50 SMA cuts 200 SMA from above.
* When 20 SMA is above 50 SMA and 20 SMA and 50 SMA are angling up like parallel lines, then it denotes bullish strength. If this happens right after Golden Cross, big moves to the upside can be expected.
* When 20 SMA is below 50 SMA and 20 SMA and 50 SMA are angling down like parallel lines, then it denotes bearish strength. If this happens right after Death Cross, big moves to the downside can be expected.
* When 20SMA and 50 SMA are going flat and crossing each other, then it denotes sideways sentiment.
Moving average strategies are taken from the book 'How to Make Money in Intraday Trading' by Ashwani Gujral. For learning more about how to combine CPR and Moving averages in your trading please refer to this book.

Camarilla Levels Pro Camarilla Levels Pro – Precision Intraday & Swing Trading Tool
Unlock the full potential of Camarilla Pivot Levels for identifying high-probability reversal zones, breakout triggers, and intraday bias shifts.
This indicator automatically calculates L1–L5 levels based on the Camarilla formula, updating daily for precise market adaptation. Whether you’re trading futures, forex, stocks, or crypto, you’ll instantly see:
Reversal Zones – Where price historically reacts and traps traders.
Breakout Zones – L4/L5 for bullish breakouts, L3/L2 for bearish reversals.
Bias Shifts – Quickly gauge if the market is leaning long or short.
Custom Alerts – Get notified when price touches or breaks your chosen level.
Features:
Auto-adjusting Camarilla levels for any symbol & timeframe
Color-coded zones for instant visual recognition
Optional mid-levels for scalpers
Fully customizable styling to match your chart setup
Ideal for:
Day traders wanting precision entry/exit zones
Swing traders watching key daily pivot breaks
Scalpers looking for high-probability reaction points
Combined MTF Camarilla Pivots (HA + Candles)This is a fairly basic (but hopefully useful) indicator that combines three time-frames of Camarilla pivots into one.
Default time-frames are:
Weekly
Monthly
Yearly
Time-frames can be modified as you wish, they are just set to these as I generally only trade higher intervals (just note that formatting labels will not change - but you can update these as needed).
The Camarilla pivots displayed are as follows:
R3, R4, R5, R6
Pivot line (Middle/Base)
S3, S4, S5, S6
R1/S1 & R2/S2 are excluded to make way for R5/S5 & R6/S6 - as these are more useful for the majority of traders. The formula for levels 5/6 are always up for debate, as no official formula has ever been released. I've used what I consider a mid, or consensus calculation.
By default all historical pivot levels are displayed, as there can be some benefit to mapping these forward once the relevant period has ended. If people find it's too cluttered I'll look into having an option to display the current period only.
Unfortunately, TradingView doesn't allow labels on plots (seems like such a basic feature to be missing, but there you go), so you'll have to learn the colours/linewidths.
Oh, and there's a checkbox to enable pivots to be calculated on Heiken-Ashi prices/candles rather than default prices/candles. This heavily modifies the location of the Camarilla Pivots, but I've found that in certain situations you can get some great results.
Let me know your thoughts/comments/suggestions.
Cheers
DD

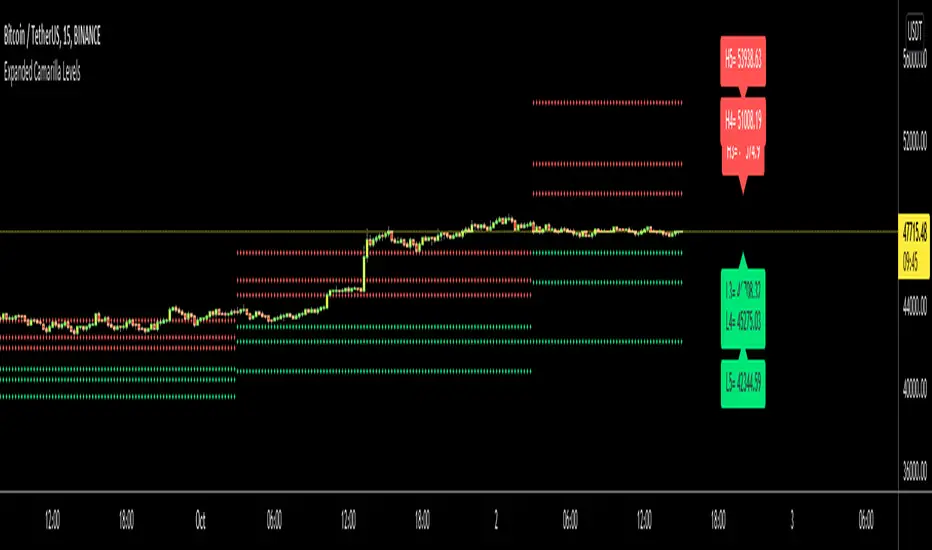
Expanded Camarilla LevelsHello Everyone,
The Expanded Camarilla Level s is introduced in the book " Secrets of a Pivot Boss: Revealing Proven Methods for Profiting in the Market " by Franklin Ocho a. I will not write a lot about the book, you should read it for yourself. There are many great ideas in the book, such using these levels, following trend, time price opportunity, Advanced Camarilla Concepts and much more.
The definition/formula of the levels defined in the book. ( actualy L1, L2, H1 and H2 levels are not used in the strategy, so not shown on the chart )
RANGE = highhtf - lowhtf
H5 = (HIGH/ LOW) * CLOSE
H4 = CLOSE + RANGE * 1.1/2
H3 = CLOSE+ RANGE * 1.1/4
H2 = CLOSE+ RANGE * 1.1/6
H1 = CLOSE+ RANGE * 1.1/12
L1 = CLOSE- RANGE * 1.1/12
L2 = CLOSE- RANGE * 1.1/6
L3 = CLOSE- RANGE * 1.1/4
L4 = CLOSE- RANGE * 1.1/2
L5 = CLOSE- (H5 - CLOSE)
Levels:
Strategy: you need to take care of the candles, as you can see there is bearish candle on first part, and Bullish Candle on second part!
Another Strategy:
An Example:
ENJOY!
D, W, M_CPR + Camarilla + Value Area _ By SoumyaAll in one pivot points of combined D, W, M CPR, Camarilla & Value area. Inspired by Pivotboss book.

PivotBoss Pivots & Camarilla - H,D,W, M timeframe & OHLC LabelsThis is the new pivotboss pivots calculations and also has Camarilla Pivots . User can define which time frame pivots they want to see starting from Hourly, Daily, weekly and monthly. Added labels for each levels. So that user can calculate potential profit targets. This script also includes Hourly and Daily OHLC with labels. Added Developing mid point of the current day. The script can calculate midpoint as and when new highs and lows are made through out the day
Abbrevations used in this script
yHI - Yesterday's session High
dOP - Days open
yCL - yesterday's session Close
yLO - yesterday's session Low
MP -- Developing midpoint of the day
TC - Top channel
P - Pivot Point
BC - Bottom Channel
R1 - R4 -- Resistance levels
S1 - S4 -- Support Levels

camarilla - Daily,Weekly,Monthly by Ganeshcamarilla - Daily,Weekly,Monthly levels in one chart for support and resitance

Camarilla Pivots + 20 EMA StrategyThis is an intraday volatility and trend-following system for commodities like Natural Gas, combining dynamic pivot levels (Camarilla) with a trend filter (20-period EMA) to improve risk-reward and reduce false breakouts.
Core Components
1. Camarilla Pivots:
These are special support and resistance levels (H3, H4, L3, L4) calculated each day based on the previous day's high, low, and close.
The pivots adapt to daily volatility, giving more relevant breakout and bounce zones than static lines.
H4: Aggressive resistance (used for breakout LONG entry)
H3: Moderate resistance/support (used for bounce or stoploss)
L4: Aggressive support (used for breakout SHORT entry)
L3: Moderate support/resistance (used for bounce or stoploss)
2. 20 EMA (Exponential Moving Average):
Plotted on the 30-minute chart, this acts as a trend filter.
If the price is above 20 EMA: Only look for long trades (bullish bias).
If below 20 EMA: Only look for short trades (bearish bias).
How the Strategy Works
Setup (30-Min Chart):
Camarilla pivots for the day are drawn on the chart.
20 EMA is also plotted.
Trade Filter:
Bullish: Trade ONLY if price is above 20 EMA.
Bearish: Trade ONLY if price is below 20 EMA.
Entry:
LONG: Enter when price breaks and closes above the H4 pivot AND is above 20 EMA.
SHORT: Enter when price breaks and closes below the L4 pivot AND is below 20 EMA.
Stop Loss:
LONG: Place stoploss at H3 (the next lower Camarilla resistance).
SHORT: Place stoploss at L3 (the next higher Camarilla support).
Target:
Always set a profit target at 2x the distance (risk) between entry and stoploss (strict R:R 2).
For example, if your entry is at H4 and stoploss at H3, your target is entry + 2*(entry - stoploss).
Alerts & Visuals:
The strategy plots entry arrows, stoploss and target lines for immediate visual reference.
Alerts trigger on breakout signals so you never miss a trade.
Why This Works Well for Natural Gas
Adapts to volatility: The pivots change daily, handling wide-ranging and choppy price moves better than fixed breakouts.
Trend filter: EMA prevents counter-trend whipsaws, only trades with market momentum.
Risk control: Every trade must meet strict risk-reward criteria, so losses are contained and winners can outweigh losers.

Camarilla Pivot Plays█ OVERVIEW
This indicator implements the Camarilla Pivot Points levels and a system for suggesting particular plays. It only calculates and shows the 3rd, 4th, and 6th levels, as these are the only ones used by the system. In total, there are 12 possible plays, grouped into two groups of six. The algorithm constantly evaluates conditions for entering and exiting the plays and indicates them in real time, also triggering user-configurable alerts.
█ CREDITS
The Camarilla pivot plays are defined in a strategy developed by Thor Young, and the whole system is explained in his book "A Complete Day Trading System" . The indicator is published with his permission, and he is a user of it. The book is not necessary in order to understand and use the indicator; this description contains sufficient information to use it effectively.
█ FEATURES
Automatically draws plays, suggesting an entry, stop-loss, and maximum target
User can set alerts on chosen ticker to call these plays, even when not currently viewing them
Highly configurable via many options
Works for US/European stocks and US futures (at least)
Works correctly on both RTH and ETH charts
Automatically switches between RTH and ETH data
Optionally also shows the "other" set of pivots (RTH vs ETH data)
Configurable behaviour in the pre-market, not active in the post-market
Configurable sensitivity of the play detection algorithm
Can also show weekly and monthly Camarilla pivots
Well-documented options tooltips
Sensible defaults which are suitable for immediate use
Well-documented and high-quality open-source code for those who are interested
█ HOW TO USE
The defaults work well; at a minimum, just add the indicator and watch the plays being called. To avoid having to watch securities, by selecting the three dots next to the indicator name, you can set an alert on the indicator and choose to be alerted on play entry or exit events—or both. The following diagram shows several plays activated in the past (with the "Show past plays" option selected).
By default, the indicator draws plays 5 days back; this can be changed up to 20 days. The labels can be shifted left/right using the "label offset" option to avoid overlapping with other labels in this indicator or those of another indicator.
An information box at the top-right of the chart shows:
The data currently in use for the main pivots. This can switch in the pre-market if the H/L range exceeds the previous day's H/L, and if it does, you will see that switch at the time that it happens
Whether the current day's pivots are in a higher or lower range compared to the previous day's. This is based on the RTH close, so large moves in the post-market won't be reflected (there is an advanced option to change this)
The width of the value relationship in the current day compared to the previous day
The currently active play. If multiple plays are active in parallel, only the last activated one is shown
The resistance pivots are all drawn in the same colour (red by default), as are the support pivots (green by default). You can change the resistance and support colours, but it is not possible to have different colours for different levels of the same kind. Plays will always use the correct colour, drawing over the pivots. For example, R4 is red by default, but if a play treats R4 as a support, then the play will draw a green line (by default) over the red R4 line, thereby hiding it while the play is active.
There are a few advanced parameters; leave these as default unless you really know what they do. Please note the script is complicated—it does a lot. You might need to wait a few seconds while it (re)calculates on new tickers or when changing options. Give it time when first loading or changing options!
█ CONCEPTS
The indicator is focused around daily Camarilla pivots and implements 12 possible plays: 6 when in a higher range, 6 when in a lower range. The plays are labelled by two letters—the first indicates the range, the second indicates the play—as shown in this diagram:
The pivots can be calculated using only RTH (Regular Trading Hours) data, or ETH (Extended Trading Hours) data, which includes the pre-market and post-market. The indicator implements logic to automatically choose the correct data, based on the rules defined by the strategy. This is user-overridable. With the default options, ETH will be used when the H/L range in the previous day's post-market or current day's pre-market exceeds that of the previous day's regular market. In auto mode, the chosen pivots are considered the main pivots for that day and are the ones used for play evaluation. The "other" pivots can also be shown—"other" here meaning using ETH data when the main pivots use RTH data, and vice versa.
When displaying plays in the pre-market, since the RTH open is not yet known (and that value is needed to evaluate play pre-conditions), the pre-market open is used as a proxy for the RTH open. After the regular market opens, the correct RTH open is used to evaluate play conditions.
█ NOTE FOR FUTURES
Futures always use full ETH data in auto mode. Users may, however, wish to use the option "Always use RTH close," which uses the 3 p.m. Central Time (CME/Chicago) as a basis for the close in the pivot calculations (instead of the 4 p.m. actual close).
Futures don't officially have a pre-market or post-market like equities. Let's take ES on CME as an example (CME is in Chicago, so all times are Central Time, i.e., 1 hour behind Eastern Time). It trades from 17:00 Sunday to 16:00 Friday, with a daily pause between 16:00 and 17:00. However, most of the trading activity is done between 08:30 and 15:00 (Central), which you can tell from the volume spikes at those times, and this coincides with NYSE/NASDAQ regular hours (09:30–16:00 Eastern). So we define a pseudo-pre-market from 17:00 the previous day to 08:30 on the current day, then a pseudo-regular market from 08:30 to 15:00, then a pseudo-post-market from 15:00 to 16:00.
The indicator then works exactly the same as with equities—all the options behave the same, just with different session times defined for the pre-, regular, and post-market, with "RTH" meaning just the regular market and "ETH" meaning all three. The only difference from equities is that the auto calculation mode always uses ETH instead of switching based on ETH range compared to RTH range. This is so users who just leave all the defaults are not confused by auto-switching of the calculation mode; normally you'll want the pivots based on all the (ETH) data. However, both "Force RTH" and "Use RTH close with ETH data" work the same as with equities—so if, in the calculations, you really want to only use RTH data, or use all ETH H/L data but use the RTH close (at 15:00), you can.
█ LIMITATIONS
The pivots are very close to those shown in DAS Trader Pro. They are not to-the-cent exact, but within a few cents. The reasons are:
TradingView uses real-time data from CBOE One, so doesn't have access to full exchange data (unless you pay for it in TradingView), and
the close/high/low are taken from the intraday timeframe you are currently viewing, not daily data—which are very close, but often not exactly the same. For example, the high on the daily timeframe may differ slightly from the daily high you'll see on an intraday timeframe.
I have occasionally seen larger than a few cents differences in the pivots between these and DAS Trader Pro—this is always due to differences in data, for example a big spike in the data in TradingView but not in DAS Trader Pro, or vice versa. The more traded the stock is, the less the difference tends to be. Highly traded stocks are usually within a few cents. Less traded stocks may be more (for example, 30¢ difference in R4 is the highest I've seen). If it bothers you, official NYSE/NASDAQ data in TradingView is quite inexpensive (but even that doesn't make the 8am candle identical).
The 6th Camarilla level does not have a standard definition and may not match the level shown on other platforms. It does match the definition used by DAS Trader Pro.
The indicator is an intraday indicator (despite also being able to show weekly and monthly pivots on an intraday chart). It deactivates on a daily timeframe and higher. It is untested on sub-minute timeframes; you may encounter runtime errors on these due to various historical data referencing issues. Also, the play detection algorithm would likely be unpredictable on sub-minute timeframes. Therefore, sub-minute timeframes are formally unsupported.
The indicator was developed and tested for US/European stocks and US futures. It may or may not work as intended for stocks and futures in different locations. It does not work for other security types (e.g., crypto), where I have no evidence that the strategy has any relevance.

Camarilla Pivot Points L3/4 D/W with Labels AlertsThis version of the camarilla pivot points will provide daily or weekly S3, S4, R3 and R4 Levels.
This release is intended to help you declutter your charts by not having too many lines but still getting the benefit of clearly seeing where the key camarilla levels are, which can help with identifying market structure and potential market extremes.
It has the option to show or hide the lines to help unclutter your charts.
The lines can also be hidden by the user line transparency input, in which case the values will still appear on the scale.
It comes with a cross label for each pivot point that can be offset horizontally by user input. Per the screenshot, the intention is to have these labels adjacent to the right axis to clearly idenfity the pivot levels.
It also has alerts for each pivot point level
Camarilla Fibonachi Breakout Indicator with AlertsThis Script can be used for Intraday Only.
This Script will Plot the following Lines in the Chart
1. VWAP (Colour will be ploted as per the following condition)
VWAP Line will Plotted in Green if Open Price is Greater Than Close
VWAP Line will Plotted in Red if Open Price is Less Than Close
2. VWMA (VWMA Period used 14)
3. Atr Trailing Stoploss
(ATR Period 5, ATR Multiplier 2.5 is used to plot the Lines)
4. 15 Min High Low of the day will be plotted as dotted Purple lines
5. H4 as BuyAbove Level
6. H3 as Buy Stop Loss Level
7. H5 as Buy Target 1 Level
8. H6 as Buy Target 2 Level
9. H7 as Buy Target 3 Level
10. H8 as Buy Target 4 Level
11. H9 as Buy Bonus 1 Level
12. H10 as Buy Bonus 2 Level
13. H11 as Buy Bonus 3 Level
14. H12 as Buy Bonus 4 Level
15. L4 as Sell Below Level
16. L3 as Sell Stop Loss Level
17. L5 as Sell Target 1 Level
18. L6 as Sell Target 2 Level
19. L7 as Sell Target 3 Level
20. L8 as Sell Target 4 Level
21. L9 as Sell Bonus 1 Level
22. L10 as Sell Bonus 2 Level
23. L11 as Sell Bonus 3 Level
24. L12 as Sell Bonus 4 Level
This script will generate Buy signal on he following condition
1.Close Must be Greater than H4
if Calculate Inside Camarilla is Enabled then the Script will check whether Yesterdays H4 is Less than Todays H4
2.Close Must be Greater than VWAP
3.Volume Must be Greater Than 20 Period Simple Moveing Average
4.Buy Signal will be Displayed only Once for a Day.
This script will generate Sell signal on he following condition
1.Close Must be Less than L4
if Calculate Inside Camarilla is Enabled then the Script will check whether Yesterdays L4 is Less than Todays L4
2.Close Must be Less than VWAP
3.Volume Must be Greater Than 20 Period Simple Moveing Average
4.Sell Signal will be Displayed only Once for a Day.
and the Alert Message will be Generated for Buy and Sell