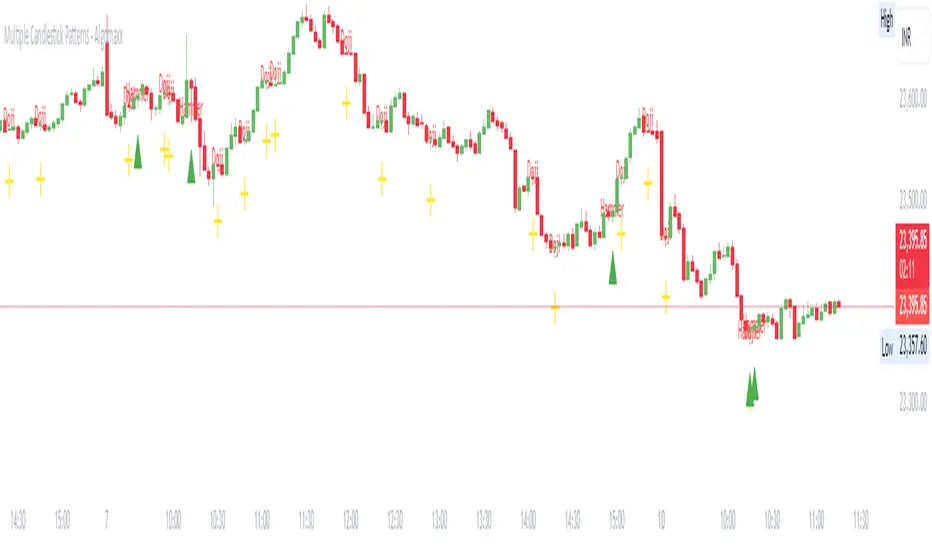
Multiple Candlestick Patterns - AlgomaxxA comprehensive candlestick pattern detection indicator that identifies seven major Japanese candlestick patterns in real-time. This indicator helps traders identify potential reversal and continuation patterns with customizable visual alerts and labels.
Features
Detects 7 major candlestick patterns:
Doji
Hammer
Shooting Star
Bullish Engulfing
Bearish Engulfing
Morning Star
Evening Star
Color-coded candlesticks for easy pattern identification
Customizable pattern indicators above/below candles
Optional pattern labels with adjustable position
Alert conditions for each pattern
Grouped settings for easy customization
Settings
General Settings
Lookback Period: Number of candles to analyze (default: 20)
Body Size Threshold: Minimum relative size for candle body (default: 0.6)
Pattern Settings
Toggle visibility for each pattern type:
Doji Pattern
Hammer Pattern
Shooting Star Pattern
Bullish Engulfing Pattern
Bearish Engulfing Pattern
Morning Star Pattern
Evening Star Pattern
Label Settings
Show Labels: Toggle pattern labels on/off
Label Text Color: Customize label color
Label Position: Choose between Left/Center/Right alignment
Label Offset: Adjust distance of labels from candles
Pattern Descriptions
Doji: Shows indecision when open and close prices are very close
Yellow color
Cross symbol below candle
Hammer: Potential bullish reversal with long lower shadow
Green color
Triangle up symbol below candle
Shooting Star: Potential bearish reversal with long upper shadow
Red color
Triangle down symbol above candle
Bullish Engulfing: Bullish reversal pattern where current green candle completely engulfs previous red candle
Light green color
Triangle up symbol below candle
Bearish Engulfing: Bearish reversal pattern where current red candle completely engulfs previous green candle
Light red color
Triangle down symbol above candle
Morning Star: Three-candle bullish reversal pattern
Seafoam green color
Triangle up symbol below candle
Evening Star: Three-candle bearish reversal pattern
Pink red color
Triangle down symbol above candle
How to Use
Add the indicator to your chart
Customize the settings based on your preferences:
Enable/disable specific patterns you want to monitor
Adjust label settings for better visibility
Set up alerts for patterns you want to be notified about
Pattern Recognition:
Watch for color changes in candlesticks indicating pattern formation
Look for shape indicators above/below candles
Read pattern labels for quick pattern identification
Trading Suggestions:
Use in conjunction with other technical indicators
Consider overall trend and support/resistance levels
Confirm patterns with volume and price action
Wait for pattern completion before making trading decisions
Tips
Patterns work best when used with multiple timeframes
Combine with trend lines and support/resistance levels
Use volume to confirm pattern strength
Consider market context and overall trend
Larger timeframes typically produce more reliable signals
Use alerts to avoid missing important pattern formations
Disclaimer
This indicator is for informational and educational purposes only. No guarantee is made regarding the accuracy of pattern detection or potential future price movements. Always use proper risk management and consider multiple factors before making trading decisions.
חפש סקריפטים עבור "candle"
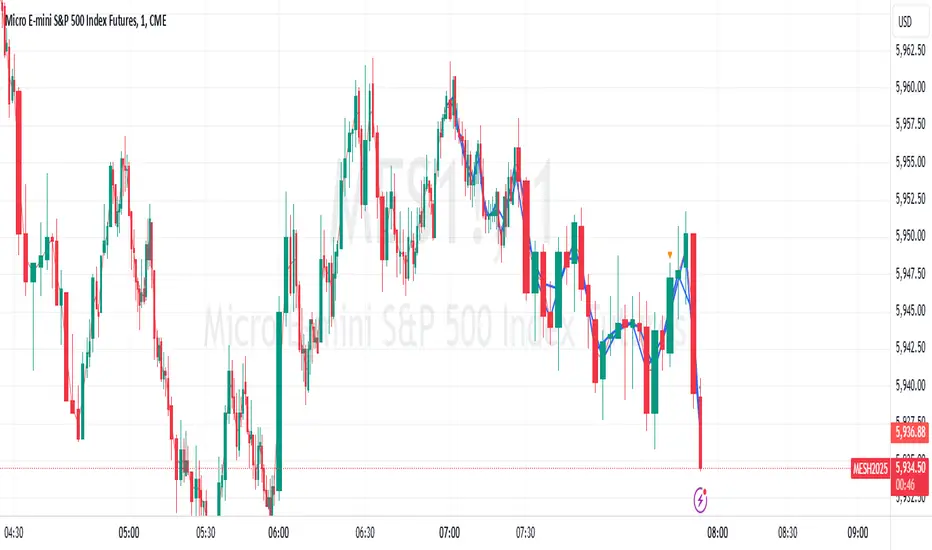
Center of Candle Trendline### **Center of Candle Trendline**
This script dynamically plots a trendline through the center of each candlestick's body. The "center" is calculated as the average of the open and close prices for each candle. The trendline updates in real-time as new candles form, providing a clean and straightforward way to track the market's midline movement.
#### **Features:**
1. **Dynamic Trendline:** The trendline connects the center points of consecutive candlestick bodies, giving a clear visual representation of price movements.
2. **Accurate Center Calculation:** The center is determined as `(open + close) / 2`, ensuring the trendline reflects the true midpoint of each candlestick body.
3. **Real-Time Updates:** The trendline updates automatically as new bars form, keeping your chart up to date with the latest price action.
4. **Customization-Ready:** Adjust the line’s color, width, or style easily to fit your chart preferences.
#### **How to Use:**
- Add this script to your chart to monitor the price movement relative to the center of candlestick bodies.
- Use the trendline to identify trends, reversals, or price consolidation zones.
#### **Applications:**
- **Trend Analysis:** Visualize how the market trends around the center of candlesticks.
- **Reversal Identification:** Detect potential reversal zones when the price deviates significantly from the trendline.
- **Support and Resistance Zones:** Use the trendline as a dynamic support or resistance reference.
This tool is perfect for traders who want a clean and minimalistic approach to tracking price action. Whether you're a beginner or an experienced trader, this script provides valuable insights without overwhelming your chart.
#### **Note:**
This is not a standalone trading strategy but a visual aid to complement your analysis. Always combine it with other tools and techniques for better trading decisions.
---
Feel free to tweak this description based on your preferences or style!
Engulfing Candlestick StrategyEver wondered whether the Bullish or Bearish Engulfing pattern works or has statistical significance? This script is for you. It works across all markets and timeframes.
The Engulfing Candlestick Pattern is a widely used technical analysis pattern that traders use to predict potential price reversals. It consists of two candles: a small candle followed by a larger one that "engulfs" the previous candle. This pattern is considered bullish when it occurs in a downtrend (bullish engulfing) and bearish when it occurs in an uptrend (bearish engulfing).
Statistical Significance of the Engulfing Pattern:
While many traders rely on candlestick patterns for making decisions, research on the statistical significance of these patterns has produced mixed results. A study by Dimitrios K. Koutoupis and K. M. Koutoupis (2014), titled "Testing the Effectiveness of Candlestick Chart Patterns in Forex Markets," indicates that candlestick patterns, including the engulfing pattern, can provide some predictive power, but their success largely depends on the market conditions and timeframe used. The researchers concluded that while some candlestick patterns can be useful, traders must combine them with other indicators or market knowledge to improve their predictive accuracy.
Another study by Brock, Lakonishok, and LeBaron (1992), "Simple Technical Trading Rules and the Stochastic Properties of Stock Returns," explores the profitability of technical indicators, including candlestick patterns, and finds that simple trading rules, such as those based on moving averages or candlestick patterns, can occasionally outperform a random walk in certain market conditions.
However, Jorion (1997), in his work "The Risk of Speculation: The Case of Technical Analysis," warns that the reliability of candlestick patterns, including the engulfing patterns, can vary significantly across different markets and periods. Therefore, it's important to use these patterns as part of a broader trading strategy that includes other risk management techniques and technical indicators.
Application Across Markets:
This script applies to all markets (e.g., stocks, commodities, forex) and timeframes, making it a versatile tool for traders seeking to explore the statistical effectiveness of the bullish and bearish engulfing patterns in their own trading.
Conclusion:
This script allows you to backtest and visualize the effectiveness of the Bullish and Bearish Engulfing patterns across any market and timeframe. While the statistical significance of these patterns may vary, the script provides a clear framework for evaluating their performance in real-time trading conditions. Always remember to combine such patterns with other risk management strategies and indicators to enhance their predictive power.

TechniTrend: Advance Custom Candle Finder (CCF)🟦 Description:
The TechniTrend: Advanced Custom Candle Finder (CCF) is a versatile tool designed to help traders identify custom candlestick patterns using various configurable criteria. This indicator provides a flexible framework to filter and highlight specific candles based on volume, volatility, candle characteristics, and other important metrics. Below is a detailed explanation of each filter and its customization options:
🟦 Volume-Based Filters
🔸Volume Spike Filter:
Enable filtering based on volume spikes. Use the Volume Spike Multiplier to define what constitutes a significant increase in volume compared to the average. A spike indicates unusually high trading interest.
🔸Volume Range Filter:
Filter candles based on specific volume ranges. Set Minimum Volume and Maximum Volume thresholds to isolate candles with trading volumes within your desired boundaries.
🟦 Candle Body & Wick Filters
🔸Body Size Filter:
Filter candles based on the size of their body. A Body Size Multiplier determines what is considered a large body relative to historical averages.
🔸Body Percentage Filter:
Filter based on the proportion of the body to the entire candle size. Use the Body Percentage Threshold to highlight candles where the body makes up a certain percentage of the total candle range.
🔸Wick-to-Body Ratio Filter:
Identify candles with specific wick-to-body ratios. A higher Wick-to-Body Ratio can indicate indecision or reversals.
🟦 Volatility & Range Filters
🔸Volatility Filter:
Highlight candles based on price changes relative to volume. The Volatility Multiplier sets the threshold for what is considered a volatile candle.
🔸Candle Range Filter:
Filter based on the range (High - Low) of each candle. Use Minimum Candle Range and Maximum Candle Range to specify your desired candle size in points or pips.
🔸Short-Term and Long-Term Volatility Filters:
Analyze volatility over different periods. Enable Short-Term Volatility or Long-Term Volatility filters to compare recent volatility against historical averages, helping you detect sudden market shifts.
🟦 Candle Color & Open/Close Filters
🔸Candle Color Filter:
Filter based on the candle's color. Choose between Bullish (close > open) or Bearish (close < open) to focus on specific market sentiments.
🔸Open/Close Price Range Filter:
Filter based on the difference between the open and close prices. Use Minimum Open/Close Range and Maximum Open/Close Range to specify your acceptable range in price movements.
🟦 Core Functionality
The CCF indicator combines these filters to provide a final signal whenever a candle meets all the enabled criteria. By default, it highlights any qualifying candle directly on the chart and changes the background color for added visibility.
🟦 Key Features:
🔸Highly Customizable Filters: Adjust the parameters for each filter to tailor the indicator to your specific needs.
🔸Multiple Conditions: Combine several conditions to identify complex candlestick patterns.
🔸Real-Time Alerts: Receive instant notifications when a matching candle pattern is found based on your custom criteria.
🟦 How to Use:
🔸Enable the filters you wish to apply (e.g., Volume Spike, Candle Body Size, Volatility).
🔸Adjust the thresholds for each filter to fine-tune the pattern recognition criteria.
🔸Observe the chart to see visual cues for candles that match your specified conditions.
🟦 Notes:
🔸Ensure that you clearly understand each filter’s role. Over-filtering with very strict criteria may reduce the number of signals.
🔸This indicator is designed to be a customizable tool, not providing buy or sell recommendations.
🔸Use in combination with other analysis tools and indicators for the best results.

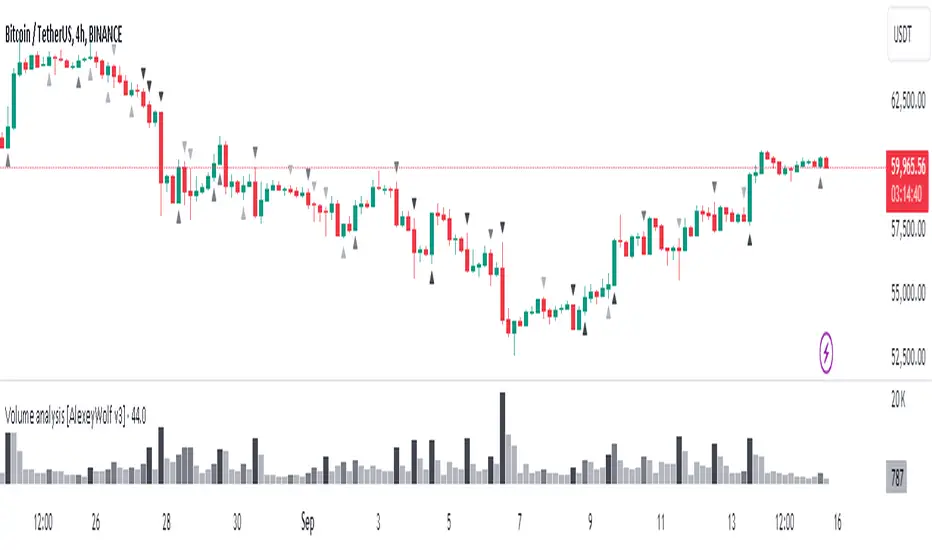
Decoding the Volume of candlesThe indicator is designed for traders who are more interested in market structures and price action using volumes. Volume analysis can help traders build a clearer understanding of zones of buyer and seller interest, as well as liquidity gathering points (traders' stop levels).
Key Features:
The indicator visualizes on the chart the volumes selected according to the trader's chosen settings.
The indicator highlights candle volumes in selected colors, where the volume is greater individually than the volumes of the trader's chosen number of preceding candles. Or the volume that is greater than the sum of volumes of the trader's chosen number of preceding candles.
The indicator mark selected volumes on the chart based on the type of candle. The candle type (1, 2, or 3) is determined by its result (close) relative to other candles.
Volume marked for a type 3 candle draws the trader’s attention to the lack of results from the applied volume compared to the previous candle, indicating potential weakness of the candle’s owner. This is especially important in buyer or seller context areas.
Volume marked for a type 2 candle highlights the presence of results from the applied volume but only relative to the previous candle. In buyer or seller context areas, this can signal weakness of the candle’s owner.
Volume marked for a type 1 candle signals a strong result from the applied volume, indicating potential strength of the candle’s owner.
The marking of volumes can be displayed either on the main chart or on the volume chart, depending on the trader's preference. Colors and symbols for marking can be customized on the Style tab.
Volumes can be filtered on both the volume chart and the main chart according to their marking. This feature can be useful, for example, for traders who don’t work with signs of buyer or seller weakness. In such cases, they can filter out volumes only for type 1 candles.
Good luck exploring the impact of volumes on price behavior!
Candlestick Patterns [NAS Algo]Candlestick Patterns plots most commonly used chart patterns to help and understand the market structure.
Bullish Reversal Patterns:
Hammer:
Appearance: Small body near the high, long lower shadow.
Interpretation: Indicates potential bullish reversal after a downtrend.
Inverted Hammer:
Appearance: Small body near the low, long upper shadow.
Interpretation: Signals potential bullish reversal, especially when the preceding trend is bearish.
Three White Soldiers:
Appearance: Three consecutive long bullish candles with higher closes.
Interpretation: Suggests a strong reversal of a downtrend.
Bullish Harami:
Appearance: Small candle (body) within the range of the previous large bearish candle.
Interpretation: Implies potential bullish reversal.
Bearish Reversal Patterns:
Hanging Man:
Appearance: Small body near the high, long lower shadow.
Interpretation: Suggests potential bearish reversal after an uptrend.
Shooting Star:
Appearance: Small body near the low, long upper shadow.
Interpretation: Indicates potential bearish reversal, especially after an uptrend.
Three Black Crows:
Appearance: Three consecutive long bearish candles with lower closes.
Interpretation: Signals a strong reversal of an uptrend.
Bearish Harami:
Appearance: Small candle (body) within the range of the previous large bullish candle.
Interpretation: Implies potential bearish reversal.
Dark Cloud Cover:
Appearance: Bearish reversal pattern where a bullish candle is followed by a bearish candle that opens above the high of the previous candle and closes below its midpoint.
Continuation Patterns:
Rising Three Methods:
Appearance: Consists of a long bullish candle followed by three small bearish candles and another bullish candle.
Interpretation: Indicates the continuation of an uptrend.
Falling Three Methods:
Appearance: Consists of a long bearish candle followed by three small bullish candles and another bearish candle.
Interpretation: Suggests the continuation of a downtrend.
Gravestone Doji:
Appearance: Doji candle with a long upper shadow, little or no lower shadow, and an opening/closing price near the low.
Interpretation: Signals potential reversal, particularly in an uptrend.
Long-Legged Doji:
Appearance: Doji with long upper and lower shadows and a small real body.
Interpretation: Indicates indecision in the market and potential reversal.
Dragonfly Doji:
Appearance: Doji with a long lower shadow and little or no upper shadow.
Interpretation: Suggests potential reversal, especially in a downtrend.

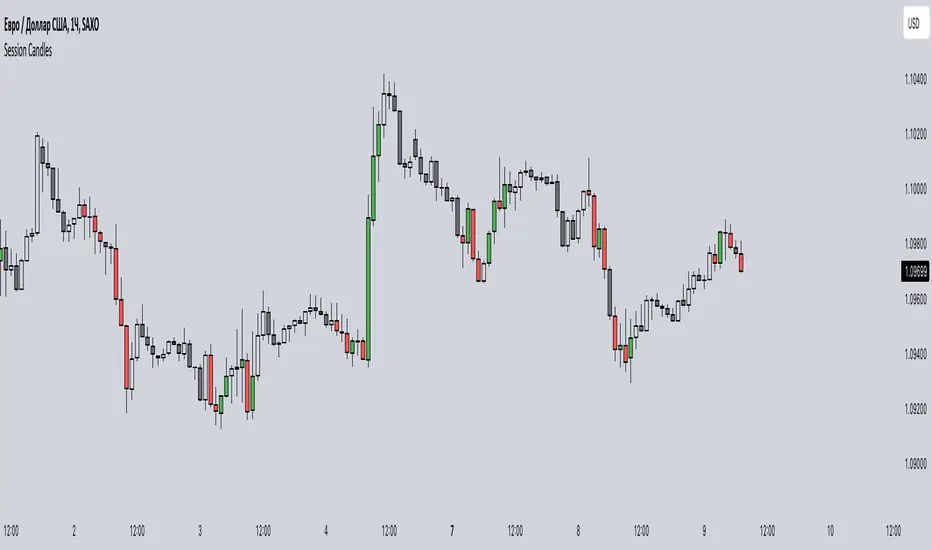
Session CandlesThis indicator is designed to visually represent different trading sessions on a price chart, highlighting candlestick colors to distinguish between bullish (upward movement) and bearish (downward movement) trends during various market sessions. Here's an overview of how the indicator works:
1. Session Definition: The indicator defines four distinct trading sessions:
- London Session: Typically covering the European trading hours.
- New York AM Session: Representing the morning hours of the New York trading session.
- New York PM Session: Representing the afternoon hours of the New York trading session.
- Asia Session: Encompassing the trading hours of the Asian markets.
2. Configuration Options: Users can customize the behavior of the indicator through input options. For each session, users can enable or disable the display of session-specific candles.
3. Candle Coloring: The indicator determines the color of candles based on the following criteria:
- For each session, it checks whether the current candle's closing price is higher than its opening price.
- If the closing price is higher, the candle is considered bullish, and a user-defined green color is used for the candle.
- If the closing price is lower, the candle is considered bearish, and a user-defined red color is applied.
4. Display: The indicator then applies the calculated candle colors to the respective candles of each trading session on the price chart. This visual distinction helps traders quickly identify the prevailing trend during different market sessions.
To use the indicator, traders can overlay it on their price charts in TradingView. By enabling or disabling specific trading sessions, they can focus on the trends and price movements during those specific time periods.
Please note that the actual appearance of the indicator on the chart depends on the user's chosen settings for session enablement and color preferences.
Upper Candle Trends [theEccentricTrader]█ OVERVIEW
This indicator simply plots upper candle trends and should be used in conjunction with my Lower Candle Trends indicator as a visual aid to my Upper and Lower Candle Trend Counter indicator.
█ CONCEPTS
Green and Red Candles
• A green candle is one that closes with a close price equal to or above the price it opened.
• A red candle is one that closes with a close price that is lower than the price it opened.
Upper Candle Trends
• A higher high candle is one that closes with a higher high price than the high price of the preceding candle.
• A lower high candle is one that closes with a lower high price than the high price of the preceding candle.
• A double-top candle is one that closes with a high price that is equal to the high price of the preceding candle.
Lower Candle Trends
• A higher low candle is one that closes with a higher low price than the low price of the preceding candle.
• A lower low candle is one that closes with a lower low price than the low price of the preceding candle.
• A double-bottom candle is one that closes with a low price that is equal to the low price of the preceding candle.
Muti-Part Upper and Lower Candle Trends
• A multi-part higher high trend begins with the formation of a new higher high and continues until a new lower high ends the trend.
• A multi-part lower high trend begins with the formation of a new lower high and continues until a new higher high ends the trend.
• A multi-part higher low trend begins with the formation of a new higher low and continues until a new lower low ends the trend.
• A multi-part lower low trend begins with the formation of a new lower low and continues until a new higher low ends the trend.
█ FEATURES
Plots
Green up-arrows, with the number of the trend part, denote higher high trends. Red down-arrows, with the number of the trend part, denote lower high trends.
█ LIMITATIONS
Some higher timeframe candles on tickers with larger lookbacks such as the DXY , do not actually contain all the open, high, low and close (OHLC) data at the beginning of the chart. Instead, they use the close price for open, high and low prices. So, while we can determine whether the close price is higher or lower than the preceding close price, there is no way of knowing what actually happened intra-bar for these candles. And by default candles that close at the same price as the open price, will be counted as green.

Lower Candle Trends [theEccentricTrader]█ OVERVIEW
This indicator simply plots lower candle trends and should be used in conjunction with my Upper Candle Trends indicator as a visual aid to my Upper and Lower Candle Trend Counter indicator.
█ CONCEPTS
Green and Red Candles
• A green candle is one that closes with a close price equal to or above the price it opened.
• A red candle is one that closes with a close price that is lower than the price it opened.
Upper Candle Trends
• A higher high candle is one that closes with a higher high price than the high price of the preceding candle.
• A lower high candle is one that closes with a lower high price than the high price of the preceding candle.
• A double-top candle is one that closes with a high price that is equal to the high price of the preceding candle.
Lower Candle Trends
• A higher low candle is one that closes with a higher low price than the low price of the preceding candle.
• A lower low candle is one that closes with a lower low price than the low price of the preceding candle.
• A double-bottom candle is one that closes with a low price that is equal to the low price of the preceding candle.
Muti-Part Upper and Lower Candle Trends
• A multi-part higher high trend begins with the formation of a new higher high and continues until a new lower high ends the trend.
• A multi-part lower high trend begins with the formation of a new lower high and continues until a new higher high ends the trend.
• A multi-part higher low trend begins with the formation of a new higher low and continues until a new lower low ends the trend.
• A multi-part lower low trend begins with the formation of a new lower low and continues until a new higher low ends the trend.
█ FEATURES
Plots
Green up-arrows, with the number of the trend part, denote higher low trends. Red down-arrows, with the number of the trend part, denote lower low trends.
█ LIMITATIONS
Some higher timeframe candles on tickers with larger lookbacks such as the DXY , do not actually contain all the open, high, low and close (OHLC) data at the beginning of the chart. Instead, they use the close price for open, high and low prices. So, while we can determine whether the close price is higher or lower than the preceding close price, there is no way of knowing what actually happened intra-bar for these candles. And by default candles that close at the same price as the open price, will be counted as green.

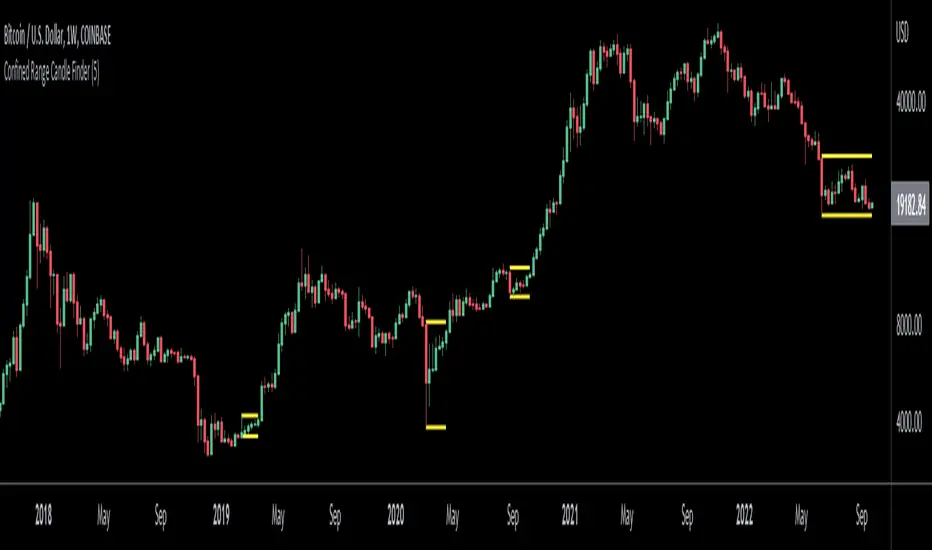
Confined Range Candle FinderThis indicator finds candlesticks which are confined within the range of a previous candlestick. This indicates volatility contraction which often leads to volatility expansion, i.e. large price movements.
While every confined range will contain at least 1 inside bar, this indicator differs from the Inside Bar Finder which only finds consecutive inside bars.
This indicator includes options such as:
- The minimum number of candlesticks confined within the range of a previous candlestick to trigger the indicator
- Labels to indicate the number of confined candles
- Signal lines to indicate the high and low of the containing candlestick
Try out this indicator with different options on different timeframes to see if confined ranges increase the probability of identifying the direction of price movements. Breaks or closes outside signal lines can be used to trigger trade signals.
HTF Candles: 3x Multi-Timeframe Candle Boxes #Pip-Whisperer
- Modify 3 Timeframes to display Candle Boxes over your Chart
- Thats it.
- Enjoy!
- If anyone implements candlestick pattern detection to this before me, please send me link, that would be sick!

MTF Stochastic Zones w/ Candle and Swing Hi/Lo IndicatorsMTF Stochastic Zones w/ Candle and Swing Hi/Lo Indicators by // © KaizenTraderB
This indicator will display the Stochastic RSI as color zones utilizing 3 Timeframes of your choice as well as key reversal candles:
Entry Timeframe StochRSI Crossovers and Long Wick Reversal Candles (Hammer and Hanging Man) and Engulfing Candles
That correlate with Swing Highs and Lows.
When the higher timeframe is bullish it will be green and when bullish, red.
When the middle timeframe is counter the higher, it will appear brownish.
The entry timeframe will print Candle Labels and Swing Highs and Lows at bullish and bearish Stochastic RSI crossovers when oversold and overbought, respectively,
In the direction of the higher timeframe directional bias when the middle timeframe is counter that direction to catch reversals in corrections.
(It also prints Bull/Bear StochRSI Crossovers that correlated with Swing Highs and Lows that are not Hammers, Hanging Men or Engulfing Candles.)
The options allow you to turn the zones, swing highs and lows, candle indicators and entry StochRSI Crossovers on and off, as well as which Timeframes you choose to view.
Entry - 1Hr, 15m, 5m or 1m Middle Timeframe - Daily, 4Hr, 1Hr or 15m Higher Timeframe - Monthly, Weekly, Daily, 4Hr or 1Hr
You can change the Swing High and Low Lookback periods, as well as
The Stochastic RSI Lookback for each of the three timeframes and the level of Overbought and Oversold:
When 8 is chosen for RSI Lookback, Stochastic Lookback = 5, SmoothK = 3, Smooth D = 3 For 13 - 8, 5, 5 For 21 - 13, 8, 8 For 34 - 21, 13, 13
Its good practice to adjust settings so Higher Timeframe zones (green/red) correlate with longer trend movements,
Medium Timeframe with corrections and reversal areas (brown) and Entry Timeframe with key reversal candles.
For example, to adjust the Daily Higher Timeframe, turn the Higher Timeframe to Daily, turn off the others and bring up the Daily Chart.
Look at chart for last 200 bars or so and go through the different settings until you find the one that best correlates with recent past price action.
Do the same procedure for the Middle and Entry Timeframe. Once all the settings are how you prefer, view the Indicator on the Entry Timeframe to find trades.
Coding included to prevent repainting
Can be used in conjunction with the MTF Stochastic RSI w/ Zones which is displayed in the lower panel.
Need the same settings in both indicators for them to correlate or use different settings for different views,
Message me with feedback to improve upon this indicator or requested additions.
I will soon be releasing a Strategy based on this indicator!

M.Right Candlestick Patterns & Bulkowski Percentages 1.0Hello Traders!
As a fan of Bulkowski, I figured I'd release this for everyone's benefit as well.
The legendary candlestick pattern expert, Thomas Bulkowski, has over 35 years of trading and analysis experience and is the absolute go-to expert when it comes to candlestick pattern identification.
Bulkowski Candlestick Percentages from his site and books.
Source: Built in "All Candlestick Patterns"
In this version,
--> Added 8 Candles and removed some that are statistically insignificant and others that Bulkowski doesn't use (can add back if requested).
--> Added 2 Colors for Bullish and Bearish Continuations.
----> Assigned Colors Tested performance to Continuations.
--> Built-in Variables and Candles adjusted slightly to conform to Bulkowski pattern principles.
--> Moved inputs back to ABC order.
--> Decided to leave the theoretical performance positioning for the signal (i.e. Top for theoretically bearish ). However..
----> I adjusted the signal color to match Bulkowski's tested performance.
--> Removed Plot Close (obsolete)
--> Hover over signal to see both Theoretical and Tested Performance.
Figured I'd help give an edge to the @TradingView Community like so many before me have been able to.
Please feel free to add comments, share insight, and of course, like!
Cheers,
Mike

Classic Candlestick on Range ChartHello traders!
This is my first script to share with everyone! As of right now the range candles on Tradingview are lacking the option to see range charts using the classic candlesticks. This script allows you to overlay a regular candlestick or heikin-ashi candlestick on a range chart!! Unfortunately, the only bar that cannot be a candlestick is the current bar. Once that bar has completed its range then it will update to a regular candlestick.
Install / Use instructions!
-For the best visual appearance it is important to set the transparency of up bars and down bars to 0. This setting is found in the main chart settings under SYMBOL. However, if you want to see the current unfinished range bar you need to set the "projection up bars" and "projection down bars" to the color you prefer.
-To change the colors of the candlesticks is found under the indicator settings like any other script!

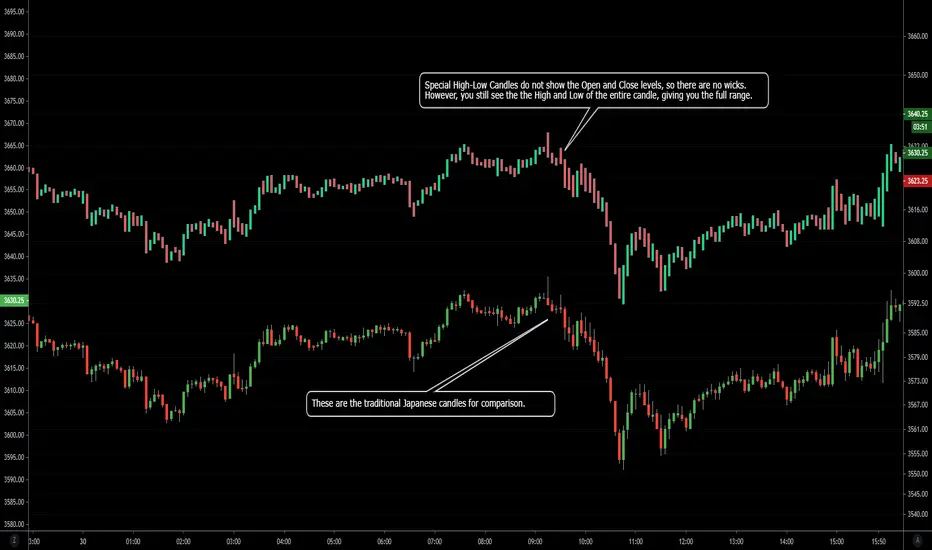
NSDT Special High-Low CandlesThis is an interesting take on candlesticks. These special High-Low Candles do not show the Open and Close levels, so there are no wicks. However, you still see the the High and Low of the entire candle, giving you the full range.
Since this is an indicator, be sure to hide the chart candles to avoid overlap. Or choose offsetting colors to see the traditional candles under the indicator candles.
CFR - Candle Formation RatioDescription
This indicator is designed to detect candles with small bodies and significant wick-to-body ratios, often useful for identifying doji-like structures and potential accumulation areas.
Features
Filter candles by maximum body size (% of the total candle range).
Require that wicks are at least X times larger than the body.
Define the position of the body within the candle (e.g., body must be between 40% and 60% of the candle height).
Visual output: a single arrow marker when conditions are met.
Fully customizable marker color and size.
⚠️ Note: The settings of this version are currently in Turkish. An English version of the settings will be released in the future.

Liquidity Sweep Candlestick Pattern with MA Filter📌 Liquidity Sweep Candlestick Pattern with MA Filter
This custom indicator detects liquidity sweep candlestick patterns—price action events where the market briefly breaks a previous candle’s high or low to trap traders—paired with optional filters such as moving averages, color change candles, and strictness rules for better signal accuracy.
🔍 What is a Liquidity Sweep?
A liquidity sweep occurs when the price briefly breaks the high or low of a previous candle and then reverses direction. These events often occur around key support/resistance zones and are used by institutional traders to trap retail positions before moving the price in the intended direction.
🟢 Bullish Liquidity Sweep Criteria
The current candle is bullish (closes above its open).
The low of the current candle breaks the low of the previous candle.
The candle closes above the previous candle’s open.
Optionally, in Strict mode, it must also close above the previous candle’s high.
Optionally, it can be filtered to only show if the candle changed color from the previous one (e.g., red to green).
Can be filtered to only show when the price is above or below a moving average (if MA filter is enabled).
🔴 Bearish Liquidity Sweep Criteria
The current candle is bearish (closes below its open).
The high of the current candle breaks the high of the previous candle.
The candle closes below the previous candle’s open.
Optionally, in Strict mode, it must also close below the previous candle’s low.
Optionally, it can be filtered to only show if the candle changed color from the previous one (e.g., green to red).
Can be filtered to only show when the price is above or below a moving average (if MA filter is enabled).
⚙️ Features & Customization
✅ Signal Strictness
Choose between:
Less Strict (default): Basic wick break and close conditions.
Strict: Must close beyond the wick of the previous candle.
✅ Color Change Candles Only
Enable this to only show patterns when the candle color changes (e.g., from red to green or green to red). Helps filter fake-outs.
✅ Moving Average Filter (optional)
Supports several types of MAs: SMA, EMA, WMA, VWMA, RMA, HMA
Choose whether signals should only appear above or below the selected moving average.
✅ Custom Visuals
Show short (BS) or full (Bull Sweep / Bear Sweep) labels
Plot triangles or arrows to represent bullish and bearish sweeps
Customize label and shape colors
Optionally show/hide the moving average line
✅ Alerts
Includes alert options for:
Bullish sweep
Bearish sweep
Any sweep
📈 How to Use
Add the indicator to your chart.
Configure the strictness, color change, or MA filters based on your strategy.
Observe signals where price is likely to reverse after taking out liquidity.
Use with key support/resistance levels, order blocks, or volume zones for confluence.
⚠️ Note
This tool is for educational and strategy-building purposes. Always confirm signals with other indicators, context, and sound risk management.

Vector Candles [v6 Optimized + EMA]
Vector Candles represent an innovative technical analysis approach that transforms traditional candlestick charting by integrating volume dynamics, color-coded momentum, and multi-dimensional market insights. Unlike standard candlesticks that merely display price movement, Vector Candles encode additional market information through sophisticated color and volume algorithms.
Key Features:
-Dynamic Volume-Based Coloring: Candles change color based on trading volume intensity
-Volume Categories:
High Volume (Lime/Red): Significant market activity (200%+- Vol of Previous 10 Candles)
Above Average Volume (Blue/Fuchsia): Moderate market momentum (150%+- Vol of Previous 10 Candles).
Normal Volume (Gray Scales): Standard market conditions.
Stopping Volume Candles - Typically Pinbar/Doji candles. Stops volume in the current direction of delivery & can help forecast impending reversals or end to the current trend.
-Integrated EMA (Exponential Moving Average) Option:
-Customizable EMA Length (Default: 50 periods) (I use 33)
Configurable EMA Source (e.g., close price)
Optional EMA Overlay for Trend Confirmation

Big Candles FilterHow It Works
A candle is considered "big" only if its body (distance from open to close) exceeds the barHeight value.
** NOT calculated by Range !!!
Features :
Bullish candles (close > open) are marked with a green "Buy" triangle if the body is large enough.
Bearish candles (close < open) are marked with a red "Sell" triangle if the body is large enough.
The bars are colored for big candles, and optional labels show the open and close prices.

HTF Candle Volume Thermometer [ChartPrime]The HTF Candle Volume Thermometer is a powerful volume heatmap tool that visualizes higher timeframe candle volume distributions directly on the chart. It helps traders identify key price levels where liquidity is concentrated, allowing for more informed trading decisions.
⯁ KEY FEATURES
Higher Timeframe Volume Mapping
Uses higher timeframe (HTF) candles to create a heatmap of volume distribution within each candle.
Dynamic Volume Heatmap
Colors each HTF candle background green for bullish and red for bearish, with a gradient heat overlay highlighting volume concentration.
Max Volume Point Identification
Marks the level within each HTF candle where the highest volume was recorded, using red for the most significant volume area.
Fully Customizable Display
Users can adjust the HTF timeframe, color settings, and resolution to tailor the indicator to their trading preferences.
Segmented Volume Distribution
Each HTF candle is divided into smaller levels, allowing traders to see volume changes within the range of each candle.
Key Level Detection
Max volume points often act as key support and resistance levels where price is likely to react, helping traders refine their strategies.
⯁ HOW TO USE
Identify Liquidity Zones
Use the max volume levels to determine areas where price is likely to find support or resistance.
Assess Trend Strength
Compare volume distribution between bullish and bearish HTF candles to gauge market momentum.
Optimize Trade Entries & Exits
Look for price reactions at high-volume areas to refine stop-loss and take-profit levels.
Adjust Heatmap Resolution
Customize the resolution setting to get a more detailed or broader view of volume segmentation within HTF candles.
⯁ CONCLUSION
The HTF Candle Volume Thermometer is a must-have tool for traders who want to integrate volume analysis with higher timeframe structures. By visualizing volume heatmaps within each HTF candle, this indicator helps traders pinpoint critical liquidity zones and key price levels.

Change Candle Color When 5 EMA Not ConnectedThis custom TradingView indicator changes the color of candlesticks to yellow whenever the 5-period Exponential Moving Average (EMA) is not "connected" to the current candle.
How It Works:
The 5 EMA is calculated based on the closing prices of the last 5 candles.
A candle is considered "not connected" to the EMA if:
The high and low of the current candle are both either above or below the 5 EMA, implying a significant deviation from the EMA.
When this condition is met, the candle color is changed to yellow to highlight this disconnection.
The default behavior of the script is to not display the 5 EMA line, keeping the chart uncluttered while focusing on the candlestick colors.
Usage:
This indicator is useful for scalping or short-term trading strategies, as it helps identify when the price has moved significantly away from the 5 EMA. A yellow candle could signal potential overextension or a possible reversal if the price is far from the EMA. Traders can use this as part of their risk management or entry/exit decision-making process.
Customization:
The indicator doesn't display the 5 EMA line, but you can modify the script to show it if needed by uncommenting the plot(ema5) line.
You can adjust the period of the EMA by modifying the ema5 period in the code, though the default setting is 5 periods.

Fibonacci Candlestick - AYNETHow It Works
Inputs:
ltf_timeframe: Specify the timeframe for candlestick data (e.g., 1H, 4H).
Fibonacci Levels:
Toggle Fibonacci level visibility (show_fib_levels).
Customize Fibonacci line color (fib_color) and width (fib_width).
Candlestick Data:
Fetches open, high, low, and close prices for the specified timeframe using request.security.
Fibonacci Levels:
Calculates standard Fibonacci retracement levels (0.0, 23.6%, 38.2%, 50%, 61.8%, 78.6%, 100%) for each candle's high-low range.
Draws horizontal lines for each level using line.new.
Candlestick Visualization:
Plots lower timeframe candles with customizable bullish and bearish colors.
Key Features
Dynamic Fibonacci Levels:
Fibonacci levels are recalculated for each candlestick's high-low range.
Levels update dynamically with new candles.
Candlestick Overlay:
Visualizes candlestick data from the specified timeframe directly on the current chart.
Customizable Appearance:
Configure colors for Fibonacci levels, candlestick bodies, and wicks.
Use Cases
Microstructure Analysis:
Analyze individual candlesticks with their Fibonacci retracements for potential support/resistance zones.
Multi-Timeframe Trading:
Overlay candlestick and Fibonacci data from a lower timeframe onto a higher timeframe chart.
Let me know if you'd like further enhancements or explanations! 😊

Candle Body Support/Resistance [LuxAlgo]The Candle Body Support/Resistance indicator is a tool that provides Support/Resistance levels from high-volatility candles, a concept originally described by Steve Nison in "Beyond Candlesticks".
Users can define the candle body percentage used to set the detected support/resistance levels. Occurrences of price testing the returned levels are highlighted using user-customizable dots.
🔶 USAGE
Support/Resistance levels are drawn from volatile candles, that is candles having a body (range between opening and closing price) whose magnitude is larger than the Volatility Threshold , which is determined by the multiplicative factor of an ATR (Average True Range) using a user set length.
The level starts from the opening price +/- a percentage of the open-close range. Users can adjust the percentage of the candle body used as support/resistance levels respectively, with higher percentage values returning levels prone to get reached sooner by the price.
A test is considered valid when a wick passes through the Support/Resistance level while the closing price is not breaking it.
Two modes are included, Trailing and Historical , both affecting the displayed elements of the indicator, these are described in the sub-section below.
🔹 Historical
The Historical Mode will draw a separate line from every Volatile Candle . When this line is tested, a dot will be drawn.
In the above example, the red resistance line was tested once until a bullish volatile candle formed, which closed just below the resistance level. The resistance level was tested again, after which the newly created support level was broken quickly, and the price decreased. These levels proved helpful later, acting as resistance/support levels (illustrated by the extra manually drawn dashed white lines).
To prevent cluttering Support/Resistance , lines will be deleted when the line is mitigated and hasn't been tested.
When a Support/Resistance line reaches its Maximum Line Length , it will also be deleted when it has not been tested.
🔹 Trailing
When a new volatile candle of the same type (bullish/bearish) appears while the Support/Resistance isn't broken, this line will be updated with the values of the new volatile candle. This creates a trailing line and a less cluttered chart.
Unlike the Historical mode , a line will not be deleted after a while or when it is mitigated. Instead, the line won't be updated anymore. A new line will start from the next found volatile candle.
Using the same situation as the Historical Mode example, we can note the future significance of old support/resistance levels (illustrated by the extra manually drawn dashed white lines).
The user can switch between these 2 modes, each offering a unique perspective on the market. This provides a more in-depth examination of the market, enhancing the user's trading analysis.
Using a copy of our indicator while using both modes can also be helpful.
🔶 DETAILS
The Support level is the opening price of a bullish volatile candle plus a user-set percentage of the candle's body, while the Resistance level is the opening price of a bearish volatile candle minus a percentage of the candle's body.
The following example illustrates the ATR with the multiplicative factor (Volatility Threshold) where the body of Volatile candles exceeds the ATR limits. Changing the Volatility Threshold and ATR length gives users extra flexibility to adjust to their needs.
🔹 Max Line Length
When using the Historical Mode and the duration of a displayed level reaches the user-set Max Line Length value, the level will return to the last test or be deleted when it has not been tested.
🔶 SETTINGS
Display Mode: Display mode of the indicator.
Support %: Sets the distance of the Support Line from the opening price relative to the candle body.
Resistance %: Sets the distance of the Resistance Line from the opening price relative to the candle body.
🔹 Filter
Length ATR: Amount of bars for the calculation of the Average True Range.
Volatility Threshold: multiplicative factor of ATR.
Max Line Length: Maximum allowed duration/length (in bars) of a Support/Resistance level.
