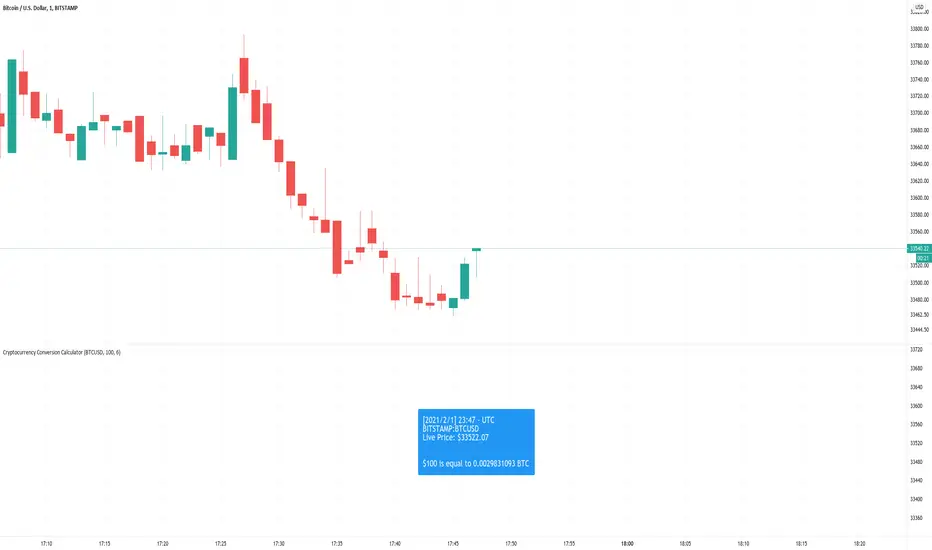
Cryptocurrency Conversion CalculatorA calculator that gives you the amount of a coin that is equal to the inputted value.
Options to configure are the ticker, amount in USD that will be converted, and how many digits you would want to be shown after the decimal point.
Currently, this only supports USD quote currencies. Ideally in the future, the code will be rewritten. Maybe.
חפש סקריפטים עבור "crypto"
Crypto Base TickerAn example of using str.replace_all() function to extract a crypto ticker without its pair.
It can be useful if you didn't know syminfo.basecurrency existed.
I didn't know syminfo.basecurrency exists. Lol

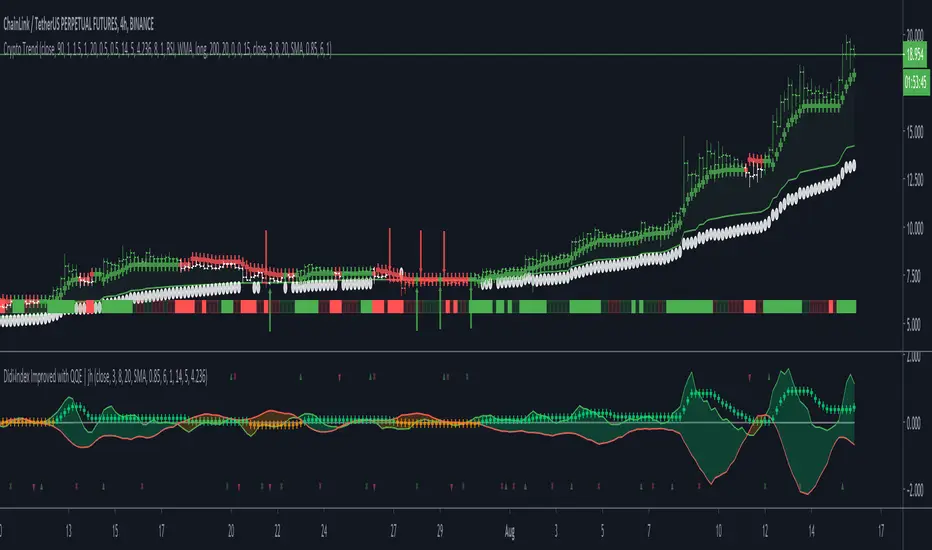
Crypto TrendThis indicator is based off of the Trend Follower system put together by jiehonglim:
This is a trend following system that combines 3 indicators which provide different functionalities, also a concept conceived by VP's No Nonsense FX / NNFX method. I’m primarily modifying this system for Crypto trading (mostly leveraged Crypto Futures). Suggestions/requests welcome.
New Features:
Added position inputs that will generate position labels
For leverage trading, position inputs will calculate your percentage-based stop loss given your entry, leverage and liquidation price
Added optional horizontal line plots for entry, stop loss, 50% take profit and 100% profit levels.
Added non-plotted Didi calculations for alert condition triggers
Added long and short alerts
These alerts will trigger for any of the 3 following conditions:
Baseline cross with volume confirmation
Didi two line cross with volume confirmation
Didi continuation with volume confirmation
1. Baseline
The main baseline filter is an indicator called Modular Filter created by Alex Grover
- www.tradingview.com
- Alex Grover - Modular Filter
-------
That's the moving average like baseline following price, filtering long and short trends and providing entry signals when the price crosses the baseline.
Entry signal indicated with arrows.
2. Volume / Volatility , I will called it Trend Strength
The next indicator is commonly known as ASH, Absolute Strength Histogram.
This indicator was shared by VP as a two line cross trend confirmation indicator, however I discovered an interesting property when I modified the calculation of the histogram.
- Alex Grover Absolute Strength
-------
My modification and other info here
- Absolute Strength Histogram v2
-------
I simplified the display of the trend strength by plotting squares at the bottom of the chart.
- Lighted Squares shows strength
- Dimmed Squares shows weakness
3. Second Confirmation / Exits / Trailing Stop
Finally the last indicator is my usage of QQE (Qualitative Quantitative Estimation), demonstrated in my QQE Trailing Line Indicator
- QQE Trailing Line for Trailing Stop
-------
Three usages of this amazing indicator, serving as :
- Second trend confirmation
- Exit signal when price crosses the trailing line
- Trailing stop when you scaled out the second trade
This indicator is plotted with crosses.
4. Position Calculator
For non-leveraged trades, set leverage to 1 and liquidation to 0
Fill out the rest of the position field to get labels that will tell you:
Your stop loss given your acceptable percentage of loss for your risk. So, for example if your actual investment is $200 and you’re trading on 20X leverage, you’d like to know what price would have to drop to for you to lose 15% of your $200 risk. This is what the position calculator is doing for you.
Your 50% take profit point
Your 100% take profit point
Check the “Show Position Lines” to plot horizontal lines for entry, stop loss, 50% TP and 100%TP
Alerts
You just get a Long Alert or Short Alert option. This was for two reasons, the first and most important was to reduce the number of alerts needed for this system to get maximum coverage. The second was just to keep things simple. Get an alert for your desired direction for any interesting signal and then check the chart manually to determine if a viable entry has presented itself. The three alert conditions are:
Main trend indicator, baseline cross with volume confirmation
Didi two line cross entry with volume confirmation
Didi continuation signal with volume confirmation
Additional plots and information
Bar Color
- Green for longs, Red for shorts, White when the baseline direction conflicts with the QQE trailing line direction
- When it's white, it's usually ranging and not trending, ASH will also keep you off ranging periods.
-------
ATR Filter
- White circles along the baseline, they will show up if the price has moved more than one ATR from the baseline
- The default allowance is 1 ATR.
-------
The previous and current ATR value
- Label on the right side of the chart showing the previous and current value of ATR
Crypto BULL signalThis BULL signal will pop up if the EMAs on the chart are looking bullish and the MACD crosses bullish. Of course it will never be a 100% hit rate, please practice good risk management.

Crypto Prices InfoPanel V2Hello traders
Following the introduction of ByBit to TradingView ByBit on TradingView
I decided to upgrade my previous Bitcoin InfoPanel Bitcoin-Prices-InfoPanel/
Now it's more dynamic (thumbs up) but only work with Bitcoin, Ethereum and Litecoin . If you select any other asset than those 3, the script won't work
This is due to a technical limitation on TradingView because I can't do more than 40 security calls per script
If you don't know what the security function is, here's a reminder : Security documentation . If you don't know what is TradingView... I cannot do anything for you...
Now you can use this panel to have a very cool arbitrage view directly from TradingView and use the info to gamble between brokers (not financial advice)
See you all tomorrow for a huge update regarding the Strategy Builder. I'll show you how to connect it to a Backtest system
____________________________________________________________
Feel free to hit the thumbs up as it shows me that I'm not doing this for nothing and will motivate to deliver more quality content in the future.
- I'm an officially approved PineEditor/LUA/MT4 approved mentor on codementor. You can request a coaching with me if you want and I'll teach you how to build kick-ass indicators and strategies
Jump on a 1 to 1 coaching with me
- You can also hire for a custom dev of your indicator/strategy/bot/chrome extension/python

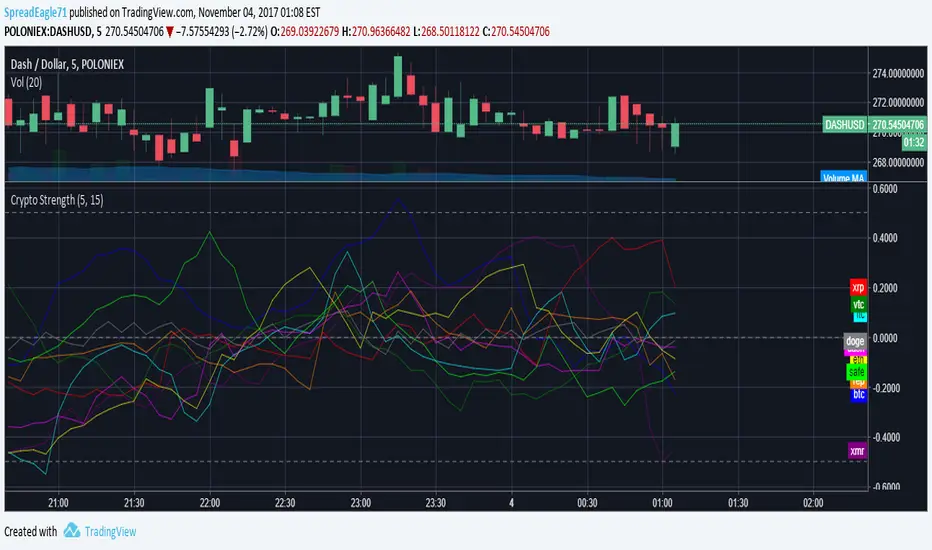
Crypto StrengthThis is a cryptocurrency strength meter based on an earlier post by Glaz who created a strength meter for forex trading.
Its based on the true strength indicator. It is good but not perfect.
May the Force be with you.
-SpreadEagle71
Dominion - Bitcoin Altcoin Dominance [mutantdog]A simple and easy reference tool displaying a plot of the market cap dominance values for several significant cryptocurrencies.
The most widely used of these is bitcoin dominance (the top indicator shown above) which calculates the total market cap of bitcoin in relation to the total cryptocurrency market cap, displayed as a percentage. This is commonly used by traders to assess the strength of bitcoin in relation to the broader crypto market; increasing values being indicative of larger bitcoin moves and decreasing values often indicative of potential altcoin cycles. Likewise, ethereum dominance (the bottom indicator shown above) is frequently used as a means to indicate the strength of ethereum in relation to the broader crypto market.
Included options for marketcap dominance values are:
Bitcoin : CRYPTOCAP:BTC.D
Ethereum : CRYPTOCAP:ETH.D
Total DeFi (a composite of multiple top defi tokens): CRYPTOCAP:TOTALDEFI.D
Stablecoins (shows the combined dominance values for usdt and usdc): CRYPTOCAP:USDT.D + CRYPTOCAP:USDC.D
Flippening (shows the difference between bitcoin and ethereum dominance values): CRYPTOCAP:BTC.D - CRYPTOCAP:ETH.D
When used in combination with each other, these can provide a good overview of the general flow of capital within the crypto market.
Additional functionality:
up to three optional moving averages with a choice of SMA, EMA, WMA and RMA for each.
multi timeframe selector
alert condition presets for various moving average crosses.
Please be aware that, while useful as reference, dominance calculations are known to repaint frequently. As such the use of this indicator and its alerts should require caution.

Degen Dominator - (Crypto Dominance Tool) - [mutantdog]A fairly simple one this time. Another crypto dominance tool, consider it a sequel to Dominion if you will. Ready to go out-of-the-box with a selection of presets at hand.
The premise is straightforward, rather than viewing the various marketcap dominance indexes as their standard percentage values, here we have them represented as basic oscillators. This allows for multiple indexes to be viewed in one pane and gives a decent overview of their relative changes and thus the flow of capital within the overall crypto market. As a general rule-of-thumb, when a plot is above zero then the dominance is climbing, thus capital is likely flowing in that direction. The inverse applies when below zero. When the market is quiet, all will be close to zero. Basic overbought/oversold conditions can also be inferred too.
Active as default are:
Bitcoin (0range): CRYPTOCAP:BTC.D
Ethereum (Blue): CRYPTOCAP:ETH.D
Stablecoins (Red): CRYPTOCAP:USDT.D + CRYPTOCAP:USDC.D
Altcoins (Green): 100 - (all of the above)
These are plotted according to the selected oscillator preset and it's length parameter. The default is set to 'EMA Centre'. An optional RMA(3) smoothing filter is also included and active as default. Each index plot has its own colour and opacity settings available on the main page.
Additionally, the following are also available (deactivated as default):
Total DeFi : CRYPTOCAP:TOTALDEFI.D
Current Symbol : Will try to match corresponding dominance index for the chart symbol if available.
Custom Input : Manual text input, will try to match if available.
-------------
The included presets determine the oscillator type used, all are fairly simple and easy to interpret:
EMA Centre
SMA Centre
Median Centre
Midrange Centre
The first 4 are all variations on the same theme, simply calculated as the difference between the actual value and its respective average. EMA is the default and is my personal preference, if you generally favour using an SMA then perhaps that would be your better choice. Like the two MAs, median and midrange are also dependant on the length parameter. Midrange is calculated from the difference between highest and lowest values within the length period, with a little extra smoothing from an RMA(3).
Simple Delta
Weighted Delta
Running Delta
Often referred to as momentum, delta is just change over time. 'Simple' is the most basic of these, the difference between the current value and the value (length) bars prior. A more long-winded way of calculating this would be to take the difference between each bar and its previous then average them with an SMA which results in the same value. 'Weighted' adopts that principle but instead uses a WMA, likewise 'Running' is the same but using an RMA. The latter is actually the basis of RSI calculations before any normalisation is applied, as you can see in the next preset.
RSI
CMO
RSI really should not need explaining, it is however applied a little differently here to the usual, in this case centred around 0. The x100 multiplication factor has been dropped too for the sake of consistency. The same principle applies with CMO, which is basically a 'Simple Delta' version of RSI.
Hard Floor
Soft Floor
These last two are a little different but both can provide useful interpretations. The floor here is simply the lowest value within the chosen length period. 'Hard' plots the difference between the current value and the floor, thus giving a value that is always above 0. In this case, focus should be given to the relative heights of each with a simple interpretation that capital is flowing into those that are climbing and out of those descending. 'Soft' is essentially the same except that the floor is smoothed with an RMA(3), the result being that when new lows are made, the plot will break below 0 before the floor corrects a few bars later. This soft break provides additional information to that given by 'Hard' so is probably the more useful of the two.
------------
To finish it off, a bunch of preset alerts are included for the various 0 crossings.
So that just about covers everything then, all quite straightforward really. Future updates may include some extra stuff, the composition of the stablecoin index may change if necessary too. While this is not really a tweaker's tool like some of my other projects, there's still some room for experimentation here. The 'current' and 'custom' indexes can provide some useful data for compatible altcoins and the possibility to compare inter-related tokens (eg: Doge vs Shib). While i introduced this as a sort of sequel to Dominion, it is not intended as a replacement but more of a companion. This initially started as a feature intended for that one but it quickly grew into its own thing. Both the oscillator view here and the more traditional view have merits, i personally use this one primarily now but frequently refer to Dominion for confirmations etc.
That's it for now anyway. As always, feedback is welcome below. Enjoy!

Salience Theory Crypto Returns (AiBitcoinTrend)The Salience Theory Crypto Returns Indicator is a sophisticated tool rooted in behavioral finance, designed to identify trading opportunities in the cryptocurrency market. Based on research by Bordalo et al. (2012) and extended by Cai and Zhao (2022), it leverages salience theory—the tendency of investors, particularly retail traders, to overemphasize standout returns.
In the crypto market, dominated by sentiment-driven retail investors, salience effects are amplified. Attention disproportionately focused on certain cryptocurrencies often leads to temporary price surges, followed by reversals as the market stabilizes. This indicator quantifies these effects using a relative return salience measure, enabling traders to capitalize on price reversals and trends, offering a clear edge in navigating the volatile crypto landscape.
👽 How the Indicator Works
Salience Measure Calculation :
👾 The indicator calculates how much each cryptocurrency's return deviates from the average return of all cryptos over the selected ranking period (e.g., 21 days).
👾 This deviation is the salience measure.
👾 The more a return stands out (salient outcome), the higher the salience measure.
Ranking:
👾 Cryptos are ranked in ascending order based on their salience measures.
👾 Rank 1 (lowest salience) means the crypto is closer to the average return and is more predictable.
👾 Higher ranks indicate greater deviation and unpredictability.
Color Interpretation:
👾 Green: Low salience (closer to average) – Trending or Predictable.
👾 Red/Orange: High salience (far from average) – Overpriced/Unpredictable.
👾 Text Gradient (Teal to Light Blue): Helps visualize potential opportunities for mean reversion trades (i.e., cryptos that may return to equilibrium).
👽 Core Features
Salience Measure Calculation
The indicator calculates the salience measure for each cryptocurrency by evaluating how much its return deviates from the average market return over a user-defined ranking period. This measure helps identify which assets are trending predictably and which are likely to experience a reversal.
Dynamic Ranking System
Cryptocurrencies are dynamically ranked based on their salience measures. The ranking helps differentiate between:
Low Salience Cryptos (Green): These are trending or predictable assets.
High Salience Cryptos (Red): These are overpriced or deviating significantly from the average, signaling potential reversals.
👽 Deep Dive into the Core Mathematics
Salience Theory in Action
Salience theory explains how investors, particularly in the crypto market, tend to prefer assets with standout returns (salient outcomes). This behavior often leads to overpricing of assets with high positive returns and underpricing of those with standout negative returns. The indicator captures these deviations to anticipate mean reversions or trend continuations.
Salience Measure Calculation
// Calculate the average return
avgReturn = array.avg(returns)
// Calculate salience measure for each symbol
salienceMeasures = array.new_float()
for i = 0 to array.size(returns) - 1
ret = array.get(returns, i)
salienceMeasure = math.abs(ret - avgReturn) / (math.abs(ret) + math.abs(avgReturn) + 0.1)
array.push(salienceMeasures, salienceMeasure)
Dynamic Ranking
Cryptos are ranked in ascending order based on their salience measures:
Low Ranks: Cryptos with low salience (predictable, trending).
High Ranks: Cryptos with high salience (unpredictable, likely to revert).
👽 Applications
👾 Trend Identification
Identify cryptocurrencies that are currently trending with low salience measures (green). These assets are likely to continue their current direction, making them good candidates for trend-following strategies.
👾 Mean Reversion Trading
Cryptos with high salience measures (red to light blue) may be poised for a mean reversion. These assets are likely to correct back towards the market average.
👾 Reversal Signals
Anticipate potential reversals by focusing on high-ranked cryptos (red). These assets exhibit significant deviation and are prone to price corrections.
👽 Why It Works in Crypto
The cryptocurrency market is dominated by retail investors prone to sentiment-driven behavior. This leads to exaggerated price movements, making the salience effect a powerful predictor of reversals.
👽 Indicator Settings
👾 Ranking Period : Number of bars used to calculate the average return and salience measure.
Higher Values: Smooth out short-term volatility.
Lower Values: Make the ranking more sensitive to recent price movements.
👾 Number of Quantiles : Divide ranked assets into quantile groups (e.g., quintiles).
Higher Values: More detailed segmentation (deciles, percentiles).
Lower Values: Broader grouping (quintiles, quartiles).
👾 Portfolio Percentage : Percentage of the portfolio allocated to each selected asset.
Enter a percentage (e.g., 20 for 20%), automatically converted to a decimal (e.g., 0.20).
Disclaimer: This information is for entertainment purposes only and does not constitute financial advice. Please consult with a qualified financial advisor before making any investment decisions.

VIDYA Trend StrategyOne of the most common messages I get is people reaching out asking for quantitative strategies that trade cryptocurrency. This has compelled me to write this script and article, to help provide a quantitative/technical perspective on why I believe most strategies people write for crypto fail catastrophically, and how one might build measures within their strategies that help reduce the risk of that happening. For those that don't trade crypto, know that these approaches are applicable to any market.
I will start off by qualifying up that I mainly trade stocks and ETFs, and I believe that if you trade crypto, you should only be playing with money you are okay with losing. Most published crypto strategies I have seen "work" when the market is going up, and fail catastrophically when it is not. There are far more people trying to sell you a strategy than there are people providing 5-10+ year backtest results on their strategies, with slippage and commissions included, showing how they generated alpha and beat buy/hold. I understand that this community has some really talented people that can create some really awesome things, but I am saying that the vast majority of what you find on the internet will not be strategies that create alpha over the long term.
So, why do so many of these strategies fail?
There is an assumption many people make that cryptocurrency will act just like stocks and ETFs, and it does not. ETF returns have more of a Gaussian probability distribution. Because of this, ETFs have a short term mean reverting behavior that can be capitalized on consistently. Many technical indicators are built to take advantage of this on the equities market. Many people apply them to crypto. Many of those people are drawn down 60-70% right now while there are mean reversion strategies up YTD on equities, even though the equities market is down. Crypto has many more "tail events" that occur 3-4+ standard deviations from the mean.
There is a correlation in many equities and ETF markets for how long an asset continues to do well when it is currently doing well. This is known as momentum, and that correlation and time-horizon is different for different assets. Many technical indicators are built based on this behavior, and then people apply them to cryptocurrency with little risk management assuming they behave the same and and on the same time horizon, without pulling in the statistics to verify if that is actually the case. They do not.
People do not take into account the brokerage commissions and slippage. Brokerage commissions are particularly high with cryptocurrency. The irony here isn't lost to me. When you factor in trading costs, it blows up most short-term trading strategies that might otherwise look profitable.
There is an assumption that it will "always come back" and that you "HODL" through the crash and "buy more." This is why Three Arrows Capital, a $10 billion dollar crypto hedge fund is now in bankruptcy, and no one can find the owners. This is also why many that trade crypto are drawn down 60-70% right now. There are bad risk practices in place, like thinking the martingale gambling strategy is the same as dollar cost averaging while also using those terms interchangeably. They are not the same. The 1st will blow up your trade account, and the 2nd will reduce timing risk. Many people are systematically blowing up their trade accounts/strategies by using martingale and calling it dollar cost averaging. The more risk you are exposing yourself too, the more important your risk management strategy is.
There is an odd assumption some have that you can buy anything and win with technical/quantitative analysis. Technical analysis does not tell you what you should buy, it just tells you when. If you are running a strategy that is going long on an asset that lost 80% of its value in the last year, then your strategy is probably down. That same strategy might be up on a different asset. One might consider a different methodology on choosing assets to trade.
Lastly, most strategies are over-fit, or curve-fit. The more complicated and more parameters/settings you have in your model, the more likely it is just fit to historical data and will not perform similar in live trading. This is one of the reasons why I like simple models with few parameters. They are less likely to be over-fit to historical data. If the strategy only works with 1 set of parameters, and there isn't a range of parameters around it that create alpha, then your strategy is over-fit and is probably not suitable for live trading.
So, what can I do about all of this!?
I created the VIDYA Trend Strategy to provide an example of how one might create a basic model with a basic risk management strategy that might generate long term alpha on a volatile asset, like cryptocurrency. This is one (of many) risk management strategies that can reduce the volatility of your returns when trading any asset. I chose the Variable Index Dynamic Average (VIDYA) for this example because it's calculation filters out some market noise by taking into account the volatility of the underlying asset. I chose a trend following strategy because regressions are capturing behaviors that are not just specific to the equities market.
The more volatile an asset, the more you have to back-off the short term price movement to effectively trend-follow it. Otherwise, you are constantly buying into short term trends that don't represent the trend of the asset, then they reverse and loose money. This is why I am applying a trend following strategy to a 4 hour chart and not a 4 minute chart. It is also important to note that following these long term trends on a volatile asset exposes you to additional risk. So, how might one mitigate some of that risk?
One of the ways of reducing timing risk is scaling into a trade. This is different from "doubling down" or "trippling down." It is really a basic application of dollar cost averaging to reduce timing risk, although DCA would typically happen over a longer time period. If it is really a trend you are following, it will probably still be a trend tomorrow. Trend following strategies have lower win rates because the beginning of a trend often reverses. The more volatile the asset, the more likely that is to happen. However, we can reduce risk of buying into a reversal by slowly scaling into the trend with a small % of equity per trade.
Our example "VIDYA Trend Strategy" executes this by looking at a medium-term, volatility adjusted trend on a 4 hour chart. The script scales into it with 4% of the account equity every 4-hours that the trend is still up. This means you become fully invested after 25 trades/bars. It also means that early in the trade, when you might be more likely to experience a reversal, most of your account equity is not invested and those losses are much smaller. The script sells 100% of the position when it detects a trend reversal. The slower you scale into a trade, the less volatile your equity curve will be. This model also includes slippage and commissions that you can adjust under the "settings" menu.
This fundamental concept of reducing timing risk by scaling into a trade can be applied to any market.
Disclaimer: This is not financial advice. Open-source scripts I publish in the community are largely meant to spark ideas that can be used as building blocks for part of a more robust trade management strategy. If you would like to implement a version of any script, I would recommend making significant additions/modifications to the strategy & risk management functions. If you don’t know how to program in Pine, then hire a Pine-coder. We can help!

EulerMethod: CryptoCapEN
Shows the cryptocurrency market capitalization balance for the period
Initial data
Bitcoin Capitalization - CRYPTOCAP: BTC
Altcoin Capitalization - CRYPTOCAP: TOTAL2
Money circulates from fiat to bitcoin, from bitcoin to altcoins, from altcoins to fiat
This indicator applies the RSI algorithm to changes in capitalization
The divergence of indices shows an imbalance
Balance level: 0, Maximum: +100, Minimum: -100
(!) Artifacts of indicator readings may occur due to incorrect input data
RU
Показывает баланс капитализации крипторынка за период
Исходные данные
Капитализация Биткоина — CRYPTOCAP:BTC
Капитализация Альткоинов — CRYPTOCAP:TOTAL2
Деньги циркулируют из фиата в биткоин, из биткоина в альткоины, из альткоинов в фиат
В этом индикаторе применяется алгоритм RSI к изменениям капитализации
Расхождения индексов показывают дисбаланс
Балансовый уровень: 0, Максимум: +100, Минимум: -100
(!) Могут возникать артефакты показаний индикатора из-за неправильных исходных данных

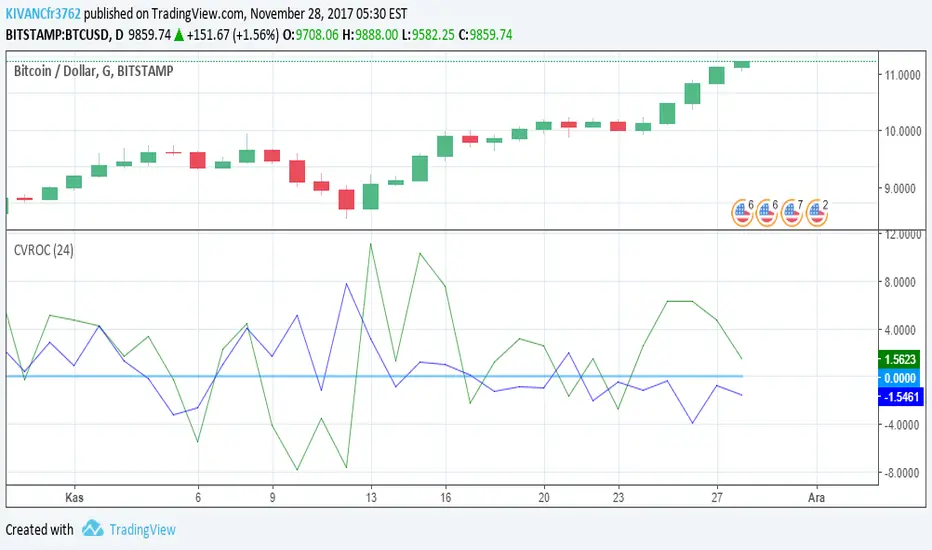
CVROC - Close Volume Rate Of ChangeIndicator designed for cryptotraders to understand whether if the price change is supported by the volume or not
deafult value os SMA of volume is 21 periods
which can be optimized by the user
WEEKEND BOX (FRIDAY 17:00 - SUNDAY 18:00 NY)As the name “Weekend Box” suggests, this indicator highlights the price range of cryptocurrencies between Friday 17:00 and Sunday 18:00 (New York time). It draws a box around this period to visualize how Bitcoin and other crypto assets behave while the forex market is closed. The goal is to provide a simple, educational tool for anyone interested in studying weekend volatility and market behavior in crypto. Thank you.

On-Chain Signals [LuxAlgo]The On-Chain Signals indicator uses fundamental blockchain metrics to provide traders with an objective technical view of their favorite cryptocurrencies.
It uses IntoTheBlock datasets integrated within TradingView to generate four key signals: Net Network Growth, In the Money, Concentration, and Large Transactions.
Together, these four signals provide traders with an overall directional bias of the market. All of the data can be visualized as a gauge, table, historical plot, or average.
🔶 USAGE
The main goal of this tool is to provide an overall directional bias based on four blockchain signals, each with three possible biases: bearish, neutral, or bullish. The thresholds for each signal bias can be adjusted on the settings panel.
These signals are based on IntoTheBlock's On-Chain Signals.
Net network growth: Change in the total number of addresses over the last seven periods; i.e., how many new addresses are being created.
In the Money: Change in the seven-period moving average of the total supply in the money. This shows how many addresses are profitable.
Concentration: Change in the aggregate addresses of whales and investors from the previous period. These are addresses holding at least 0.1% of the supply. This shows how many addresses are in the hands of a few.
Large Transactions: Changes in the number of transactions over $100,000. This metric tracks convergence or divergence from the 21- and 30-day EMAs and indicates the momentum of large transactions.
All of these signals together form the blockchain's overall directional bias.
Bearish: The number of bearish individual signals is greater than the number of bullish individual signals.
Neutral: The number of bearish individual signals is equal to the number of bullish individual signals.
Bullish: The number of bullish individual signals is greater than the number of bearish individual signals.
If the overall directional bias is bullish, we can expect the price of the observed cryptocurrency to increase. If the bias is bearish, we can expect the price to decrease. If the signal is neutral, the price may be more likely to stay the same.
Traders should be aware of two things. First, the signals provide optimal results when the chart is set to the daily timeframe. Second, the tool uses IntoTheBlock data, which is available on TradingView. Therefore, some cryptocurrencies may not be available.
🔹 Display Mode
Traders have three different display modes at their disposal. These modes can be easily selected from the settings panel. The gauge is set by default.
🔹 Gauge
The gauge will appear in the center of the visible space. Traders can adjust its size using the Scale parameter in the Settings panel. They can also give it a curved effect.
The number of bars displayed directly affects the gauge's resolution: More bars result in better resolution.
The chart above shows the effect that different scale configurations have on the gauge.
🔹 Historical Data
The chart above shows the historical data for each of the four signals.
Traders can use this mode to adjust the thresholds for each signal on the settings panel to fit the behavior of each cryptocurrency. They can also analyze how each metric impacts price behavior over time.
🔹 Average
This display mode provides an easy way to see the overall bias of past prices in order to analyze price behavior in relation to the underlying blockchain's directional bias.
The average is calculated by taking the values of the overall bias as -1 for bearish, 0 for neutral, and +1 for bullish, and then applying a triangular moving average over 20 periods by default. Simple and exponential moving averages are available, and traders can select the period length from the settings panel.
🔶 DETAILS
The four signals are based on IntoTheBlock's On-Chain Signals. We gather the data, manipulate it, and build the signals depending on each threshold.
Net network growth
float netNetworkGrowthData = customData('_TOTALADDRESSES')
float netNetworkGrowth = 100*(netNetworkGrowthData /netNetworkGrowthData - 1)
In the Money
float inTheMoneyData = customData('_INOUTMONEYIN')
float averageBalance = customData('_AVGBALANCE')
float inTheMoneyBalance = inTheMoneyData*averageBalance
float sma = ta.sma(inTheMoneyBalance,7)
float inTheMoney = ta.roc(sma,1)
Concentration
float whalesData = customData('_WHALESPERCENTAGE')
float inverstorsData = customData('_INVESTORSPERCENTAGE')
float bigHands = whalesData+inverstorsData
float concentration = ta.change(bigHands )*100
Large Transactions
float largeTransacionsData = customData('_LARGETXCOUNT')
float largeTX21 = ta.ema(largeTransacionsData,21)
float largeTX30 = ta.ema(largeTransacionsData,30)
float largeTransacions = ((largeTX21 - largeTX30)/largeTX30)*100
🔶 SETTINGS
Display mode: Select between gauge, historical data and average.
Average: Select a smoothing method and length period.
🔹 Thresholds
Net Network Growth : Bullish and bearish thresholds for this signal.
In The Money : Bullish and bearish thresholds for this signal.
Concentration : Bullish and bearish thresholds for this signal.
Transactions : Bullish and bearish thresholds for this signal.
🔹 Dashboard
Dashboard : Enable/disable dashboard display
Position : Select dashboard location
Size : Select dashboard size
🔹 Gauge
Scale : Select the size of the gauge
Curved : Enable/disable curved mode
Select Gauge colors for bearish, neutral and bullish bias
🔹 Style
Net Network Growth : Enable/disable historical plot and choose color
In The Money : Enable/disable historical plot and choose color
Concentration : Enable/disable historical plot and choose color
Large Transacions : Enable/disable historical plot and choose color

PORTFOLIO TABLE Simple [Titans_Invest]PORTFOLIO TABLE Simple
This is a simple table for you to monitor your assets or cryptocurrencies in your SPOT wallet without needing to access your broker’s website or wallet app.
⯁ HOW TO USE THIS TABLE❓
You only need to select the asset and enter the amount of each one.
The table will show how much you have of each asset and the total value of your portfolio.
You’ll be able to monitor up to 39 assets in real time.
⯁ CONVERT VALUES
You can also activate and select a currency for conversion.
For example, cryptocurrency assets are calculated in US dollars, but you can select euros as the conversion currency.
The values originally in dollars will then be displayed in euros.
⯁ Track your Portfolio in real time:
⯁ Add your local Currency to Convert Values:
⯁ Follow your Portfolio Live:
___________________________________________________________
📜 SCRIPT : PORTFOLIO TABLE Simple
🎴 Art by : @Titans_Invest & @DiFlip
👨💻 Dev by : @Titans_Invest & @DiFlip
🎑 Titans Invest — The Wizards Without Gloves 🧤
✨ Enjoy!
___________________________________________________________
o Mission 🗺
• Inspire Traders to manifest Magic in the Market.
o Vision 𐓏
• To elevate collective Energy 𐓷𐓏

Ultimate Volatility Scanner by NHBprod - Requested by Client!Hey Everyone!
I created another script to add to my growing library of strategies and indicators that I use for automated crypto and stock trading! This strategy is for BITCOIN but can be used on any stock or crypto. This was requested by a client so I thought I should create it and hopefully build off of it and build variants!
This script gets and compares the 14-day volatility using the ATR percentage for a list of cryptocurrencies and stocks. Cryptocurrencies are preloaded into the script, and the script will show you the TOP 5 coins in terms of volatility, and then compares it to the Bitcoin volatility as a reference. It updates these values once per day using daily timeframe data from TradingView. The coins are then sorted in descending order by their volatility.
If you don't want to use the preloaded set of coins, you have the option of inputting your own coins AND/OR stocks!
Let me know your thoughts.

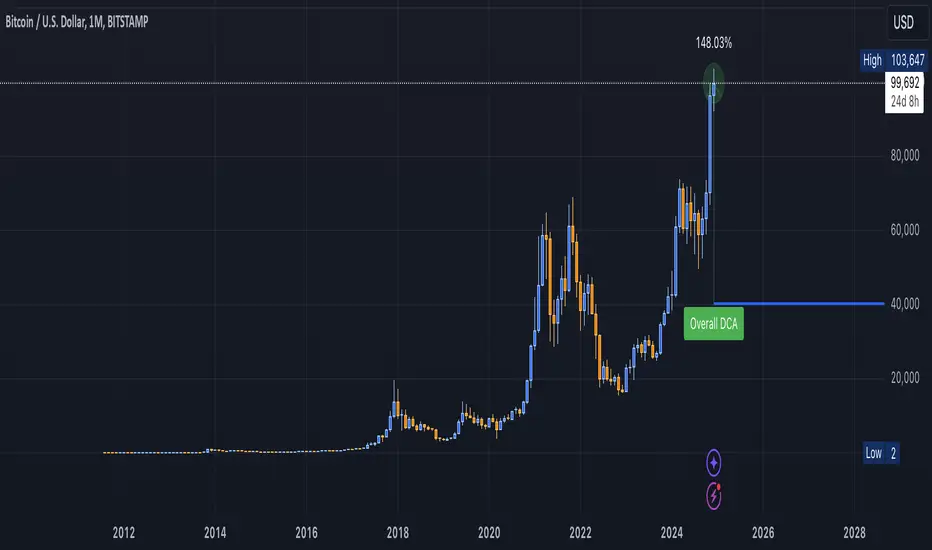
DCA Valuation & Unrealized GainsThis Pine Script for TradingView calculates and visualizes the relationship between a Dollar Cost Average (DCA) price and the All-Time High (ATH) price for over 50 different cryptocurrencies. Here's what it does:
1. Inputs for DCA Prices:
- Users can manually input DCA prices for specific cryptocurrencies (e.g., BTC, ETH, BNB).
2. Dynamic ATH Calculation:
- Dynamically calculates the ATH price for the current asset using the highest price in the chart's loaded data and persists this value across bars.
3. Percentage Change from DCA to ATH:
- Computes the percentage gain from the DCA price to the ATH price.
4. Visualizations:
- Draws a line at the DCA price and the ATH price, both extended to the right.
- Adds an arrow pointing from the DCA price to the ATH, offset by 10 bars into the future.
- Displays labels for:
- The percentage gain from DCA to ATH.
- "No DCA Configured" if no valid DCA price is set for the asset.
5. Color Coding:
- Labels and arrows are color-coded to indicate positive or negative percentage changes:
- Green for gains.
- Red for losses.
6. Adaptability:
- The script dynamically adjusts to the current asset based on its ticker and uses the corresponding DCA price.
This functionality provides traders with clear insights into their investment's performance relative to its ATH, aiding in decision-making.
-----
To add a new asset to the script:
1. Define the DCA Input: Add a new input for the asset's DCA price using the `input.float` function. For example:
dcaPriceNEW = input.float(title="NEW DCA Price", defval=0.1, tooltip="Set the DCA price for NEW")
2. Add the Asset Logic: Include a conditional check for the new asset in the ticker matching logic:
if str.contains(currentAsset, "NEW") and dcaPriceNEW != 0
dcaPrice := dcaPriceNEW
Where NEW is the ticker symbol of the asset you're adding.
NOTE: SOLO had to be put before SOL because otherwise the indicator was pulling the DCA price from SOL even on the SOLO chart. If you have a similar issue, try that fix.
Adding an asset requires only these two changes. Once done, the script dynamically incorporates the new asset into its calculations and visualizations.
4-Hour Moving AveragesTitle: 4-Hour Moving Averages Indicator
Description:
The "4-Hour Moving Averages" indicator is designed to help traders easily visualize key moving averages derived from the 4-hour timeframe, regardless of the chart interval they are using. This indicator plots four moving averages: a 15-period SMA (Short-Term), a 35-period SMA (Intermediate-Term), an 80-period SMA (Long-Term), and a 130-period SMA (Confirmation).
These moving averages provide a balanced approach for identifying short, medium, and long-term trends, as well as confirming significant market movements. Ideal for swing traders and those looking for clear trend signals, the indicator can be used for various markets, including stocks, forex, and cryptocurrencies.
The 4-hour moving averages overlay directly on the price chart, allowing for easy analysis of current price movements relative to important trend indicators. Use this script to enhance your trading decisions, identify opportunities, and avoid market traps by relying on consistent moving average trends.
Features:
- 15 SMA for Short-Term Trends (in red)
- 35 SMA for Intermediate-Term Trends (in orange)
- 80 SMA for Long-Term Trends (in green)
- 130 SMA for Confirmation (in blue)
Feel free to modify the settings to suit your specific strategy and market conditions.

Uptrick: Crypto Volatility Index** Crypto Volatility Index(VIX) **
Overview
The Crypto Volatility Index (VIX) is a specialized technical indicator designed to measure the volatility of cryptocurrency prices. Leveraging advanced statistical methods, including logarithmic returns and variance, the Crypto VIX offers a refined measure of market fluctuations. This approach makes it particularly useful for traders in the highly volatile cryptocurrency market, providing insights that traditional volatility indicators may not capture as effectively.
Purpose
The Crypto VIX aims to deliver a nuanced understanding of market volatility, tailored specifically for the cryptocurrency space. Unlike other volatility measures, the Crypto VIX employs sophisticated statistical methods to reflect the unique characteristics of cryptocurrency price movements. This makes it especially valuable for cryptocurrency traders, helping them navigate the inherent volatility of digital assets and manage their trading strategies and risk exposure more effectively.
Calculation
1. Indicator Declaration
The Crypto VIX is plotted in a separate pane below the main price chart for clarity:
indicator("Crypto Volatility Index (VIX)", overlay=false, shorttitle="Crypto VIX")
2. Input Parameters
Users can adjust the period length for volatility calculations:
length = input.int(14, title="Period Length")
3. Calculating Daily Returns
The daily returns are calculated using logarithmic returns:
returns = math.log(close / close )
- **Logarithmic Returns:** These returns provide a normalized measure of price changes, making it easier to compare returns over different periods and across different assets.
4. Average Return Calculation
The average return over the specified period is computed with a Simple Moving Average (SMA):
avg_return = ta.sma(returns, length)
5. Variance Calculation
Variance measures the dispersion of returns from the average:
variance = ta.sma(math.pow(returns - avg_return, 2), length)
- Variance : This tells us how much the returns deviate from the average, giving insight into how volatile the market is.
6. Standard Deviation (Volatility) Calculation
Volatility is derived as the square root of the variance:
volatility = math.sqrt(variance)
- Standard Deviation : This provides a direct measure of volatility, showing how much the price typically deviates from the mean return.
7. Plotting the Indicator
The volatility and average return are plotted:
plot(volatility, color=#21f34b, title="Volatility Index")
plot(avg_return, color=color.new(color.red, 80), title="Average Return", style=plot.style_columns)
Practical Examples
1. High Volatility Scenario
** Example :** During significant market events, such as major regulatory announcements or geopolitical developments, the Crypto VIX tends to rise sharply. For instance, if the Crypto VIX moves from a baseline level of 0.2 to 0.8, it indicates heightened market volatility. Traders might see this as a signal to adjust their strategies, such as reducing position sizes or setting tighter stop-loss levels to manage increased risk.
2. Low Volatility Scenario
** Example :** In a stable market, where prices fluctuate within a narrow range, the Crypto VIX will show lower values. For example, a drop in the Crypto VIX from 0.4 to 0.2 suggests lower volatility and stable market conditions. Traders might use this information to consider longer-term trades or take advantage of potential consolidation patterns.
Best Practices
1. Combining Indicators
- Moving Averages : Use the Crypto VIX with moving averages to identify trends and potential reversal points.
- Relative Strength Index (RSI): Combine with RSI to assess overbought or oversold conditions for better entry and exit points.
- Bollinger Bands : Pair with Bollinger Bands to understand volatility relative to price movements and spot potential breakouts.
2. Adjusting Parameters
- Short-Term Trading : Use a shorter period length (e.g., 7 days) to capture rapid volatility changes suitable for day trading.
- Long-Term Investing : A longer period length (e.g., 30 days) provides a smoother view of volatility, helping long-term investors navigate market trends.
Backtesting and Performance Insights
While specific backtesting data for the Crypto VIX is not yet available, the indicator is built on established principles of volatility measurement, such as logarithmic returns and standard deviation. These methods are well-regarded in financial analysis for accurately reflecting market volatility. The Crypto VIX is designed to offer insights similar to other effective volatility indicators, tailored specifically for the cryptocurrency markets. Its adaptation to digital assets and ability to provide precise volatility measures underscore its practical value for traders.
Originality and Uniqueness
The Crypto Volatility Index (VIX) distinguishes itself through its specialized approach to measuring volatility in the cryptocurrency markets. While the concepts of logarithmic returns and standard deviation are not new, the Crypto VIX integrates these methods into a unique framework designed specifically for digital assets.
- Tailored Methodology : Unlike generic volatility indicators, the Crypto VIX is adapted to the unique characteristics of cryptocurrencies, providing a more precise measure of price fluctuations that reflects the inherent volatility of digital markets.
- Enhanced Insights : By focusing on cryptocurrency-specific price behavior and incorporating advanced statistical techniques, the Crypto VIX offers insights that traditional volatility indicators might miss. This makes it a valuable tool for traders navigating the complex and fast-moving cryptocurrency landscape.
- Innovative Application : The Crypto VIX combines established financial metrics in a novel way, offering a fresh perspective on market volatility and contributing to more effective risk management and trading strategies in the cryptocurrency space.
Summary
The Crypto Volatility Index (VIX) is a specialized tool for measuring cryptocurrency market volatility. By utilizing advanced statistical methods such as logarithmic returns and standard deviation, it provides a detailed measure of price fluctuations. While not entirely original in its use of these methods, the Crypto VIX stands out through its tailored application to the unique characteristics of the cryptocurrency market. Traders can use the Crypto VIX to gauge market risk, adjust their strategies, and make informed trading decisions, supported by practical examples, best practices, and clear visual aids.

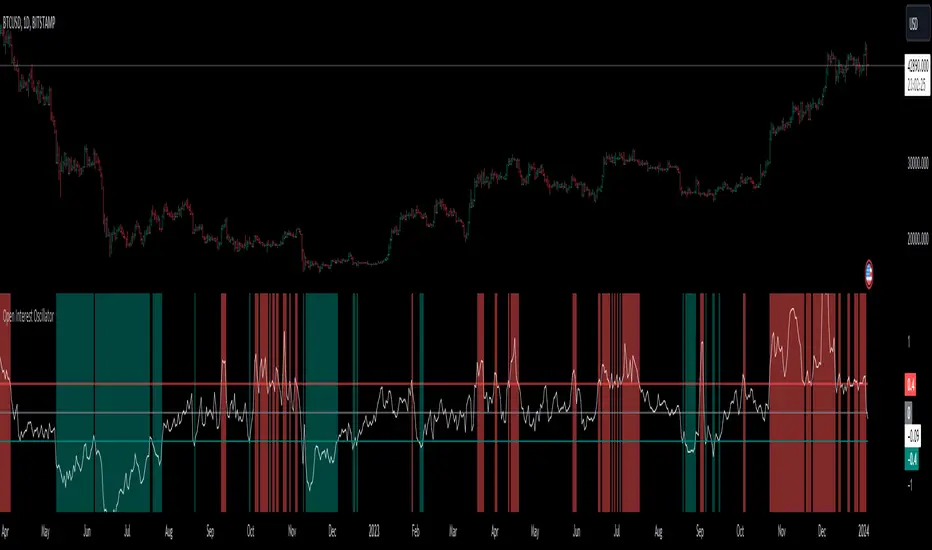
Open Interest OscillatorIn the middle of a bustling cryptocurrency market, with Bitcoin navigating a critical phase and the community hype over potential ETF approvals, current funding rates, and market leverage, the timing is optimal to harness the capabilities of sophisticated trading tools.
Meet the Open Interest Oscillator – special indicator tailored for the volatile arena of cryptocurrency trading. This powerful instrument is adept at consolidating open interest data from a multitude of exchanges, delivering an in-depth snapshot of market sentiment across all timeframes, be it a 1-minute sprint or a weekly timeframe.
This versatile indicator is compatible with nearly all cryptocurrency pairs, offering an expansive lens through which traders can gauge the market's pulse.
Key Features:
-- Multi-exchange Data Aggregation: This feature taps into the heart of the crypto market by aggregating open interest data from premier exchanges such as BINANCE, BITMEX, BITFINEX, and KRAKEN. It goes a step further by integrating data from various pairs and stablecoins, thus providing traders with a rich, multi-dimensional view of market activities.
-- Open Interest Bars: Witness the flow of market dynamics through bars that depict the volume of positions being opened or closed, offering a clear visual cue of trading behavior. In this mode, If bars are going into negative zone, then traders are closing their positions. If they go into positive territory - leveraged positions are being opened.
-- Bollinger Band Integration: Incorporate a layer of statistical analysis with standard deviation calculations, which frame the open interest changes, giving traders a quantified edge to evaluate the market's volatility and momentum.
-- Oscillator with Customizable Thresholds: Personalize your trading signals by setting thresholds that resonate with your unique trading tactics. This customization brings the power of tailored analytics to your strategic arsenal.
-- Max OI Ceiling Setting: In the fast-paced crypto environment where data can surge to overwhelming levels, the Max OI Ceiling ensures you maintain a clear view by capping the open interest data, thus preserving the readability and interpretability of information, even when market activity reaches feverish heights.
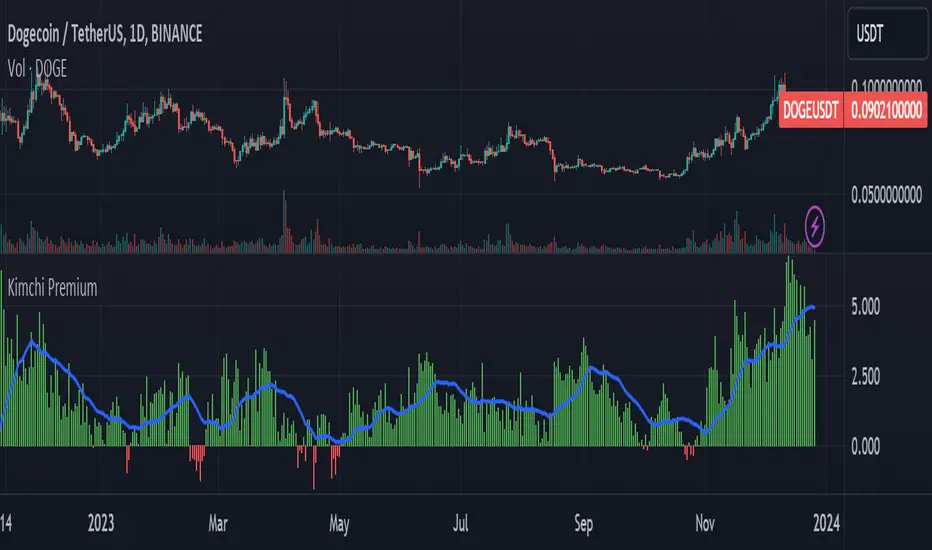
Kimchi Premium / Korean Premium ALL TICKERSKimchi Premium
Due to the isolated nature of Korean crypto markets, Koreans pay a hefty premium on most cryptos. (Usually ranging from 3% to 5%). This is colloquially known as the " Kimchi Premium ".
Uses
The extend of this premium can be used to gauge Korean sentiment towards certain tickers. Most of the insane alt coin rallies that are started by Korean degens are missed by foreign traders entirely. This script seeks to fix that.
Notes
This script automatically detects your current ticker and compares the USDT pair to the KRW pair after adjusting for exchange rate.
Works on all USDT, USDC, BUSD, FDUSD, USD, USDT.P, USDC.P or KRW pairs. Will obviously throw an error if your ticker has no KRW pairing.
Blockunity Stablecoin Liquidity (BSL)Monitor the liquidity of the crypto market by tracking the capitalizations of the major Stablecoins.
Stablecoin Liquidity (BSL) is an ideal tool for visualizing data on major Stablecoins. The number of Stablecoins in circulation is one of the best indices of liquidity within the crypto market. It’s an important metric to keep an eye on, as an increase in the number of Stablecoins in circulation offers a great opportunity to see cryptoasset prices rise. The tool’s multiple on-board display modes enable analysis of its data in the best possible conditions.
The Idea
The goal is to provide the community with the ideal tool to visualize the liquidity of the crypto market, via the state of the market capitalizations of the major Stablecoins.
How to Use
The tool is very easy to use and interpret. First of all, let's distinguish two main elements:
The chart as 3 distinct display modes to let you observe data in the best possible conditions.
There is a panel that summarizes the market capitalizations of the main Stablecoins.
Display Mode: Cumulative
In Cumulative mode (default), the different capitalizations are displayed one on top of the other with colored bands.
You can see that when the number of Stablecoins in circulation increases, crypto asset prices enter an uptrend. And if the liquidity of Stablecoins dries up, the trend will become bearish.
Display Mode: Aggregated
Aggregated mode displays a single line, which is the sum of the different capitalizations, varying between green and red depending on the state of this data according to its moving average declared in the 'Aggregated MA Lengh' field.
You can thus easily see trend changes and therefore opportunities to enter or exit the crypto market.
Display Mode: Independent
The Independent mode also displays the different capitalizations, but detached from each other with labels.
This display mode is particularly interesting for studying transfers from one Stablecoin to another, as can be seen below.
Other Settings
You can choose whether or not to include each of the Stablecoins data, and configure their display color. Note that in 'Cumulative' display mode, the data is taken into account even if the box is unchecked.
How it Works
The tool works in a simple way: We take the market capitalization data of the Stablecoins that interest us, then we process them according to the different display modes.
Let us know if you would like other ways of visualizing this data!

Big Whale Purchases and SalesBig Whale Purchases and Sales - plots big whale transactions on your chart!
People that hold more than 1% of a crypto currencies circulating supply are considered whales and have a huge influence on price, not just because they can move the market with their huge transactions, but also because other traders often track their wallets and follow their example. Taking a look at whale holdings, one can see why whale worship is so common in crypto: While Bitcoin has a relatively low whale concentration, many of the Top 100 Cryptocurrencies have whales control 60% or more of their circulating supply.
Integrating IntoTheBlock data, this script plots the transactions of these whales and, in strategy mode, copy trades them.
Features:
Strategy Mode: Switches the script between an indicator and a strategy.
Standard Deviations: The number of Standard Deviations that a transaction needs to surpass to be considered worth plotting. Setting this to 0 will show all whale transactions, higher settings will only show the biggest transactions.
Blockchain: The Chain on which Whale activity is tracked.
