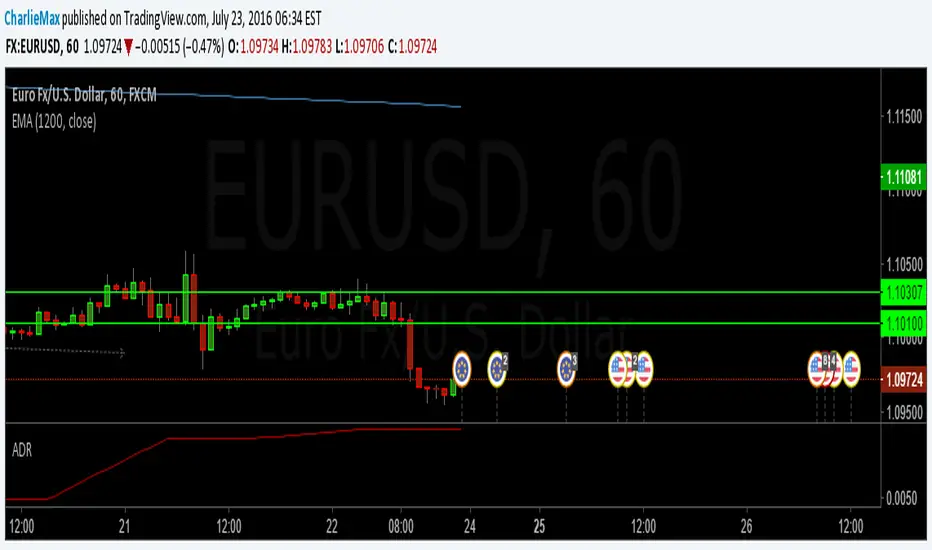
Close of relevant previous periodThis indicator puts the previous close value of a higher relevant time frame on the chart, it adepts to the period of the chart. Relevant means that it puts:
Close of previous year in monthly chart
Close of previous month in weekly chart
Close of either previous month of week in daily chart, default setting is week
Close of previous week in 4hourly and 3hourly charts
Close of previous day in 30minute and higher intraday charts
Not bother the user below 30 minutes.
חפש סקריפטים עבור "daily"

Weekly closeIt turned out not to be that easy to plot the close of the previous week in hourly or daily charts. In my first experiments things went wrong on Friday or intraday if you simply use the security function. So here is the thing with an algorithm that guaranties the correct value.

Short Interest - Daily VolumeShort interest and daily volume comparison. Originally "Nasdaq SI: Short Interest by Greeny"

HiLo Daily Fibonacci R1 by JustUncleLThis is another indicator in my Pivot level series. This one automatically draw Fibonacci levels based on the previous day's lowest (0%) and highest (100%) values, similar to a Fibonacci retracement.
Manual TimeFrames can be given, it is just a text string though and is not checked, so needs to be a valid resolution eg: 60, 120, 240, 360, 480, 720, 1D, 1W, 1M, 2D, 2W, 3M
LEVELS:
Green = 100% - 200% Levels
Blue = 0 - 100% Levels
Red = -100% - 0 Levels
Optionally can display historical Daily Fibonacci Levels.

Projected high moving stocks based on daily ATRMay be used to find out stocks that have a "relatively" high ATR thereby signifying that it is susceptible to similar moves in the future.

Moving Average Daily T/FrameSimple and useful tool, this is a MA but always in a Dayly time frame. You can chose the length and watch a "60" T/F with a MA200 on a daily resolution. Sometimes the MA is far away from current price and become difficult the see where is it, but always have the value show at side. Or can unlock the auto scale and scroll the chart until can find it.

Ichimoku + Daily-Candle_X + HULL-MA_X + MacDIchimoku_cloud + Daily-Candle_cross(DT) + HuLL-MovingAverage_cross + MacD
any timeframe, all indicators settings adjustable for fine tuning to pair/timeframe
Target Point and Stop Loss settings
set SL low to reduce repaint


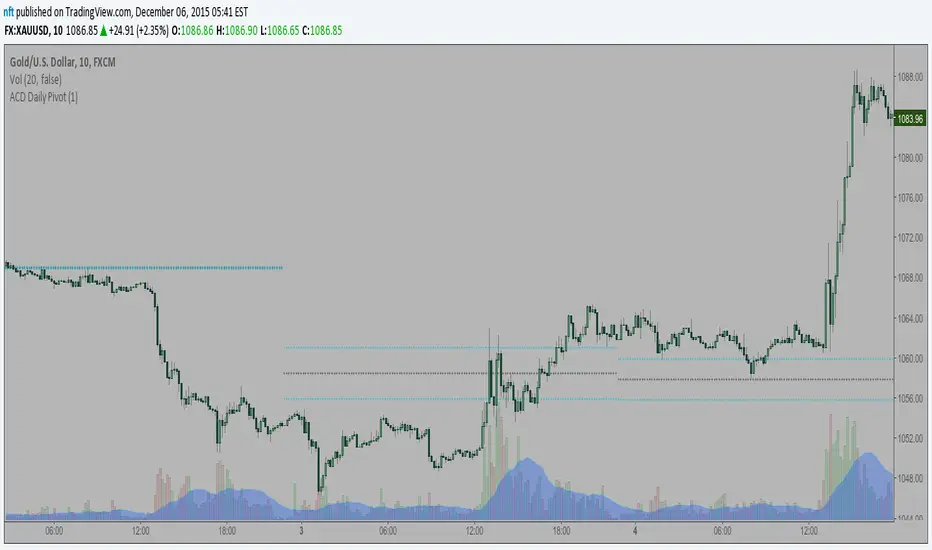
ACD Daily Pivot RangeThis indicator is to display the Daily Pivot Range for Mark Fishers "ACD" method.
If anyone knows how to offset it for different start times (LO, NYO) please let me know so I can update. Ideally the daily daily pivot calculation start should be from the same time as your opening range but i am not sure how to do this.
Column Up or DownThis is the same as my background up/down except it displays a column to show if the stock is above or below the previous day close.
When looking at numerous charts, you can instantly see if they are up or down for the day. For me, I like to be going long on the stocks that are already moving up and short on the ones that are moving down. When using lower time frames, you can lose perspective of where it is on the daily chart .

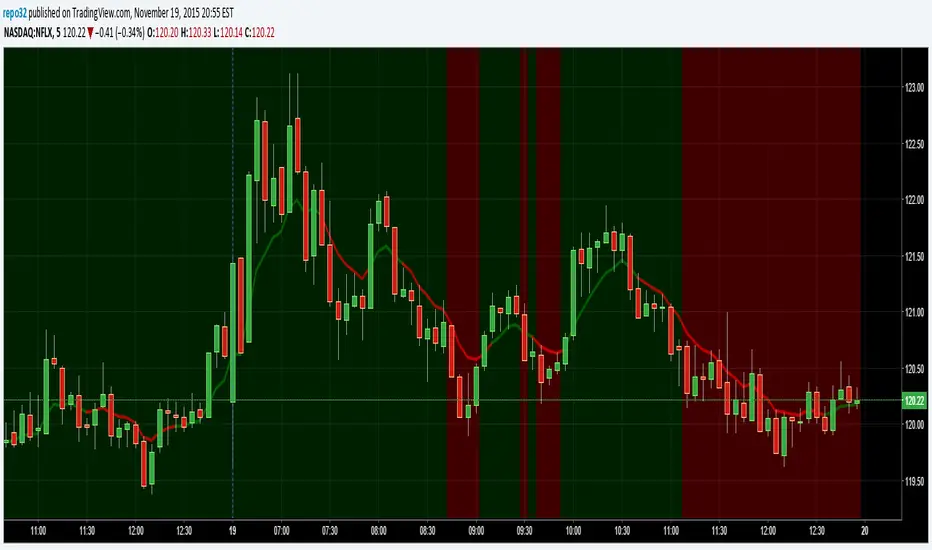
Background Up or DownThis script will color the background based upon whether it is positive or negative for the day. When looking at numerous charts, you can instantly see if they are up or down for the day. For me, I like to be going long on the stocks that are already moving up and short on the ones that are moving down. When using lower time frames, you can lose perspective of where it is on the daily chart.
On the example above, you can see a 5 minute chart of NFLX. It shows you when it dropped below the previous days close.
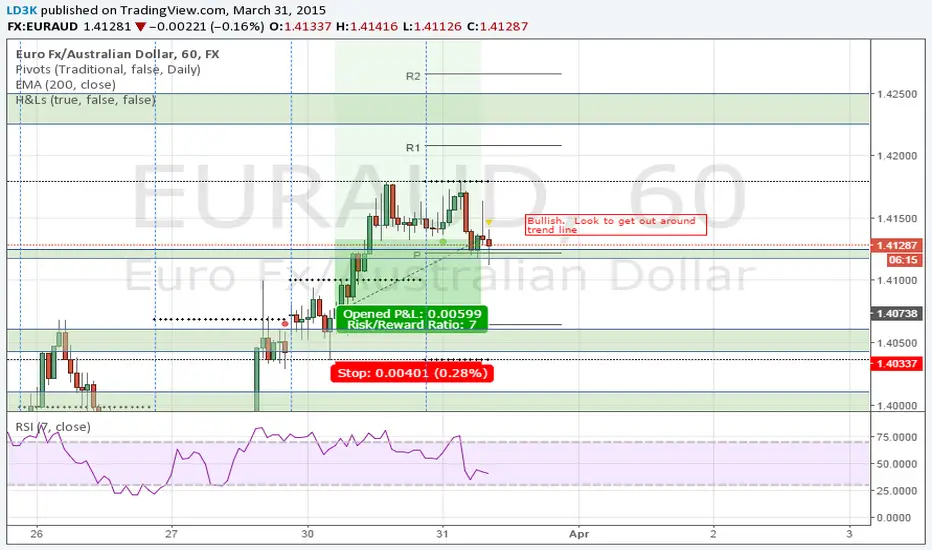
Eminaest Pivots V2Simple Pivot Points plotting script.
You can choose to plot Daily, Weekly and Monthly Pivot Points. Separate or two of them or all together.

Ichimoku V5 by ChrisMoody - Daily Kijun Mod by JDNIchimoku V5 by ChrisMoody with Daily Kijun-Sen Mod by JDN
This indicator has been modified to allow you to display the Daily Kijun-Sen on all time frames.

CM_Pivot Points Daily To IntradayNew Pivots Indicator With Options for Daily, 4 Hour, 2 Hour, 1 Hour, 30 Minute Pivot Levels!
Great for Forex Traders! - Take a Look at Chart with Weekly, Daily, and 4 Hour levels. Weekly Pivots Indicator is separate - Link is Below.
Plot one Pivot Level or Multiple at the Same Time via Check Boxes in the Inputs tab.
Defaults to 4 Hour Pivot Levels - Adjust in Inputs Tab.
S3 and R3 are turned off by Default - You can Activate Them In The Inputs Tab.
These Intraday Options were Requested By Users Using My CM_ Pivots Point Custom Indicator that Plots Daily, Weekly, Monthly, Quarterly, and Yearly Pivot Levels. Link is Below.
Now Both Longer-Term Traders and Shorter Term Traders Have All The Pivot Levels They Need. From Yearly Levels All The Way Down to 30 Minute Levels!
***The Candles On The Chart Are Custom Heikin-Ashi Paint Bars. Link is Below
CM_ Pivot Points Custom
Daily, Weekly, Monthly, Quarterly, Yearly Pivot Levels
Heikin-Ashi Paint Bars

DAPD - Daily Average Price Delta This indicator is similar to Bollinger Bands. It based on DAPD - Daily
Average Price Delta. DAPD is based upon a summation for each of the
highs (hod) for the 21 days prior to today minus the summation for
each of the lows (lod) for the last 21 days prior to today. The result
of this calculation would then be divided by 21.

Code Plots - High, Low, Open, Close—Daily, Weekly, & Monthly!!!Custom Code Plots High, Low, Open, Close
Plots Today And/Or Previous Day
Daily, Weekly, & Monthly TimeFrames
Default Settings:
Green = High
Silver = Open
Fuchsia = Close
Red = Low
Current D-W-M = Circles as Plots
Previous D-W-M = Cross as Plots
By Default The Current Days High, Low, Open, Close Plots. There are Check boxes On The Inputs Tab To Turn All Options On And Off.
***Tip - For Intra-Day Trades…I Find It Useful To Plot Previous Days High, Low, Open, Close For Support/Resistance, & Breakout Levels. Plotting the Current Weekly and Monthly Levels Is Also Very Useful.
***If You Trade Daily Charts The Previous Months Levels Are Very Useful as Support/Resistance, & Breakout Levels….
Code For High, Low, Open, Close
pastebin.com
Video On Importing Custom Indicators from PasteBin:
videos.tradingview.com

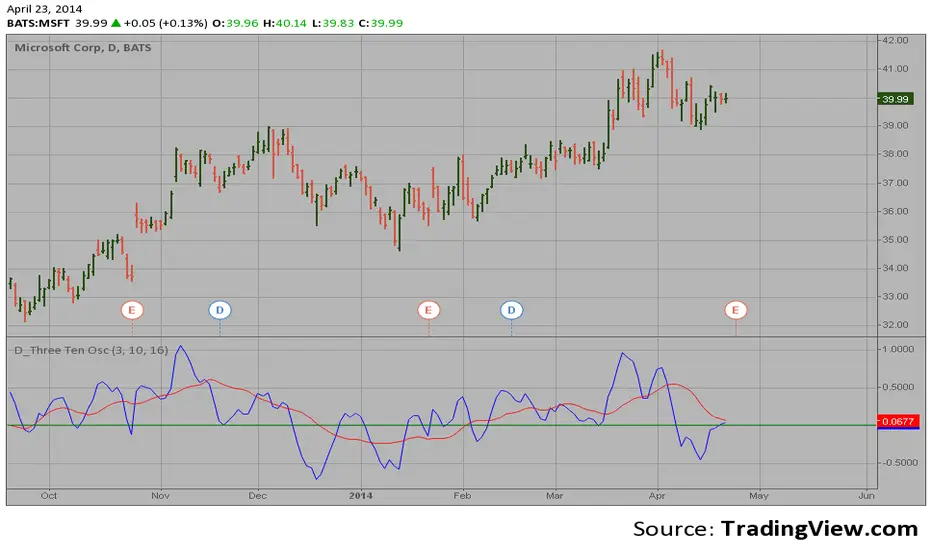
D_Three Ten Osc on the DailyHi
Let me introduce my D_Three Ten Osc script.
This indicator allows the
user to plot a daily 3-10 Oscillator on a Tick Bar Chart or any intraday interval.
Walter Bressert's 3-10 Oscillator is a detrending oscillator derived
from subtracting a 10 day moving average from a 3 day moving average.
The second plot is an 16 day simple moving average of the 3-10 Oscillator.
The 16 period moving average is the slow line and the 3/10 oscillator is
the fast line.
For more information on the 3-10 Oscillator see Walter Bressert's book
"The Power of Oscillator/Cycle Combinations"
trend&strengthwhen strength > 0, it's a bullish signal. more the strength value bigger ,more bullish.

SA Range Rank JNJ DAY 1.15.2026DAILY — PREPARE / POSITION MODE
Developer Note: Bias & Position Framing
This daily view is preparatory, not executable.
The purpose of the Daily timeframe is to define directional bias, not entries.
It helps frame which side of the market deserves attention and which activity should be ignored.
The goal here is context, not action.
________________________________________
Purpose on Daily
The Daily timeframe is used to:
• Define directional bias for the week
• Prepare position-building zones
• Identify environments where participation is unnecessary or elevated-risk
• Reduce overtrading by narrowing focus
Daily charts answer one question only:
“If I participate this week, which side makes sense?”
________________________________________
What Matters Most (Public View)
SA Range Indicator (RI):
→ Is the market transitioning or trending?
→ Is energy building, releasing, or rotating?
SA ZoneEngine (visual context only):
→ Are daily moves aligned with higher-timeframe structure?
→ Is price operating with or against dominant bias?
These visuals explain environment, not decisions.
________________________________________
How to Interpret Public Daily Posts
• Daily is not timing
• Daily is not execution
• Daily is not a signal
Daily charts prepare the trader mentally and structurally by clarifying:
• what deserves patience
• what deserves caution
• what deserves no attention at all
________________________________________
Messaging Line
“Daily charts prepare the trade — they don’t execute it.”
________________________________________
SEO Intent
daily equity bias, position preparation, market structure analysis
________________________________________
🤝 For Those Who Find Value
If these daily posts help you see the market more clearly:
• Follow, boost, and share my scripts, Ideas, and MINDS posts
• Feel free to message me directly with questions or build requests
• Constructive feedback and collaboration are always welcome
For traders who want to go deeper, optional memberships may include:
• Additional signal access
• Early previews
• Occasional free tools and upgrades
🔗 Membership & Signals
trianchor.gumroad.com
________________________________________
________________________________________
⏱ 15-MIN — PREPARE / POSITION MODE
Developer Note: Setup Formation Phase
The 15-minute timeframe is where setups begin to form, not where they are acted on.
This view exists to separate developing structure from noise.
________________________________________
Purpose on 15-Minute
The 15-minute timeframe is used to:
• Spot trap-prone conditions
• Identify developing structure
• Observe compression, rotation, or early expansion
• Prepare for execution — without acting
This timeframe answers a different question:
“Is something forming — or is this noise?”
________________________________________
What Matters Most (Public View)
SA Range Indicator (RI):
→ Compression → expansion transitions
→ Energy buildup vs premature release
SA CloudRegimes (visual only):
→ Whether price behavior reflects continuation, pullback, or contraction
→ Whether movement is controlled or impulsive
These visuals describe behavior, not entries.
________________________________________
How to Interpret Public 15-Minute Posts
• 15m is setup formation
• 15m is environmental awareness
• 15m is not execution
Most errors occur when traders act before structure has finished forming.
This timeframe exists to slow that impulse down.
________________________________________
Messaging Line
“Preparation happens before the move — not during it.”
________________________________________
SEO Intent
15 minute futures setup, market preparation, stop hunt behavior
________________________________________
🤝 For Those Who Find Value
If these posts help you better recognize developing structure:
• Follow, boost, and share my scripts, Ideas, and MINDS posts
• Feel free to message me directly with questions or build requests
• Constructive feedback and collaboration are always welcome
For traders who want to go deeper, optional memberships may include:
• Additional signal access
• Early previews
• Occasional free tools and upgrades
🔗 Membership & Signals
trianchor.gumroad.com
Daily (D) — Swing Bias / “This is the side that has permission”
Goal: Define swing participation: are we in a supported trend or mean-revert risk?
How to use:
• Daily RECLAIM = “permission restored” after a shock move / trend resumption.
• Use it to decide:
Hold adds / reduce hedges / stop fighting direction.
Best use case:
• After earnings/news displacement days
• After large liquidation candles
• After a major gap day
Settings:
• dispMult 1.1–1.5
• reclaimWindow 12–25
• cooldown 6–12
🔵 DAILY — Swing Environment & Risk Framing
1️⃣ Range Indicator (RI)
• Compression → swing expansion likely
• Expansion → continuation or exhaustion
Use:
Tells you whether to expect patience or momentum.
________________________________________
2️⃣ ZoneEngine (Structure)
• Confirms whether daily swings align with higher bias
• Filters false daily breakouts
Use:
Only trust daily moves that occur inside structure.
________________________________________
3️⃣ Cloud / Reclaim (Behavior)
• Trend Clouds → continuation environment
• Pullback Clouds → reload or fade zones
• Reclaim shows acceptance back into value
Use:
Distinguishes real pullbacks from traps.
________________________________________
4️⃣ Stop-Hunt Proxy
• Clears weak swing participants
• Often precedes continuation when aligned
Use:
Stop-hunt + compression + trend cloud = swing continuation context.

SA Range Rank WMT DAY 1.13.2026 PM SESSIONDAILY — PREPARE / POSITION MODE
Developer Note: Bias & Position Framing
This daily view is preparatory, not executable.
The purpose of the Daily timeframe is to define directional bias, not entries.
It helps frame which side of the market deserves attention and which activity should be ignored.
The goal here is context, not action.
________________________________________
Purpose on Daily
The Daily timeframe is used to:
• Define directional bias for the week
• Prepare position-building zones
• Identify environments where participation is unnecessary or elevated-risk
• Reduce overtrading by narrowing focus
Daily charts answer one question only:
“If I participate this week, which side makes sense?”
________________________________________
What Matters Most (Public View)
SA Range Indicator (RI):
→ Is the market transitioning or trending?
→ Is energy building, releasing, or rotating?
SA ZoneEngine (visual context only):
→ Are daily moves aligned with higher-timeframe structure?
→ Is price operating with or against dominant bias?
These visuals explain environment, not decisions.
________________________________________
How to Interpret Public Daily Posts
• Daily is not timing
• Daily is not execution
• Daily is not a signal
Daily charts prepare the trader mentally and structurally by clarifying:
• what deserves patience
• what deserves caution
• what deserves no attention at all
________________________________________
Messaging Line
“Daily charts prepare the trade — they don’t execute it.”
________________________________________
SEO Intent
daily equity bias, position preparation, market structure analysis
________________________________________
🤝 For Those Who Find Value
If these daily posts help you see the market more clearly:
• Follow, boost, and share my scripts, Ideas, and MINDS posts
• Feel free to message me directly with questions or build requests
• Constructive feedback and collaboration are always welcome
For traders who want to go deeper, optional memberships may include:
• Additional signal access
• Early previews
• Occasional free tools and upgrades
🔗 Membership & Signals
trianchor.gumroad.com
________________________________________
________________________________________
⏱ 15-MIN — PREPARE / POSITION MODE
Developer Note: Setup Formation Phase
The 15-minute timeframe is where setups begin to form, not where they are acted on.
This view exists to separate developing structure from noise.
________________________________________
Purpose on 15-Minute
The 15-minute timeframe is used to:
• Spot trap-prone conditions
• Identify developing structure
• Observe compression, rotation, or early expansion
• Prepare for execution — without acting
This timeframe answers a different question:
“Is something forming — or is this noise?”
________________________________________
What Matters Most (Public View)
SA Range Indicator (RI):
→ Compression → expansion transitions
→ Energy buildup vs premature release
SA CloudRegimes (visual only):
→ Whether price behavior reflects continuation, pullback, or contraction
→ Whether movement is controlled or impulsive
These visuals describe behavior, not entries.
________________________________________
How to Interpret Public 15-Minute Posts
• 15m is setup formation
• 15m is environmental awareness
• 15m is not execution
Most errors occur when traders act before structure has finished forming.
This timeframe exists to slow that impulse down.
________________________________________
Messaging Line
“Preparation happens before the move — not during it.”
________________________________________
SEO Intent
15 minute futures setup, market preparation, stop hunt behavior
________________________________________
🤝 For Those Who Find Value
If these posts help you better recognize developing structure:
• Follow, boost, and share my scripts, Ideas, and MINDS posts
• Feel free to message me directly with questions or build requests
• Constructive feedback and collaboration are always welcome
For traders who want to go deeper, optional memberships may include:
• Additional signal access
• Early previews
• Occasional free tools and upgrades
🔗 Membership & Signals
trianchor.gumroad.com
Daily (D) — Swing Bias / “This is the side that has permission”
Goal: Define swing participation: are we in a supported trend or mean-revert risk?
How to use:
• Daily RECLAIM = “permission restored” after a shock move / trend resumption.
• Use it to decide:
Hold adds / reduce hedges / stop fighting direction.
Best use case:
• After earnings/news displacement days
• After large liquidation candles
• After a major gap day
Settings:
• dispMult 1.1–1.5
• reclaimWindow 12–25
• cooldown 6–12
🔵 DAILY — Swing Environment & Risk Framing
1️⃣ Range Indicator (RI)
• Compression → swing expansion likely
• Expansion → continuation or exhaustion
Use:
Tells you whether to expect patience or momentum.
________________________________________
2️⃣ ZoneEngine (Structure)
• Confirms whether daily swings align with higher bias
• Filters false daily breakouts
Use:
Only trust daily moves that occur inside structure.
________________________________________
3️⃣ Cloud / Reclaim (Behavior)
• Trend Clouds → continuation environment
• Pullback Clouds → reload or fade zones
• Reclaim shows acceptance back into value
Use:
Distinguishes real pullbacks from traps.
________________________________________
4️⃣ Stop-Hunt Proxy
• Clears weak swing participants
• Often precedes continuation when aligned
Use:
Stop-hunt + compression + trend cloud = swing continuation context.
