Uptrick: FVG Market Zones**Uptrick: FVG Market Zones**
---
### Introduction
**Uptrick: FVG Market Zones** is a cutting-edge technical analysis tool designed to identify and visualize Fair Value Gaps (FVGs) within financial markets. This indicator focuses on pinpointing critical price levels where significant gaps occur, which can act as potential support and resistance zones. By integrating advanced volatility analysis and user-configurable parameters, the **Uptrick: FVG Market Zones** provides traders with a robust framework for understanding market dynamics and making informed trading decisions.
### Purpose and Functionality
The primary purpose of the **Uptrick: FVG Market Zones** indicator is to detect and highlight Fair Value Gaps, which are areas on a price chart where there is a significant price movement without any trading activity in between. These gaps can provide critical insights into market behavior, as they often indicate areas where the market has not fully accounted for the supply and demand dynamics. Traders use these zones to anticipate potential reversals, breakouts, or consolidations, making this tool highly valuable for both short-term and long-term trading strategies.
### Unique Features and Originality
The **Uptrick: FVG Market Zones** indicator is distinguished by its focus on FVGs and its ability to integrate this concept into a broader market analysis framework. Unlike other indicators that may offer generalized support and resistance levels, this tool specifically identifies and visualizes gaps based on volatility-adjusted criteria. This precision allows traders to focus on the most relevant market zones, improving their ability to anticipate market movements.
One of the standout features of this indicator is its user-configurable settings, which provide a high degree of customization. This flexibility ensures that traders can tailor the indicator to suit their specific trading style and the particular market they are analyzing. Additionally, the indicator's visualization capabilities are enhanced with customizable colors and gap-filling options, making it easier for traders to interpret and act on the information presented.
### Inputs and Configurations
**Uptrick: FVG Market Zones** comes with several user inputs that allow traders to customize the indicator's behavior and appearance. Each input plays a crucial role in determining how the indicator identifies and visualizes FVGs on the chart. Here’s a detailed breakdown of each input:
1. **FVG Analysis Period (fvgPeriod):**
- **Description:** This input determines the period over which the indicator analyzes the chart for identifying FVGs. By adjusting this value, traders can control how far back in time the indicator looks to detect significant gaps.
- **Default Value:** 25
- **Purpose:** A shorter period may focus on more recent market activity, making the indicator more sensitive to recent price movements. In contrast, a longer period allows the indicator to identify gaps that have remained unfilled for an extended time, potentially acting as stronger support or resistance levels.
2. **Analysis Mode (mode):**
- **Description:** The Analysis Mode input allows traders to choose between different methods of analyzing the chart for FVGs.
- **Options:** "Recent Gaps" and "Extended View"
- **Default Option:** "Recent Gaps"
- **Purpose:**
- **Recent Gaps:** Focuses on the latest significant gaps, providing traders with up-to-date information on the most relevant market zones.
- **Extended View:** Considers a broader range of gap patterns, which can be useful in markets where historical gaps may still influence current price action.
3. **Volatility Sensitivity (volatilityFactor):**
- **Description:** This input adjusts the sensitivity of the indicator to market volatility. It is used in calculating the threshold for identifying FVGs.
- **Default Value:** 0.3
- **Step Size:** 0.1
- **Purpose:** A higher sensitivity will cause the indicator to detect smaller gaps, which might be more frequent but less significant. Lower sensitivity focuses on larger, more impactful gaps, which are less frequent but potentially more powerful in predicting market behavior.
4. **Highlight Market Gaps (showGaps):**
- **Description:** A boolean input that determines whether the identified FVGs should be highlighted on the chart.
- **Default Value:** True
- **Purpose:** This input allows traders to toggle the visualization of FVGs. When enabled, the indicator highlights gaps using colored boxes, making them visually prominent on the chart.
5. **Bullish Highlight Color (bullColor):**
- **Description:** Sets the color used to highlight bullish FVGs (gaps that may indicate support).
- **Default Value:** #00FF7F (a shade of green)
- **Purpose:** The color choice is crucial for quickly distinguishing bullish zones from bearish ones. Green is typically associated with upward price movement, making it intuitive for traders to identify potential support areas.
6. **Bearish Highlight Color (bearColor):**
- **Description:** Sets the color used to highlight bearish FVGs (gaps that may indicate resistance).
- **Default Value:** #FF4500 (a shade of red)
- **Purpose:** Red is commonly associated with downward price movement, making it easy for traders to identify potential resistance areas. This color coding helps in quickly assessing the chart.
7. **Fill Gap Areas (fillGaps):**
- **Description:** A boolean input that determines whether the FVGs should be filled with a color on the chart.
- **Default Value:** True
- **Purpose:** Filling the gap areas provides a more solid visual cue for traders. It enhances the visibility of the gaps, making it easier to spot these zones during fast-paced trading sessions.
8. **Hidden Color (hidden):**
- **Description:** A color input that is used when certain elements should be hidden from the chart.
- **Default Value:** color.rgb(0,0,0,100) (a semi-transparent black)
- **Purpose:** This input is useful for controlling the visibility of certain plots or elements on the chart, ensuring that the indicator remains clean and uncluttered.
### Market Gap Detection
The core functionality of the **Uptrick: FVG Market Zones** indicator lies in its ability to detect Fair Value Gaps. These gaps occur when the price makes a significant jump from one level to another without any trading activity in between. The indicator uses a combination of price action analysis and volatility thresholds to identify these gaps.
- **Volatility Measurement:** The indicator begins by measuring market volatility using the Average True Range (ATR). This volatility measurement is then adjusted by the user-defined sensitivity factor, which determines the threshold for identifying significant gaps.
- **Gap Identification:** The indicator checks for instances where the current low is higher than the high two bars ago (bullish gap) or where the current high is lower than the low two bars ago (bearish gap). These conditions signify a potential FVG.
- **Gap Storage and Management:** Once a gap is identified, it is stored in an array. The indicator also manages the size of these arrays based on the selected analysis mode, ensuring that only the most relevant gaps are considered in the analysis.
### Visualization
Visualization is a key component of the **Uptrick: FVG Market Zones** indicator. By providing clear and customizable visual cues, the indicator ensures that traders can quickly and easily interpret the information it provides.
- **Gap Highlighting:** When enabled, the indicator highlights the identified FVGs on the chart using colored boxes. Bullish gaps are highlighted in green, while bearish gaps are highlighted in red. This color coding helps traders instantly recognize potential support and resistance zones.
- **Gap Filling:** The indicator can also fill the identified gaps with a semi-transparent color. This option enhances the visibility of the gaps, making them more prominent on the chart. Filled gaps are particularly useful for traders who want to keep track of these zones over multiple trading sessions.
- **Gap Averages:** The indicator calculates the average level of the identified gaps and plots these averages as lines on the chart. These lines represent the general area of support or resistance based on the detected gaps, providing traders with a reference point for setting their stop losses or profit targets.
- **Text Labels:** The indicator also labels each FVG with the text "FVG" inside the highlighted area. This feature ensures that traders can easily identify these zones even in charts with dense price action.
### Practical Applications
The **Uptrick: FVG Market Zones** indicator is versatile and can be applied to a wide range of trading strategies across different markets and timeframes. Here are a few examples of how this indicator can be used in practice:
1. **Support and Resistance Trading:**
- Traders can use the identified FVGs as dynamic support and resistance levels. By placing their trades based on these levels, they can take advantage of potential reversals or continuations at key market zones.
2. **Gap Filling Strategy:**
- Some traders focus on the concept of gap filling, where the market eventually returns to "fill" the gap created by rapid price movements. The **Uptrick: FVG Market Zones** indicator can
help identify such gaps and anticipate when the market might return to these levels.
3. **Breakout Trading:**
- The indicator can be used to identify breakouts from significant gaps. When the price moves beyond the identified FVGs, it may signal a strong trend continuation, providing an opportunity for breakout traders.
4. **Reversal Trading:**
- By monitoring the signals generated by the indicator, traders can identify potential market reversals. A sell signal after a prolonged uptrend or a buy signal after a downtrend may indicate a reversal, allowing traders to position themselves accordingly.
5. **Risk Management:**
- The average levels of the FVGs can be used to set stop-loss and take-profit levels. By aligning these levels with the FVG zones, traders can improve their risk management practices and enhance their trading discipline.
### Customization and Flexibility
One of the standout features of the **Uptrick: FVG Market Zones** indicator is its high level of customization. Traders can adjust various parameters to tailor the indicator to their specific needs and preferences.
- **Customizable Colors:** The indicator allows traders to choose their preferred colors for highlighting bullish and bearish gaps. This flexibility ensures that the indicator can be integrated seamlessly into any trading setup, regardless of the trader's color scheme preferences.
- **Adjustable Periods and Sensitivity:** By allowing traders to adjust the analysis period and volatility sensitivity, the indicator can be fine-tuned to suit different market conditions. For example, a trader might use a shorter analysis period and higher sensitivity in a volatile market, while opting for a longer period and lower sensitivity in a more stable market.
- **Toggling Visual Elements:** Traders can choose to enable or disable various visual elements of the indicator, such as gap highlighting, gap filling, and text labels. This level of control allows traders to declutter their charts and focus on the information that is most relevant to their trading strategy.
### Advantages and Benefits
The **Uptrick: FVG Market Zones** indicator offers several key advantages that make it a valuable tool for traders:
1. **Precision:** By focusing on Fair Value Gaps, the indicator provides highly precise levels of support and resistance, which are often more reliable than traditional horizontal levels.
2. **Clarity:** The clear visual representation of FVGs, along with the text labels and color coding, ensures that traders can quickly interpret the indicator's signals and incorporate them into their trading decisions.
3. **Adaptability:** The indicator's customizable settings allow it to be adapted to different markets, timeframes, and trading styles. Whether you are a day trader, swing trader, or long-term investor, this indicator can be tailored to meet your needs.
4. **Enhanced Decision-Making:** The trading signals generated by the indicator provide actionable insights that can help traders make more informed decisions. By aligning their trades with the identified FVG zones, traders can improve their chances of success.
5. **Risk Management:** The use of FVG zones as reference points for stop-loss and take-profit levels enhances risk management practices, helping traders protect their capital while maximizing their profit potential.
### Conclusion
The **Uptrick: FVG Market Zones** indicator is a powerful and versatile tool for traders seeking to enhance their market analysis and improve their trading outcomes. By focusing on Fair Value Gaps and providing a high level of customization, this indicator offers a unique blend of precision, clarity, and adaptability. Whether you are looking to identify key market zones, generate trading signals, or improve your risk management practices, the **Uptrick: FVG Market Zones** indicator is a valuable addition to any trader's toolkit.
With its innovative approach to market analysis and user-friendly design, **Uptrick: FVG Market Zones** stands out as an essential tool for traders who want to stay ahead of the market and make more informed trading decisions. Whether you are trading stocks, forex, commodities, or cryptocurrencies, this indicator provides the insights you need to navigate the markets with confidence and success.
חפש סקריפטים עבור "demand"

Normalized Willspread IndicatorNot sure to call it as willspread or not, because i take this idea from Larry William's original willspread indicator and did some modifications which found out to be more effective in my opinion, which is by subtracting 21 and 3 ma, this indicator is found on Trade_Stocks_and_Commodities_With_the_Insiders page155. Feel free to find out.
Here's what I modified, instead of using the subtraction between two ma, I use one ma only, I find more accurate in spotting oversold and overbought value. This indicator is useful for metals. It basically compares the value between two assets, let's say u are watching gold, u can select compare it to dxy, us30Y or gold, let's say u choose to compare to dxy, and the indicator shows the the index is overvalued which is above 80 levels, then it is suggesting that gold is overvalued, the same logic apply to undervalued as well which is 20 levels. This is not a entry or exit tool but as additional confluence, u can use any entry method u want like supply and demand and use this indicator to validate your idea, not sure whether it works on forex or not, so far i think it works well on metals.
The bar colour corresponding to the index when it is overbought or oversold. U can switch off it if you dont need it. Do note that this is a repainting indicator, so u must refer to previous week close.

Volume Insignts AnalyzerDescription:
The Volume Insight Analyzer is an advanced Pine Script designed for traders who want a comprehensive view of volume dynamics on their charts. This script combines multiple volume-based indicators to help identify key trading opportunities, including significant volume days, volume dry-ups, and pocket pivots.
Key Features:
VDU (Volume Dry-Up) Detection: Automatically identifies and marks days when the volume is significantly below its moving average, helping to spot potential breakout or breakdown points. Customizable volume thresholds allow for tailored analysis based on your trading strategy. The Volume Dry-Up label appears when the volume is substantially below its average level and the price is near a key moving average. This condition indicates a period of equilibrium between supply and demand, suggesting a potential low-risk entry point for traders.
Pocket Pivot Analysis using 5 and 10 Length Pocket Pivots: Highlights days with exceptionally high volume compared to recent history, indicating potential pocket pivots. Visual markers on the chart and volume bars color-coded for 5 and 10-day lengths. Pocket pivot points are identified when the volume on a given day exceeds the maximum volume observed over the past several days. Specifically, a 5-day pocket pivot point is marked when today's volume surpasses the highest selling volume of the last 5 days. A cluster of 5-day pocket pivot points within a base is a strong indicator of stock strength. Similarly, a 10-day pocket pivot point following a Volume Dry-Up (VDU) suggests a potential entry opportunity. Moreover, a pre-existing cluster of 5-day pocket pivot points before a 10-day pocket pivot point provides greater conviction in the trade.
Volume Moving Averages: Set different lengths for primary and secondary moving averages to track volume trends over daily, weekly, and monthly timeframes. Options to display moving average lines on the volume chart.
Volume Visualization:
a. Major and Minor Volume Bars: Option to display bars that are either above or below average volume levels. Adjustable settings to show or hide these bars based on user preference.
b. Volume Bar Coloring: Volume bars are color-coded based on significant volume thresholds, including green for bullish signals, red for bearish signals, and orange for volume dry-ups.
Volume Metrics Table: A customizable table that displays real-time volume metrics including Relative Volume (RVOL), Turnover, and the number of high volume days. The table can be oriented horizontally or vertically and styled according to your theme preferences.
Visual Indicators:
a) Volume Dry-Up (VDU) Labels: Clearly marked VDU events with textual annotations on the chart.
b) Bullish and Bearish Arrows: Arrows indicating potential bullish or bearish closes based on volume analysis, enhancing decision-making.
Customization Options:
a) Dark and Light Theme Support: Toggle between dark and light themes to match your chart settings.
b) Adjustable Parameters: Easily configure input settings such as volume thresholds, MA lengths, and table display options to fit your trading style.
How to Use:
Set Parameters: Adjust the script settings such as volume thresholds, moving average lengths, and display preferences according to your analysis needs.
Analyze Volume Patterns: Use the indicators and visual markers provided by the script to identify significant volume patterns and potential trading signals.
Monitor Metrics: Refer to the volume metrics table for a quick overview of key volume-related statistics and trends.
Make Informed Decisions: Utilize the visual cues and volume data provided by the script to enhance your trading strategy and make more informed decisions.
Disclaimer:
This script is for informational purposes only and should not be considered as trading advice. Use it in conjunction with other analysis tools and consult with a financial advisor if needed. Trading involves risk, and past performance does not guarantee future results.

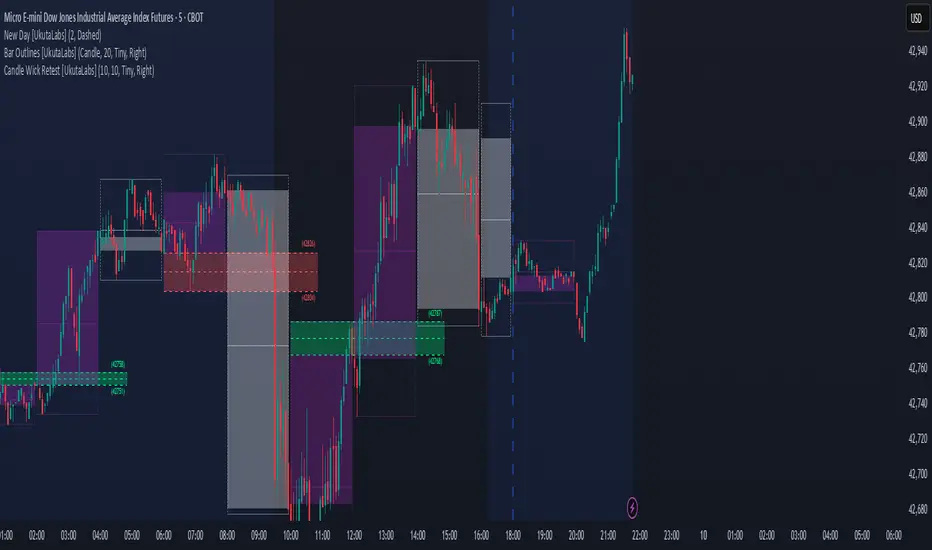
Candle Wick Shadows [UkutaLabs]█ OVERVIEW
The Candle Wick Shadows Indicator identifies untested wicks in real time that occur when there is an imbalance in the number of buyers and sellers at a price-level. This imbalance occurs when a market exchange receives too many of one kind of order, and not enough of its counterpoint.
Candle Wick Shadows is a powerful trading indicator that will automatically identify and label strong ranges on traders’ charts that can be incorporated into a wide variety of different trading strategies.
█ USAGE
The script automatically identifies and measures real-time ranges of imbalance between buying and selling pressure in the market using real-time price-action information. These levels indicate potential Supply and Demand zones which serve to help the trader identify areas where price has changed direction in the past due to an imbalance of buyers and sellers.
The script also allows users to mirror higher time frame Candle Wick Shadows onto lower time frame charts to gain a stronger understanding of key levels on another scale.
█ SETTINGS
Configuration
- Show Labels: Determines whether or not identification labels are drawn on the chart.
- Max CWS Display: Determines the number of Candle Wick Shadows that will be drawn on the chart. This is for each higher timeframe option that is toggled, not the total.
Current Time Frame
-Wick Shadow (On/Off): Determines whether or not wick shadows are drawn from the current time frame chart.
- Bullish Color: Determines the color of bullish wick shadows from the current time frame.
- Bearish Color: Determines the color of bearish wick shadows from the current time frame.
5 Minute (Higher Timeframe)
-Wick Shadow (On/Off): Determines whether or not wick shadows are drawn from the 5 minute time frame chart.
- Bullish Color: Determines the color of bullish wick shadows from the 5 minute time frame.
- Bearish Color: Determines the color of bearish wick shadows from the 5 minute time frame.
15 Minute (Higher Timeframe)
-Wick Shadow (On/Off): Determines whether or not wick shadows are drawn from the 15 minute time frame chart.
- Bullish Color: Determines the color of bullish wick shadows from the 15 minute time frame.
- Bearish Color: Determines the color of bearish wick shadows from the 15 minute time frame.
30 Minute (Higher Timeframe)
-Wick Shadow (On/Off): Determines whether or not wick shadows are drawn from the 30 minute time frame chart.
- Bullish Color: Determines the color of bullish wick shadows from the 30 minute time frame.
- Bearish Color: Determines the color of bearish wick shadows from the 30 minute time frame.
60 Minute (Higher Timeframe)
-Wick Shadow (On/Off): Determines whether or not wick shadows are drawn from the 60 minute time frame chart.
- Bullish Color: Determines the color of bullish wick shadows from the 60 minute time frame.
- Bearish Color: Determines the color of bearish wick shadows from the 60 minute time frame.
240 Minute (Higher Timeframe)
-Wick Shadow (On/Off): Determines whether or not wick shadows are drawn from the 240 minute time frame chart.
- Bullish Color: Determines the color of bullish wick shadows from the 240 minute time frame.
- Bearish Color: Determines the color of bearish wick shadows from the 240 minute time frame.
Daily (Higher Timeframe)
-Wick Shadow (On/Off): Determines whether or not wick shadows are drawn from the daily time frame chart.
- Bullish Color: Determines the color of bullish wick shadows from the daily time frame.
- Bearish Color: Determines the color of bearish wick shadows from the daily time frame.

Candle Wick Retest [UkutaLabs]█ OVERVIEW
The Candle Wick Retest Indicator identifies untested wicks in real time that occur when there is an imbalance in the number of buyers and sellers at a price-level. This imbalance occurs when a market exchange receives too many of one kind of order, and not enough of its counterpoint.
Candle Wick Retest is a powerful trading indicator that will automatically identify and label strong ranges on traders’ charts that can be incorporated into a wide variety of different trading strategies.
█ USAGE
The script automatically identifies and measures real-time ranges of imbalance between buying and selling pressure in the market using real-time price-action information. These levels indicate potential Supply and Demand zones which serve to help the trader identify areas where price has changed direction in the past due to an imbalance of buyers and sellers.
The script also allows users to mirror higher time frame Candle Wick Retests onto lower time frame charts to gain a stronger understanding of key levels on another scale.
█ SETTINGS
Configuration
- Show Labels: Determines whether or not identification labels are drawn on the chart.
- Max CW Display: Determines the number of Candle Wick Retests that will be drawn on the chart. This is for each higher timeframe option that is toggled, not the total.
Current Time Frame
- Wick Retest (On/Off): Determines whether wick retests will be drawn from the current time frame chart.
- Wick Retest Bullish Color: Determines the color of bullish wick retests from the current time frame.
- Wick Retest Bearish Color: Determines the color of bearish wick retests from the current time frame.
5 Minute (Higher Timeframe)
- Wick Retest (On/Off): Determines whether wick retests will be drawn from the 5 minute chart.
- Wick Retest Bullish Color: Determines the color of bullish wick retests from the 5 minute time frame.
- Wick Retest Bearish Color: Determines the color of bearish wick retests from the 5 minute time frame.
15 Minute (Higher Timeframe)
- Wick Retest (On/Off): Determines whether wick retests will be drawn from the 15 minute time frame chart.
- Wick Retest Bullish Color: Determines the color of bullish wick retests from the 15 minute time frame.
- Wick Retest Bearish Color: Determines the color of bearish wick retests from the 15 minute time frame.
30 Minute (Higher Timeframe)
- Wick Retest (On/Off): Determines whether wick retests will be drawn from the 30 minute time frame chart.
- Wick Retest Bullish Color: Determines the color of bullish wick retests from the 30 minute time frame.
- Wick Retest Bearish Color: Determines the color of bearish wick retests from the 30 minute time frame.
60 Minute (Higher Timeframe)
- Wick Retest (On/Off): Determines whether wick retests will be drawn from the 60 minute time frame chart.
- Wick Retest Bullish Color: Determines the color of bullish wick retests from the 60 minute time frame.
- Wick Retest Bearish Color: Determines the color of bearish wick retests from the 60 minute time frame.
240 Minute (Higher Timeframe)
- Wick Retest (On/Off): Determines whether wick retests will be drawn from the 240 minute time frame chart.
- Wick Retest Bullish Color: Determines the color of bullish wick retests from the 240 minute time frame.
- Wick Retest Bearish Color: Determines the color of bearish wick retests from the 240 minute time frame.
Daily (Higher Timeframe)
- Wick Retest (On/Off): Determines whether wick retests will be drawn from the daily time frame chart.
- Wick Retest Bullish Color: Determines the color of bullish wick retests from the daily time frame.
- Wick Retest Bearish Color: Determines the color of bearish wick retests from the daily time frame.
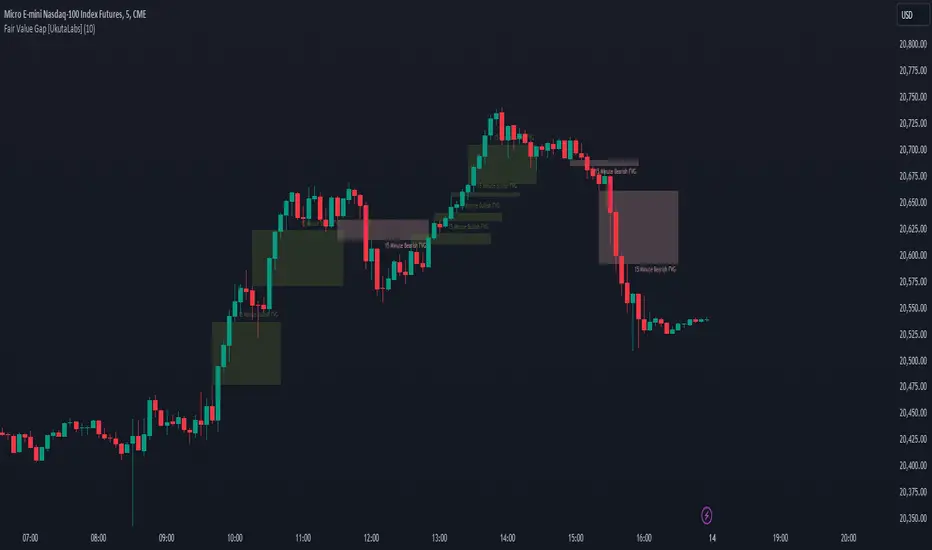
Fair Value Gap [UkutaLabs]█ OVERVIEW
Fair Value Gaps are price jumps caused by the imbalance buying and selling pressures in trading and are most commonly used amongst price action traders. Fair Value Gaps are formed via a three-candle sequence in which a large candle’s neighbouring candles’ upper and lower wicks do not fully overlap the large candle.
The Fair Value Gaps Indicator also supports Multi Time Frame Plotting, allowing you to plot the Fair Value Gaps from higher time frames onto lower time frame charts.
The Fair Value Gaps Indicator is a powerful trading toolkit that provides users with more information than they would typically have available to them by allowing them to configure several charts worth of information onto one single chart.
█ USAGE
The script automatically identifies imbalances between buying and selling pressure in the market in real time, offering traders valuable insight into current market sentiment. These gaps are considered to be levels where the supply and demand of a commodity are imbalanced, and the price tends to return to fill these gaps (But are not guaranteed to).
The Fair Value Gaps Indicator also allows gaps from higher time frames to be drawn on lower time frame charts, providing traders with more information than they would typically have access to to further simplify the decision making process.
█ SETTINGS
Configuration
• Show Labels: Determines whether labels that identify which time frame a FVG is calculated from.
• Max FVG Display: Determines the limit to the number of FVGs that can be drawn from all time frames. Set this value to 0 to remove this limit.
Current Time Frame
• Display: Determines whether or not FVGs from the current time frame will be drawn on the chart.
• Bullish Color: Determines the color of Bullish FVGs calculated from the current time frame.
• Bearish Color: Determines the color of Bearish FVGs calculated from the current time frame.
5 Minute (Higher Time Frame)
• Display: Determines whether or not FVGs from the 5 minute time frame will be drawn on the chart.
• Bullish Color: Determines the color of Bullish FVGs calculated from the 5 minute time frame.
• Bearish Color: Determines the color of Bearish FVGs calculated from the 5 minute time frame.
15 Minute (Higher Time Frame)
• Display: Determines whether or not FVGs from the 15 minute time frame will be drawn on the chart.
• Bullish Color: Determines the color of Bullish FVGs calculated from the 15 minute time frame.
• Bearish Color: Determines the color of Bearish FVGs calculated from the 15 minute time frame.
30 Minute (Higher Time Frame)
• Display: Determines whether or not FVGs from the 30 minute time frame will be drawn on the chart.
• Bullish Color: Determines the color of Bullish FVGs calculated from the 30 minute time frame.
• Bearish Color: Determines the color of Bearish FVGs calculated from the 30 minute time frame.
60 Minute (Higher Time Frame)
• Display: Determines whether or not FVGs from the 60 minute time frame will be drawn on the chart.
• Bullish Color: Determines the color of Bullish FVGs calculated from the 60 minute time frame.
• Bearish Color: Determines the color of Bearish FVGs calculated from the 60 minute time frame.
240 Minute (Higher Time Frame)
• Display: Determines whether or not FVGs from the 240 minute time frame will be drawn on the chart.
• Bullish Color: Determines the color of Bullish FVGs calculated from the 240 minute time frame.
• Bearish Color: Determines the color of Bearish FVGs calculated from the 240 minute time frame.
Daily (Higher Time Frame)
• Display: Determines whether or not FVGs from the daily time frame will be drawn on the chart.
• Bullish Color: Determines the color of Bullish FVGs calculated from the daily time frame.
• Bearish Color: Determines the color of Bearish FVGs calculated from the daily time frame.
Inversion Fair Value Gaps [TradingFinder] IFVG ICT Signal| Alert🔵 Introduction
🟣 Inversion Fair Value Gap (IFVG)
An ICT Inversion Fair Value Gap, or reverse FVG, occurs when a fair value gap fails to hold its price, resulting in the price moving beyond and breaking the gap. This situation marks the initial change in price momentum.
Generally, prices respect fair value gaps and continue in their trend direction. However, when a fair value gap is breached, it transforms into an inversion fair value gap, signaling a potential short-term reversal or a subsequent change in direction.
🔵 How to Use
🟣 Identifying an Inversion Fair Value Gap
To spot an IFVG, you must first identify a fair value gap.
Inversion fair value gaps can be categorized into two types :
🟣 Bullish Inversion Fair Value Gap
A bullish IFVG occurs when a bearish fair value gap is invalidated by the price closing above it.
Steps to identify it :
Identify a bearish fair value gap.
When the price closes above this gap, it becomes a bullish inversion fair value gap.
This gap acts as a support level, pushing the price upwards and indicating a shift in momentum from sellers to buyers.
🟣 Bearish Inversion Fair Value Gap
A bearish IFVG happens when a bullish fair value gap fails, with the price closing below it.
Steps to identify it :
Identify a bullish fair value gap.
When the price closes below this gap, it becomes a bearish inversion fair value gap.
This gap acts as a resistance level, pushing the price downwards and indicating a shift in momentum from buyers to sellers.
🔵 Settings
🟣 Global Settings
Show All Inversion FVG: If disabled, only the most recent FVG will be displayed.
IFVG Validity Period (Bar): Determines the maximum duration (in number of candles) that the FVG and IFVG remain valid.Switching Colors Theme Mode: Includes three modes: "Off", "Light", and "Dark". "Light" mode adjusts colors for light mode use, "Dark" mode adjusts colors for dark mode use, and "Off" disables color adjustments.
🟣 Logic Settings
FVG Filter : This refines the number of identified FVG areas based on a specified algorithm to focus on higher quality signals and reduce noise.
Types of FVG filters :
Very Aggressive Filter : Adds a condition where, for an upward FVG, the last candle's highest price must exceed the middle candle's highest price, and for a downward FVG, the last candle's lowest price must be lower than the middle candle's lowest price. This minimally filters out FVGs.
Aggressive Filte r: Builds on the Very Aggressive mode by ensuring the middle candle is not too small, filtering out more FVGs.
Defensive Filter : Adds criteria regarding the size and structure of the middle candle, requiring it to have a substantial body and specific polarity conditions, filtering out a significant number of FVGs.
Very Defensive Filter : Further refines filtering by ensuring the first and third candles are not small-bodied doji candles, retaining only the highest quality signals.
Mitigation Level FVG and IFVG : Options include "Proximal", "Distal", or "50 % OB" modes, which you can choose based on your needs. The "50 % OB" line is the midpoint between distal and proximal.
🟣 Display Settings
Show Bullish IFVG : Toggles the display of demand-related boxes.
Show Bearish IFVG : Toggles the display of supply-related boxes.
🟣 Alert Settings
Alert Inversion FVG Mitigation : Enables alerts for Inversion FVG mitigation.
Message Frequency : Determines the frequency of alerts. Options include 'All' (every function call), 'Once Per Bar' (first call within the bar), and 'Once Per Bar Close' (final script execution of the real-time bar). Default is 'Once per Bar'.
Show Alert Time by Time Zone : Configures the time zone for alert messages. Default is 'UTC'.
Display More Info : Provides additional details in alert messages, including price range, date, hour, and minute. Set to 'Off' to exclude this information.

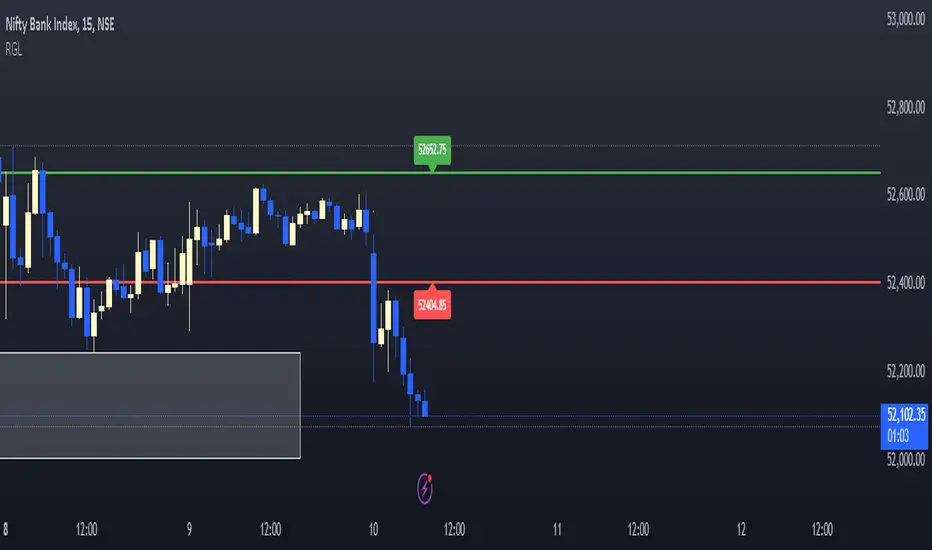
RGLRGL Breakout and Retest Trade Strategy
Key Concepts:
Breakout: A breakout occurs when the price moves decisively through a significant support (green line) or resistance (red line) level. This indicates a shift in supply and demand dynamics, with the potential for a strong price movement in the breakout direction.
Retest: After the breakout, the price often returns to the broken level (support becomes resistance and vice versa) to test its validity. This retest provides an opportunity to enter the trade at a more favorable price with confirmation of the breakout.
Market Structures + ZigZag [TradingFinder] CHoCH/BOS - MSS/MSB🟣 Introduction
🔵 Market Structure
Grasping market structure entails examining market behavior. Essentially, market structure refers to the formation and progression of the market within its trends.
Market structures are generally fractal and nested, leading us to classify them into internal (minor) and external (major) structures. There are several definitions of market structure, with differing perspectives such as Smart Money and ICT offering their own interpretations.
🔵 Zig Zag
The Zigzag indicator is a lagging tool that identifies points on a price chart where significant changes occur compared to the previous wave. By connecting these points, it helps traders detect trends.
This indicator minimizes random price fluctuations, aiming to clarify the primary price trend.
Pivots are points on a price chart where the direction changes. Also known as reversal points, pivots form when supply and demand forces overpower one another.
There are various types of technical analysis pivots, which can be divided into two categories: minor pivots and major pivots, each with distinct significance in analysis.
Major Pivot : These pivots signify substantial changes in the chart's direction and occur at the end of trends. Analysts focusing on primary analysis prioritize major pivot points. In fact, most technical analysis tools are evaluated and based on major pivots.
Minor Pivot : These pivots highlight smaller, subsidiary points and directions, appearing at the end of corrections. Analysts who focus on minor pivots represent small trends. It's important to note that minor pivots are not suitable for use in primary technical tools.
Identifying Minor and Major Pivots :
Minor pivots are formed between two major pivots and do not break the opposing major pivot. (Internal Pivot)
Major pivots are those that either successfully break the opposing pivot or move beyond the previous pivot of the same type. (External Pivot)
🟣 How to Use
🔵 Identifying Break of Structure (BOS)
In a given trend, such as a downtrend, a Break of Structure occurs when the price drops below the previous low and forms a new low (LL). In an uptrend, a BOS (MSB) happens when the price rises and exceeds the last high.
To confirm a trend, at least one BOS is required. The break above or below the previous high or low must be validated by the closing of at least one candle beyond that level.
🔵 Identifying Change of Character (CHOCH)
Change of Character (CHOCH) is an essential concept in market structure analysis, indicating a trend change. In other words, a trend concludes with a CHOCH (MSS). For example, in a downtrend, the price declines with BOS.
While BOS highlights the trend's strength, a CHOCH occurs when the price rises and surpasses the last high, signaling a transition from a downtrend to an uptrend.
This does not imply immediately entering a buy trade; instead, it is prudent to wait for a BOS in the upward direction to confirm the uptrend.
Unlike BOS, confirming a CHOCH does not require a candle to close; simply breaking above or below the previous high or low with the candle's wick is sufficient. The following examples illustrate bearish and bullish CHOCH.
Terms :
Market Structure Shift = MSS
Market Structure Break = MSB
🔵 Zig Zag
Based on identifying pivots and drawing zigzag lines, you can have different uses of this indicator.
Including :
Identifying pivot types along with major and minor recognition.
Identifying internal and external breakouts.
Identifying support and resistance levels.
Identifying Elliott Waves.
Identifying classic patterns.
Identifying pivots with higher validity.
Identifying trends and range areas.
🟣 Settings
Pivot Period Market Structure and ZigZag Line: Using this input, you can determine the pivot period for identifying swings.
Through the settings, you can customize the display, visibility, and color of each line as desired.

KillZones + ACD Fisher [TradingFinder] Sessions + Reversal Level🔵 Introduction
🟣 ACD Method
"The Logical Trader" opens with a thorough exploration of the ACD Methodology, which focuses on pinpointing particular price levels associated with the opening range.
This approach enables traders to establish reference points for their trades, using "A" and "C" points as entry markers. Additionally, the book covers the concept of the "Pivot Range" and how integrating it with the ACD method can help maximize position size while minimizing risk.
🟣 Session
The forex market is operational 24 hours a day, five days a week, closing only on Saturdays and Sundays. Typically, traders prefer to concentrate on one specific forex trading session rather than attempting to trade around the clock.
Trading sessions are defined time periods when a particular financial market is active, allowing for the execution of trades.
The most crucial trading sessions within the 24-hour cycle are the Asia, London, and New York sessions, as these are when substantial money flows and liquidity enter the market.
🟣 Kill Zone
Traders in financial markets earn profits by capitalizing on the difference between their buy/sell prices and the prevailing market prices.
Traders vary in their trading timelines.Some traders engage in daily or even hourly trading, necessitating activity during periods with optimal trading volumes and notable price movements.
Kill zones refer to parts of a session characterized by higher trading volumes and increased price volatility compared to the rest of the session.
🔵 How to Use
🟣 Session Times
The "Asia Session" comprises two parts: "Sydney" and "Tokyo." This session begins at 23:00 and ends at 06:00 UTC. The "Asia KillZone" starts at 23:00 and ends at 03:55 UTC.
The "London Session" includes "Frankfurt" and "London," starting at 07:00 and ending at 14:25 UTC. The "London KillZone" runs from 07:00 to 09:55 UTC.
The "New York" session starts at 14:30 and ends at 19:25 UTC, with the "New York am KillZone" beginning at 14:30 and ending at 22:55 UTC.
🟣 ACD Methodology
The ACD strategy is versatile, applicable to various markets such as stocks, commodities, and forex, providing clear buy and sell signals to set price targets and stop losses.
This strategy operates on the premise that the opening range of trades holds statistical significance daily, suggesting that initial market movements impact the market's behavior throughout the day.
Known as a breakout strategy, the ACD method thrives in volatile or strongly trending markets like crude oil and stocks.
Some key rules for employing the ACD strategy include :
Utilize points A and C as critical reference points, continually monitoring these during trades as they act as entry and exit markers.
Analyze daily and multi-day pivot ranges to understand market trends. Prices above the pivots indicate an upward trend, while prices below signal a downward trend.
In forex trading, the ACD strategy can be implemented using the ACD indicator, a technical tool that gauges the market's supply and demand balance. By evaluating trading volume and price, this indicator assists traders in identifying trend strength and optimal entry and exit points.
To effectively use the ACD indicator, consider the following :
Identifying robust trends: The ACD indicator can help pinpoint strong, consistent market trends.
Determining entry and exit points: ACD generates buy and sell signals to optimize trade timing.
Bullish Setup :
When the "A up" line is breached, it’s wise to wait briefly to confirm it’s not a "Fake Breakout" and that the price stabilizes above this line.
Upon entering the trade, the most effective stop loss is positioned below the "A down" line. It's advisable to backtest this to ensure the best outcomes. The recommended reward-to-risk ratio for this strategy is 1, which should also be verified through backtesting.
Bearish Setup :
When the "A down" line is breached, it’s prudent to wait briefly to ensure it’s not a "Fake Breakout" and that the price stabilizes below this line.
Upon entering the trade, the most effective stop loss is positioned above the "A up" line. Backtesting is recommended to confirm the best results. The recommended reward-to-risk ratio for this strategy is 1, which should also be validated through backtesting.
Advantages of Combining Kill Zone and ACD Method in Market Analysis :
Precise Trade Timing : Integrating the Kill Zone strategy with the ACD Method enhances precision in trade entries and exits. The ACD Method identifies key points for trading, while the Kill Zone focuses on high-activity periods, together ensuring optimal timing for trades.
Better Trend Identification : The ACD Method’s pivot ranges help spot market trends, and when combined with the Kill Zone’s emphasis on periods of significant price movement, traders can more effectively identify and follow strong market trends.
Maximized Profits and Minimized Risks : The ACD Method's structured approach to setting price targets and stop losses, coupled with the Kill Zone's high-volume trading periods, helps maximize profit potential while reducing risk.
Robust Risk Management : Combining these methods provides a comprehensive risk management strategy, strategically placing stop losses and protecting capital during volatile periods.
Versatility Across Markets : Both methods are applicable to various markets, including stocks, commodities, and forex, offering flexibility and adaptability in different trading environments.
Enhanced Confidence : Using the combined insights of the Kill Zone and ACD Method, traders gain confidence in their decision-making process, reducing emotional trading and improving consistency.
By merging the Kill Zone’s focus on trading volumes and the ACD Method’s structured breakout strategy, traders benefit from a synergistic approach that enhances precision, trend identification, and risk management across multiple markets.

ICT KillZones + Pivot Points [TradingFinder] Support/Resistance 🟣 Introduction
Pivot Points are critical levels on a price chart where trading activity is notably high. These points are derived from the prior day's price data and serve as key reference markers for traders' decision-making processes.
Types of Pivot Points :
Floor
Woodie
Camarilla
Fibonacci
🔵 Floor Pivot Points
Widely utilized in technical analysis, floor pivot points are essential in identifying support and resistance levels. The central pivot point (PP) acts as the primary level, suggesting the trend's likely direction.
The additional resistance levels (R1, R2, R3) and support levels (S1, S2, S3) offer further insight into potential trend reversals or continuations.
🔵 Camarilla Pivot Points
Featuring eight distinct levels, Camarilla pivot points closely correspond with support and resistance, making them highly effective for setting stop-loss orders and profit targets.
🔵 Woodie Pivot Points
Similar to floor pivot points, Woodie pivot points differ by placing greater emphasis on the closing price, often resulting in different pivot levels compared to the floor method.
🔵 Fibonacci Pivot Points
Fibonacci pivot points combine the standard floor pivot points with Fibonacci retracement levels applied to the previous trading period's range. Common retracement levels used are 38.2%, 61.8%, and 100%.
🟣 Sessions
Financial markets are divided into specific time segments, known as sessions, each with unique characteristics and activity levels. These sessions are active at different times throughout the day.
The primary sessions in financial markets include :
Asian Session
European Session
New York Session
The timing of these major sessions in UTC is as follows :
Asian Session: 23:00 to 06:00
European Session: 07:00 to 14:25
New York Session: 14:30 to 22:55
🟣 Kill Zones
Kill zones are periods within a session marked by heightened trading activity. During these times, trading volume surges and price movements become more pronounced.
The timing of the major kill zones in UTC is :
Asian Kill Zone: 23:00 to 03:55
European Kill Zone: 07:00 to 09:55
New York Kill Zone: 14:30 to 16:55
Combining kill zones and pivot points in financial market analysis provides several advantages :
Enhanced Market Sentiment Analysis : Aligns key price levels with high-activity periods for a clearer market sentiment.
Improved Timing for Trade Entries and Exits : Helps better time trades based on when price movements are most likely.
Higher Probability of Successful Trades : Increases the accuracy of predicting market movements and placing profitable trades.
Strategic Stop-Loss and Profit Target Placement : Allows for precise risk management by strategically setting stop-loss and profit targets.
Versatility Across Different Time Frames : Effective in both short and long time frames, suitable for various trading strategies.
Enhanced Trend Identification and Confirmation : Confirms trends using both pivot levels and high-activity periods, ensuring stronger trend validation.
In essence, this integrated approach enhances decision-making, optimizes trading performance, and improves risk management.
🟣 How to Use
🔵 Two Approaches to Trading Pivot Points
There are two main strategies for trading pivot points: utilizing "pivot point breakouts" and "price reversals."
🔵 Pivot Point Breakout
When the price breaks through pivot lines, it signals a shift in market sentiment to the trader. In the case of an upward breakout, where the price crosses these pivot lines, a trader might enter a long position, placing their stop-loss just below the pivot point (P).
Conversely, if the price breaks downward, a short position can be initiated below the pivot point. When using the pivot point breakout strategy, the first and second support levels can serve as profit targets in an upward trend. In a downward trend, these roles are filled by the first and second resistance levels.
🔵 Price Reversal
An alternative method involves waiting for the price to reverse at the support and resistance levels. To implement this strategy, traders should take positions opposite to the prevailing trend as the price rebounds from the pivot point.
While this tool is commonly used in higher time frames, it tends to produce better results in shorter time frames, such as 1-hour, 30-minute, and 15-minute intervals.
Three Strategies for Trading the Kill Zone
There are three principal strategies for trading within the kill zone :
Kill Zone Hunt
Breakout and Pullback to Kill Zone
Trading in the Trend of the Kill Zone
🔵 Kill Zone Hunt
This strategy involves waiting until the kill zone concludes and its high and low lines are established. If the price reaches one of these lines within the same session and is strongly rejected, a trade can be executed.
🔵 Breakout and Pullback to Kill Zone
In this approach, once the kill zone ends and its high and low lines stabilize, a trade can be made if the price breaks one of these lines decisively within the same session and then pulls back to that level.
🔵 Trading in the Trend of the Kill Zone
Kill zones are characterized by high trading volumes and strong trends. Therefore, trades can be placed in the direction of the prevailing trend. For instance, if an upward trend dominates this area, a buy trade can be entered when the price reaches a demand order block.

ACD Indicator [TradingFinder] M Fisher Pivots Methodology Signal🔵 Introduction
The book "The Logical Trader" begins with a comprehensive review of the ACD Methodology principles, which include identifying specific price points related to the opening range.
This method allows you to set reference points for trading and use points "A" and "C" for trade entry. You will also learn about the "Pivot Range" and how to combine them with the ACD method to maximize position size and minimize risk.
In this indicator, the strategy is implemented to make it easier to use.
🔵 How to Use
The "ACD" strategy can be applied to various markets such as stocks, commodities, or forex, providing buy and sell signals that allow you to set your price targets and stop losses.
This strategy is based on the assumption that the opening range of trades is statistically significant each day, meaning the initial market fluctuations influence the market until the end of the day.
The ACD trading strategy is known as a breakout strategy and performs best in volatile or strongly trending markets, such as crude oil and stocks.
Some of the rules for using the ACD strategy include the following :
Consider points A and C as reference points and continuously pay attention to these points during trades. These points serve as entry and exit points for trades.
Examine daily and multi-day pivot ranges to analyze market trends. If the price is above the pivots, the trend is upward, and if below the pivots, the trend is downward.
Trading with the ACD strategy in forex is possible using the ACD indicator. This indicator is a technical tool used to measure the balance between supply and demand in the market. By analyzing trading volume and price, this indicator helps traders identify trend strength and suitable entry and exit points.
To use the ACD indicator, consider the following :
Identifying strong trends: The ACD indicator can help you identify strong and stable trends in the market.
Determining entry and exit points: ACD provides buy and sell signals to enter or exit trades at the best possible time.
Bullish Setup :
When the "A up" line is broken, it is advisable to wait for some time to ensure that this is not a "Fake Breakout" and that the price stabilizes above this line.
After entering the trade, the best stop loss you can choose is below the "A down" line. However, it is recommended to test this in backtests to achieve the best results. The suitable reward-to-risk ratio for this strategy is 1, which should also be backtested.
Bearish Setup :
When the "A down" line is broken, it is advisable to wait for some time to ensure that this is not a "Fake Breakout" and that the price stabilizes below this line.
After entering the trade, the best stop loss you can choose is above the "A up" line. However, it is recommended to test this in backtests to achieve the best results. The suitable reward-to-risk ratio for this strategy is 1, which should also be backtested.
🔵 Setting
NDay Pivot Range Period : Using this entry you can specify the number of days to calculate NDay Pivot Range.
Show Daily Pivot Range : Set the Daily Pivot color and displayed or not.
Show NDay Pivot Range : Set the NDay Pivot color and displayed or not.
ATR Period Levels : Determining the period of the ATR indicator, which is used to determine the A and C levels.
Show Tokyo ACD Setup : Set the Tokyo ACD Setup color and displayed or not.
Tokyo Opening Range Time : The amount of time taken to determine the opening range. You can set this number between 5 and 60 minutes.
Tokyo Session : Market start and end time.
A Level Multiplier : The coefficient that is multiplied by ATR to determine the distance of line A up and A down.
C Level Multiplier : The coefficient that is multiplied by ATR to determine the distance of line C up and C down.
The same settings exist for the London and New York sessions.

Support and Resistance (High Volume Boxes) [ChartPrime]Support and Resistance (High Volume Boxes)
◆ Overview:
The "Support and Resistance" indicator identifies key support and resistance levels using pivot points and volume analysis. It visually represents these levels with dynamically colored boxes, indicating the strength of the volume. This helps traders recognize potential price reversals and key zones for buy and sell opportunities.
◆ Key Features:
Dynamic Support and Resistance Boxes:
The indicator plots support and resistance boxes based on pivot points and volume above threshold for positive volume boxes and below lower threshold for negative volume boxes.
Box colors change from transparent to more intense based on volume, reflecting the strength of support or resistance.
Boxes expands until a new box of the same type appears.
Volume-Based Color Coding:
Boxes are color-coded based on the amount of volume:
Green boxes indicate support levels with positive volume.
Red boxes indicate resistance levels with negative volume.
Hold Signals:
Green diamonds (◆) indicate when support holds, signaling potential buy opportunities.
Red diamonds (◆) indicate when resistance holds, signaling potential sell opportunities.
Breakout Labels:
If the price falls below a support level, that level will become resistance. If the price rises above a resistance level, it will often become support. As the price moves past a level of support or resistance, it is thought that supply and demand has shifted, causing the breached level to reverse its role.
Labels "Break Sup" and "Break Res" are displayed when support or resistance levels are broken, indicating significant market movements.
◆ Break Resistance:
◆Break Support:
◆ Usage Notes:
This indicator helps traders identify strong support and resistance levels, offering visual cues for potential price reversals.
By analyzing volume at these levels, traders can gauge the strength of these zones and make more informed trading decisions.
◆ Settings:
Lookback Period: The number of bars to look back for pivot points.
Delta Volume Filter Length: The length of the volume filter for more accurate volume analysis. (Higher input, will filter low volume boxes)
Adjust Box Width: Adjusts the width of the support and resistance boxes.
This indicator is designed to enhance your trading by providing clear visual cues for support and resistance levels based on volume, making it easier to spot potential price reversals and key trading opportunities.

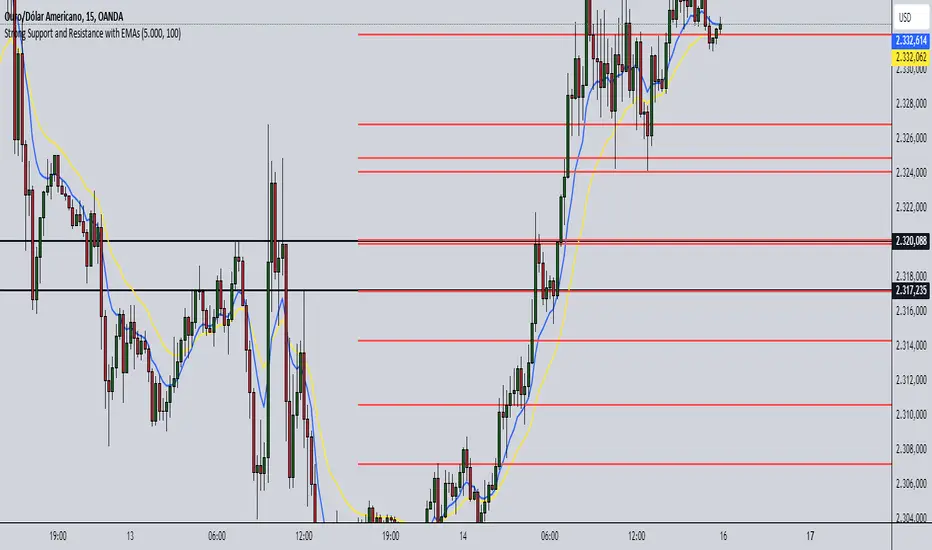
Strong Support and Resistance with EMAs @viniciushadek
### Strategy for Using Continuity Points with 20 and 9 Period Exponential Moving Averages, and Support and Resistance
This strategy involves using two exponential moving averages (EMA) - one with a 20-period and another with a 9-period - along with identifying support and resistance levels on the chart. Combining these tools can help determine trend continuation points and potential entry and exit points in market operations.
### 1. Setting Up the Exponential Moving Averages
- **20-Period EMA**: This moving average provides a medium-term trend view. It helps smooth out price fluctuations and identify the overall market direction.
- **9-Period EMA**: This moving average is more sensitive and reacts more quickly to price changes, providing short-term signals.
### 2. Identifying Support and Resistance
- **Support**: Price levels where demand is strong enough to prevent the price from falling further. These levels are identified based on previous lows.
- **Resistance**: Price levels where supply is strong enough to prevent the price from rising further. These levels are identified based on previous highs.
### 3. Continuity Points
The strategy focuses on identifying trend continuation points using the interaction between the EMAs and the support and resistance levels.
### 4. Buy Signals
- When the 9-period EMA crosses above the 20-period EMA.
- Confirm the entry if the price is near a support level or breaking through a resistance level.
### 5. Sell Signals
- When the 9-period EMA crosses below the 20-period EMA.
- Confirm the exit if the price is near a resistance level or breaking through a support level.
### 6. Risk Management
- Use appropriate stops below identified supports for buy operations.
- Use appropriate stops above identified resistances for sell operations.
### 7. Validating the Trend
- Check if the trend is validated by other technical indicators, such as the Relative Strength Index (RSI) or Volume.
### Conclusion
This strategy uses the combination of exponential moving averages and support and resistance levels to identify continuity points in the market trend. It is crucial to confirm the signals with other technical analysis tools and maintain proper risk management to maximize results and minimize losses.
Implementing this approach can provide a clearer view of market movements and help make more informed trading decisions.
Intellect_city - Halvings Bitcoin CycleWhat is halving?
The halving timer shows when the next Bitcoin halving will occur, as well as the dates of past halvings. This event occurs every 210,000 blocks, which is approximately every 4 years. Halving reduces the emission reward by half. The original Bitcoin reward was 50 BTC per block found.
Why is halving necessary?
Halving allows you to maintain an algorithmically specified emission level. Anyone can verify that no more than 21 million bitcoins can be issued using this algorithm. Moreover, everyone can see how much was issued earlier, at what speed the emission is happening now, and how many bitcoins remain to be mined in the future. Even a sharp increase or decrease in mining capacity will not significantly affect this process. In this case, during the next difficulty recalculation, which occurs every 2014 blocks, the mining difficulty will be recalculated so that blocks are still found approximately once every ten minutes.
How does halving work in Bitcoin blocks?
The miner who collects the block adds a so-called coinbase transaction. This transaction has no entry, only exit with the receipt of emission coins to your address. If the miner's block wins, then the entire network will consider these coins to have been obtained through legitimate means. The maximum reward size is determined by the algorithm; the miner can specify the maximum reward size for the current period or less. If he puts the reward higher than possible, the network will reject such a block and the miner will not receive anything. After each halving, miners have to halve the reward they assign to themselves, otherwise their blocks will be rejected and will not make it to the main branch of the blockchain.
The impact of halving on the price of Bitcoin
It is believed that with constant demand, a halving of supply should double the value of the asset. In practice, the market knows when the halving will occur and prepares for this event in advance. Typically, the Bitcoin rate begins to rise about six months before the halving, and during the halving itself it does not change much. On average for past periods, the upper peak of the rate can be observed more than a year after the halving. It is almost impossible to predict future periods because, in addition to the reduction in emissions, many other factors influence the exchange rate. For example, major hacks or bankruptcies of crypto companies, the situation on the stock market, manipulation of “whales,” or changes in legislative regulation.
---------------------------------------------
Table - Past and future Bitcoin halvings:
---------------------------------------------
Date: Number of blocks: Award:
0 - 03-01-2009 - 0 block - 50 BTC
1 - 28-11-2012 - 210000 block - 25 BTC
2 - 09-07-2016 - 420000 block - 12.5 BTC
3 - 11-05-2020 - 630000 block - 6.25 BTC
4 - 20-04-2024 - 840000 block - 3.125 BTC
5 - 24-03-2028 - 1050000 block - 1.5625 BTC
6 - 26-02-2032 - 1260000 block - 0.78125 BTC
7 - 30-01-2036 - 1470000 block - 0.390625 BTC
8 - 03-01-2040 - 1680000 block - 0.1953125 BTC
9 - 07-12-2043 - 1890000 block - 0.09765625 BTC
10 - 10-11-2047 - 2100000 block - 0.04882813 BTC
11 - 14-10-2051 - 2310000 block - 0.02441406 BTC
12 - 17-09-2055 - 2520000 block - 0.01220703 BTC
13 - 21-08-2059 - 2730000 block - 0.00610352 BTC
14 - 25-07-2063 - 2940000 block - 0.00305176 BTC
15 - 28-06-2067 - 3150000 block - 0.00152588 BTC
16 - 01-06-2071 - 3360000 block - 0.00076294 BTC
17 - 05-05-2075 - 3570000 block - 0.00038147 BTC
18 - 08-04-2079 - 3780000 block - 0.00019073 BTC
19 - 12-03-2083 - 3990000 block - 0.00009537 BTC
20 - 13-02-2087 - 4200000 block - 0.00004768 BTC
21 - 17-01-2091 - 4410000 block - 0.00002384 BTC
22 - 21-12-2094 - 4620000 block - 0.00001192 BTC
23 - 24-11-2098 - 4830000 block - 0.00000596 BTC
24 - 29-10-2102 - 5040000 block - 0.00000298 BTC
25 - 02-10-2106 - 5250000 block - 0.00000149 BTC
26 - 05-09-2110 - 5460000 block - 0.00000075 BTC
27 - 09-08-2114 - 5670000 block - 0.00000037 BTC
28 - 13-07-2118 - 5880000 block - 0.00000019 BTC
29 - 16-06-2122 - 6090000 block - 0.00000009 BTC
30 - 20-05-2126 - 6300000 block - 0.00000005 BTC
31 - 23-04-2130 - 6510000 block - 0.00000002 BTC
32 - 27-03-2134 - 6720000 block - 0.00000001 BTC

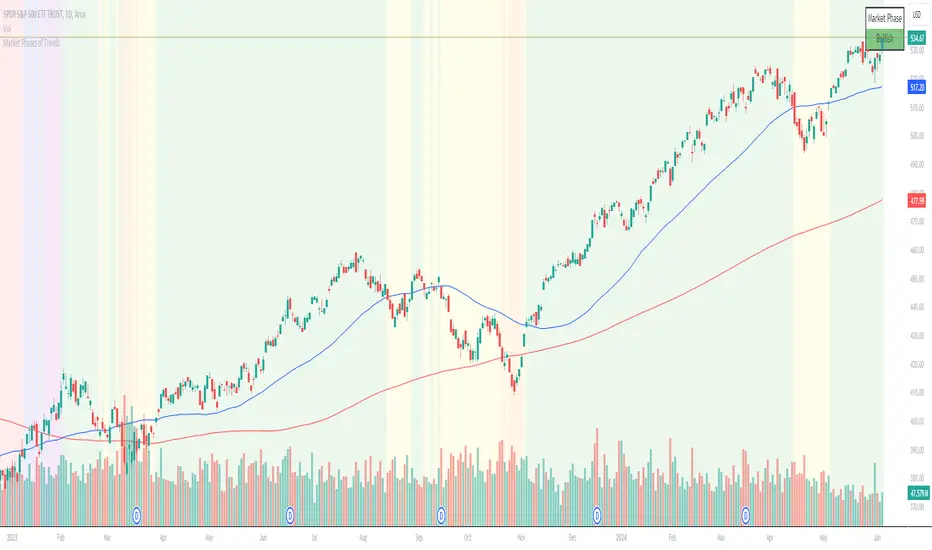
Chuck Dukas Market Phases of Trends (based on 2 Moving Averages)This script is based on the article “Defining The Bull And The Bear” by Chuck Duckas, published in Stocks & Commodities V. 25:13 (14-22); (S&C Bonus Issue, 2007).
The article “Defining The Bull And The Bear” discusses the concepts of “bullish” and “bearish” in relation to the price behavior of financial instruments. Chuck Dukas explains the importance of analyzing price trends and provides a framework for categorizing price activity into six phases. These phases, including recovery, accumulation, bullish, warning, distribution, and bearish, help to assess the quality of the price structure and guide decision-making in trading. Moving averages are used as tools for determining the context preceding the current price action, and the slope of a moving average is seen as an indicator of trend and price phase analysis.
The six phases of trends
// Definitions of Market Phases
recovery_phase = src > ma050 and src < ma200 and ma050 < ma200 // color: blue
accumulation_phase = src > ma050 and src > ma200 and ma050 < ma200 // color: purple
bullish_phase = src > ma050 and src > ma200 and ma050 > ma200 // color: green
warning_phase = src < ma050 and src > ma200 and ma050 > ma200 // color: yellow
distribution_phase = src < ma050 and src < ma200 and ma050 > ma200 // color: orange
bearish_phase = src < ma050 and src < ma200 and ma050 < ma200 // color red
Recovery Phase : This phase marks the beginning of a new trend after a period of consolidation or downtrend. It is characterized by the gradual increase in prices as the market starts to recover from previous losses.
Accumulation Phase : In this phase, the market continues to build a base as prices stabilize before making a significant move. It is a period of consolidation where buying and selling are balanced.
Bullish Phase : The bullish phase indicates a strong upward trend in prices with higher highs and higher lows. It is a period of optimism and positive sentiment in the market.
Warning Phase : This phase occurs when the bullish trend starts to show signs of weakness or exhaustion. It serves as a cautionary signal to traders and investors that a potential reversal or correction may be imminent.
Distribution Phase : The distribution phase is characterized by the market topping out as selling pressure increases. It is a period where supply exceeds demand, leading to a potential shift in trend direction.
Bearish Phase : The bearish phase signifies a strong downward trend in prices with lower lows and lower highs. It is a period of pessimism and negative sentiment in the market.
These rules of the six phases outline the cyclical nature of market trends and provide traders with a framework for understanding and analyzing price behavior to make informed trading decisions based on the current market phase.
60-period channel
The 60-period channel should be applied differently in each phase of the market cycle.
Recovery Phase : In this phase, the 60-period channel can help identify the beginning of a potential uptrend as price stabilizes or improves. Traders can look for new highs frequently in the 60-period channel to confirm the trend initiation or continuation.
Accumulation Phase : During the accumulation phase, the 60-period channel can highlight that the current price is sufficiently strong to be above recent price and longer-term price. Traders may observe new highs frequently in the 60-period channel as the slope of the 50-period moving average (SMA) trends upwards while the 200-period moving average (SMA) slope is losing its downward slope.
Bullish Phase : In the bullish phase, the 60-period channel showing a series of higher highs is crucial for confirming the uptrend. Additionally, traders should observe an upward-sloping 50-period SMA above an upward-sloping 200-period SMA for further validation of the bullish phase.
Warning Phase : When in the warning phase, the 60-period channel can provide insights into whether the current price is weaker than recent prices. Traders should pay attention to the relationship between the price close, the 50-period SMA, and the 200-period SMA to gauge the strength of the phase.
Distribution Phase : In the distribution phase, traders should look for new lows frequently in the 60-period channel, hinting at a weakening trend. It is crucial to observe that the 50-period SMA is still above the 200-period SMA in this phase.
Bearish Phase : Lastly, in the bearish phase, the 60-period channel reflecting a series of lower lows confirms the downtrend. Traders should also note that the price close is below both the 50-period SMA and the 200-period SMA, with the relationship of the 50-period SMA being less than the 200-period SMA.
By carefully analyzing the 60-period channel in each phase, traders can better understand market trends and make informed decisions regarding their investments.
MTF Bollinger BandWidth [CryptoSea]The MTF Bollinger BandWidth Indicator is an advanced analytical tool crafted for traders who need to gauge market volatility and trend strength across multiple timeframes. This powerful indicator leverages the Bollinger BandWidth concept to provide a comprehensive view of price movements and volatility changes, making it ideal for those looking to enhance their trading strategies with multi-timeframe analysis.
Key Features
Multi-Timeframe Analysis: Allows users to monitor Bollinger BandWidth across various timeframes, providing a macro and micro perspective on market volatility.
Pivot Point Detection: Identifies crucial high and low pivot points, offering insights into potential support and resistance levels. Pivot points are dynamic and adjust based on the timeframe viewed, reflecting short-term fluctuations or longer-term trends.
Customizable Parameters: Includes options to adjust the length of the moving average, the standard deviation multiplier, and more, enabling traders to tailor the tool to their specific needs.
Dynamic Color Coding: Utilizes color changes to indicate different market conditions, aiding in quick visual assessments.
In the example below, notice how changes in BBW across different timeframes provide early signals for potential volatility increases or decreases.
How it Works
Calculation of BandWidth: Measures the percentage difference between the upper and lower Bollinger Bands, which expands or contracts based on market volatility.
High and Low Pivot Tracking: Automatically calculates and tracks the pivots in BBW values, which are critical for identifying turning points in market behavior. High and low levels will change depending on the timeframe, capturing distinct market behaviors from granular movements to broad trends.
Visual Alerts and Table Display: Highlights significant changes in BBW with visual alerts and provides a detailed table view for comparison across timeframes.
In the example below, BBW identifies a significant contraction followed by an expansion, suggesting a potential breakout.
Application
Strategic Market Entry and Exit: Assists traders in making well-informed decisions about when to enter and exit trades based on volatility cues.
Trend Strength Assessment: Helps in determining the strength of the prevailing market trend through detailed analysis of expansion and contraction periods.
Adaptable to Various Trading Styles: Suitable for day traders, swing traders, and long-term investors due to its customization capabilities and effectiveness across different timeframes.
The MTF Bollinger BandWidth Indicator is a must-have in the arsenal of traders who demand depth, accuracy, and responsiveness in their market analysis tools. Enhance your trading decisions by integrating this sophisticated indicator into your strategy to navigate the complexities of various market conditions effectively.

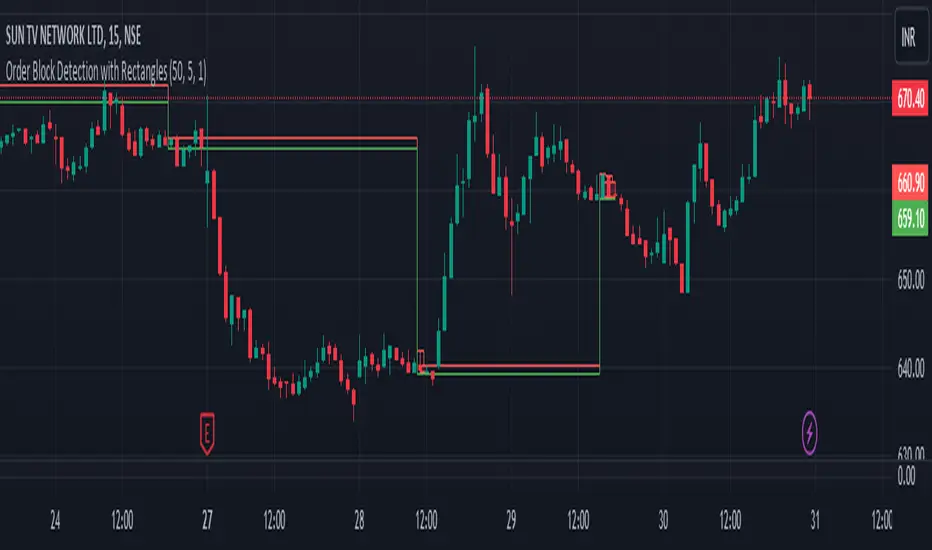
Order Block Detection By Zia (StockWiz)What is an Order Block?
An order block is a concept used in technical analysis, particularly in price action trading and supply and demand analysis. It refers to a significant area on a price chart where institutional traders, such as banks and hedge funds, have placed large orders. These blocks of orders often create strong support or resistance levels, as they represent areas where the "smart money" has shown interest in buying or selling an asset.
Characteristics of Order Blocks:
1. High Volume: Order blocks are typically associated with high trading volume, indicating strong participation from large players in the market.
2. Price Rejection: They often lead to sharp reversals or consolidations in price, as the large orders absorb the market's liquidity and push the price in the opposite direction.
3. Formation: Order blocks are usually formed after significant price movements, such as strong bullish or bearish trends, and can be identified by clusters of candles with long wicks or significant body sizes.
4. Support and Resistance: Once identified, order blocks can serve as potential support or resistance levels in future price movements. Prices often return to these areas, where new orders can be executed.
Identifying Order Blocks:
To identify order blocks, traders look for specific patterns and price actions on the chart. Here is a step-by-step guide to finding order blocks:
1. Identify a Strong Move: Look for strong bullish or bearish moves, which are often the result of large institutional orders.
2. Find Consolidation : After the strong move, find areas where the price consolidates. This is where large orders were likely placed.
3. Look for Rejections: Identify areas where the price has been rejected multiple times, creating a clear support or resistance zone.
4. Mark the Order Block: Draw a rectangle around the consolidation area to mark the order block on your chart.
Student of Parag Mehta (StockWiz)
With Regards
Zia Rahim
Weighted Moving Range with Trend Signals (WMR-TS)Weighted Moving Range with Trend Signals (WMR-TS)
Technical analysis involves analyzing statistical trends from trading activity , such as price movement and volume, to make trading decisions. Technical indicators are mathematical calculations based on the price, volume, or open interest of a security or contract. They are used by traders to analyze price movements and predict future market behavior. The WMR-TS indicator combines weighted moving averages and range calculations to identify key trading levels and generate buy/sell signals. It dynamically adjusts to market conditions, offering traders insights into potential support, resistance, and trend reversal points. Key levels are color-coded for quick interpretation. It utilizes weighted moving averages (WMA) and range calculations to determine these levels, making it a robust tool for both trending and ranging markets.
SUMMARY
Parameters :
WMA Length : Determines the length for the primary weighted moving average.
Highest High Length : Sets the period for calculating the highest high.
Lowest Low Length : Sets the period for calculating the lowest low.
Range Corrector : Adjusts the range calculation slightly for fine-tuning.
Top Level : Multiplier for determining the top level from the calculated range.
Bottom Level : Multiplier for determining the bottom level from the calculated range.
Levels Visibility : Sets how many recent bars will display the levels.
Trading Zones :
Short Area : Highlighted zone indicating potential shorting opportunities.
Long Area : Highlighted zone indicating potential buying opportunities.
The Levels :
Wave (Yellow): Midpoint of the calculated range, adjusted by WMA.
Top Level (Red): Calculated upper boundary of the trading range.
Sell Level (Pink): Intermediate sell level.
Resistance Level (Magenta): Immediate resistance level.
Support Level (Cyan): Immediate support level.
Buy Level (Light Green): Intermediate buy level.
Bottom Level (Dark Green): Calculated lower boundary of the trading range.
Interpreting the Signals :
Hammer Signal : Red circles above bars indicate potential sell signals.
Rocket Signal : Green circles below bars indicate potential buy signals.
KEY CONCEPTS
Highest High and Lowest Low :
These values represent the highest high ( HH ) and lowest low ( LL ) over a specified number of periods.
Support Level :
This is the lower boundary of the trading range. It is a price level where demand is strong enough to prevent the price from falling further. As the price approaches the support level, it is likely to bounce back up.
Resistance Level :
This is the upper boundary of the trading range. It is a price level where supply is strong enough to prevent the price from rising further. As the price approaches the resistance level, it is likely to pull back down.
THE USE OF MULTIPLIERS :
The script uses several multipliers to adjust and fine-tune the calculated support and resistance levels, as well as to control the range and sensitivity of these levels. Here is a detailed explanation of these multipliers and their purpose:
Range Corrector : This multiplier adjusts the calculated high ( H ) and low ( L ) levels, adding flexibility to how these levels are positioned relative to the highest high and lowest low. It ranges from -1 to 1 , with a default value of 0 . The use of positive values increase the range, making the calculated levels further apart. Thus, using negative values decrease the range, bringing the calculated levels closer together.
Top Level : This multiplier adjusts the distance of the top level from the calculated high H ) level. It fluctuates from 0 to 2 , with a default value of 0.382 . Higher values will push the top level further above the high level, while lower values will bring it closer.
Bottom Level : This multiplier adjusts the distance of the bottom support level from the calculated low support level. Ranging from 0 to 2, with a default value of 0.214, the higher values will push the bottom level further below the low level, while lower values will bring it closer.
The script plots the support and resistance levels on the chart, allowing traders to visualize the trading range. Color-coded zones are used to indicate areas where buying or selling opportunities may arise based on the current price relative to the trading range. A trading range refers to the area between a price's support and resistance levels over a specific period of time. Within this range, the price of the security fluctuates up and down but does not break out above the resistance or below the support. Support and resistance levels to make trading decisions. Buying near the support level and selling near the resistance level is a common strategy. When the price moves above the resistance level, it is called a breakout . A breakout often indicates that the price may start a new upward trend . Conversely, when the price moves below the support level, it is called a breakdown . A breakdown often indicates that the price may start a new downward trend . By understanding and utilizing trading ranges, traders can make more informed decisions, optimize their trading strategies, and manage risk more effectively.
Understanding Moving Averages
A moving average (MA) is a widely used technical indicator that helps smooth out price data by creating a constantly updated average price. The main purpose of using a moving average is to identify the direction of the trend and to reduce the "noise" of random price fluctuations. The Weighted Moving Average ( WMA ) assigns different weights to each period, with more recent periods typically given more weight. A 10-day WMA might give the most recent day a weight of 10, the second most recent day a weight of 9, and so on. It is useful for traders who want to emphasize recent price data more than older data. When the price is above the moving average, it suggests an Bullish trend . A Bearish Trend is expected to take place when the price is below the moving average. Understanding the price reactions around these levels can be used to make trading decisions.
APPLYING CONCEPTS
Support and Resistance Calculations in the Script :
The script calculates dynamic support and resistance levels using weighted moving averages ( WMA s) and the highest high and lowest low over specified periods. Buy ( Rocket ) and sell ( Hammer ) signals are generated based on the crossing of the price with calculated top and bottom levels.These signals help traders identify potential entry and exit points within the trading range .
Weighted Moving Average (WMA) Application in the Script
This script calculates a special trendWMA using the close price that helps in creating a more dynamic moving average that considers both high and low price actions. This modified WMA is used in conjunction with highest high and lowest low values over specified periods to calculate dynamic support and resistance levels.
Explanation of the Levels in the Script
By understanding these levels, traders can make more informed decisions about where to enter and exit trades, manage risk, and anticipate potential market movements. The script incorporates several key levels levels that traders can use to better anticipate price movements and make more informed trading decisions. Leveraging the principles of Fibonacci retracement ratios ( 23.6%, 38.2%, 50%, 61.8%, and 100% ) to identify key support and resistance zones can also serve for gauging the overall market sentiment.
Top Level and Sell Leve l: Used to identify potential resistance zones where the price may reverse or pause.
Support Level and Buy Level : Used to identify potential support zones where the price may bounce.
Upper and Lower Pivot Values : Serve as intermediate levels for possible price retracements or extensions within the trading range.
Wave Level : Indicates the central trend direction, which can be useful for gauging the overall market sentiment.
Alerts are a crucial part of the script as they notify traders of potential buy and sell signals based on predefined conditions. There are two main alerts: one for a " Hammer " signal (sell condition) and one for a " Rocket " signal (buy condition).
Adjust the input parameters to fit your trading style and the specific asset being analyzed. Shorter lengths may be more responsive to price changes but can produce more false signals , while longer lengths provide smoother signals but may lag . Always backtest the indicator on historical data to understand its behavior and performance. Also remember that different markets may require different parameter settings for optimal performance.
Keep in mind that by nature like all moving averages, WMAs lag behind price action. This means that signals may be delayed. The indicator performs differently in various market conditions. Always consider the overall market context when interpreting signals.
Adjusting parameters like the range corrector and visibility can help tailor the indicator to specific market conditions or trading strategies, improving its effectiveness. The script uses the calculated levels to plot lines and fill zones on the chart, helping traders visualize potential support, resistance, and trend reversal points. The use of multipliers allows for dynamic adjustment of these levels, making the indicator flexible and adaptable to different market conditions.
I think traders can make more informed decisions about where to enter and exit trades, manage risk, and anticipate potential market movements following this code. Stay safe and always remember that market is always changing. Use this tool if you want, please stay informed and plan safe trades,
D.

ICT Setup 01 [TradingFinder] FVG + Liquidity Sweeps/Hunt Alerts🔵 Introduction
The ICT (Inner Circle Trader) style of trading involves analyzing the behavior of market participants and market makers to identify areas where fake buy and sell activities occur. This trading style helps retail traders align with market maker behavior and avoid falling into market traps.
A key aspect of the ICT strategy is focusing on liquidity hunts. This involves searching for trading opportunities in areas of the market with low liquidity or where other traders have little activity. The ICT method leverages market inefficiencies and weaknesses, allowing traders to profit from small price movements that might go unnoticed by others.
In "ICT Setup 01," our focus is on these liquidity areas and stop hunts that form in Fair Value Gaps (FVGs). Trading within FVGs, combined with confirmations from "Hunts" and "Sweeps," can enhance trader performance.
🔵 How to Use
The presence of Fair Value Gaps (FVGs) in the market indicates rapid, powerful movements likely caused by the influx of smart money. When the price returns to these levels, a market reaction is expected.
Combining this with the complex and deceptive behavior of smart money—such as "Liquidity Sweeps" and "Stop Hunts"—forms an ICT-based price action setup that we expect to perform well.
Components of "ICT Setup 01" :
● Fair Value Gap (FVG)
● Premium and Discount
● Hunts / Sweeps
Whenever the price returns to an FVG area and reacts in such a way that only the wicks of the candles remain in the area and the candle bodies are outside the FVG, the first condition for creating the setup is met.
If subsequent candles hunt the wick that has penetrated the deepest into the FVG, a buy or sell signal is issued. In the format where hunting is based on Sweeps, penetrations that extend even outside the area are considered signals, provided they do not form a body within the area.
Additionally, a refining system exists for cases where a candle body forms in the area, optimizing the proximal levels of the FVG.
Bullish Setup :
Bearish Setup :
🔵 Features and Settings of "ICT Setup 01"
You can Find out more in Setting :
● FVG Detector Multiplier Factor
● FVG Validity Period
● Level in Low-Risk Zone
● Issuing Signals Method
● Number of Signals Allowed from a Zone
● Signal after Hunts/Sweeps
● How Many Hunts/Sweeps
● Show or Hide
● Alert Sender
FVG Detector Multiplier Factor :
This feature allows you to determine the size of the moves forming the FVGs based on the ATR (Average True Range). The default value is 1 to identify the majority of setups. You can increase this value according to the symbol and market you are trading in to achieve better results.
FVG Validity Period :
This shows the validity period of an FVG based on the number of candles. By default, an FVG area is valid for up to 15 candles. However, you can increase or decrease this period.
Level in Low-Risk Zone :
This feature helps reduce your risk. The method works by identifying the entire length of the three candles forming the FVG and dividing it into two equal areas. The upper area is "Premium," and the lower area is "Discount." To reduce risk, it is better for "Demand FVG" to be in the "Discount" and "Supply FVG" in the "Premium." This feature is off by default.
Issuing Signals Method :
This feature allows you to specify whether the hunt should occur only within the FVG area or if the wicks can extend outside the area.
If set to "Hunts," only signals where the wicks are within the area are issued, and the area loses its validity if the wicks extend outside.
In "Sweeps" mode, wicks can extend outside the area as long as they do not form a body within the area.
Number of Signals Allowed from a Zone :
This feature allows you to specify how many valid signals can be issued from one area.
Signal after Hunts/Sweeps :
In markets or symbols with a tendency for frequent stop hunts, this feature allows you to specify how many hunts should occur before you receive a signal to avoid receiving potentially failed signals.
How Many Hunts/Sweeps :
Enter the number of hunts you want to set for the "Signal after Hunts/Sweeps" feature here.
Show or Hide :
The number of setups formed may be very large, and displaying all of them on the chart can be distracting and messy. By default, only the last setup is displayed, but if you want to see all setups, you can turn on the relevant options.
Alert Sender :
You cannot constantly monitor multiple charts to identify trading opportunities. Using the alert sending feature can save time and improve performance.
Alerts Name : Customize the alert name to your preference.
Message Frequency : Determines the frequency of alert messages. Options include 'All' (triggers every time the function is called), 'Once Per Bar' (triggers only on the first call within the bar), and 'Once Per Bar Close' (triggers only on the final script execution of the real-time bar upon closure). The default is 'Once per Bar.'
Show Alert Time by Time Zone : Configure the alert messages to reflect any chosen time zone. For instance, input 'UTC+1' for London time. The default is 'UTC.'
By configuring these settings, traders can effectively utilize ICT setups to improve their trading strategies and outcomes.

Turbo Oscillator [RunRox]Introducing Turbo Oscillator by RunRox, our new indicator that combines a multitude of useful and unique features, which we will detail in this post.
List of Advanced Technologies:
Real-Time Divergences: Detects discrepancies between price movements and oscillator indicators to forecast potential price reversals.
Real-Time Hidden Divergences: We identify hidden divergences in real-time. These are not the standard type of divergences; they are opposite to regular divergences, providing unique insights into potential market movements.
Overbought and Oversold Zones: Identifies areas where the market is potentially overextended, suggesting possible entry and exit points.
Signal Line: Indicates the market direction, helping traders to quickly understand current trends.
Money Flow Histogram: Shows the flow of money into and out of the market, providing insights into buying and selling pressure.
Predicted Reversal Zones: Pinpoints areas where the market might experience reversals, aiding in strategic planning and risk management. These zones also serve as potential areas for taking profits, enhancing their utility for exit strategy planning.
Customizable Alerts: You can flexibly set up alerts for any events detected by our indicator, ensuring you stay informed about critical market movements.
To begin with, I would like to describe the difference between classic divergences and hidden divergences.
As you can see, these are opposite situations. Our oscillator identifies both types of divergences and displays them in real-time.
Divergences can serve as points where the price might reverse in the opposite direction, making both classic and hidden divergences powerful tools for spotting reversal points. I'll show a few examples of how divergences are used in our oscillator.
Classic Divergences - which we identify in real-time. As you can see, the price often reacts strongly to the formation of these divergences, frequently changing its direction.
Hidden Divergences - we also observe frequent movement in the opposite direction on the chart. The advantage of our indicator is that we show divergences in real-time without delays, allowing you to react immediately to trend changes.
Overbought and Oversold Zones - These zones allow you to see trend changes when the price is clearly overbought or oversold. When the color changes from a contrasting shade to a neutral one, you can observe the trend shift. The lines work by combining the positivity/negativity of the histogram, the positivity/negativity of the signal line, and the direction of the signal line (red/green). This sophisticated interaction provides precise insights into market conditions, making it an invaluable tool for traders.
Signal Line - This provides insights into trend changes and price reversals. The points on the line better indicate the beginning of a trend shift. These points can vary in size, offering a clearer understanding of the strength of the emerging trend. This feature works in combination with RSI, Stochastic, and MFI. RSI and MFI are top-tier indicators, while Stochastic adds responsiveness and sensitivity to trend changes, ensuring you capture every market movement accurately and promptly.
Money Flow Histogram - As shown in the example, our histogram displays the divergence between money flow and the actual price. You can see that while the price is rising, the money flow is decreasing, indicating insufficient demand for the asset and an imminent trend change. This feature uses MFI with an extended period, providing a more comprehensive and accurate analysis of market conditions. The extended period enhances the reliability of the Money Flow Index, making it an essential tool for identifying subtle shifts in market dynamics.
Predicted Reversal Zones - We automatically identify potential price reversal zones and display them above our overbought and oversold zones. In cases of strong overbought or oversold conditions, we detect potential price pullbacks and mark the beginning of a trend change. This helps you better identify trend shifts. We recommend considering these zones as potential take profit points for your trades.
Customizable Alerts - Our flexible alert system allows you to receive notifications only for the events you are interested in. These can include:
1. Classic Divergences
2. Hidden Divergences
3. Overbought or Oversold conditions on the status line
4. Strong Overbought or Oversold conditions on the status line
5. Signals from the signal line
6. Reversal zones in any direction
Our oscillator is a unique indicator that provides a comprehensive understanding of price movements. It can be used as a standalone tool for analyzing price action.
Here are a few examples of using our Oscillator in practice:
In the example above, you can see three conditions that have formed for a potential trade:
1. Clear overbought condition with a formed reversal point.
2. Decreasing Money Flow Index diverging from the rising price.
3. Formed classic divergence.
The entry point could be the formed divergence, while the exit point could be the overbought condition at the bottom of the oscillator along with the reversal points.
Here's another example of using hidden divergence, where you can see three conditions for a potential trade:
1. Overbought zone
2. Formed hidden divergence
3. Start of bearish movement indicated by the signal line
You can enter the trade either when the hidden divergence forms or wait for confirmation of the trend change by the signal line and enter the trade when the corresponding signal forms on the signal line. The exit point could be the opposite reversal point or the formation of a new hidden divergence.
We have demonstrated a few examples of how you can use our indicator, but we are confident that you will find many more applications in your own strategies.
Oscillator offers a variety of customizable parameters to tailor the indicator to your trading preferences. Here’s what our settings include:
Signal Line
Turn On/Off: Enable or disable the signal line.
Length: Set the length period for the signal line calculation.
Smooth: Adjust the smoothing level of the signal line for more accurate display.
Histogram
Turn On/Off: Enable or disable the histogram.
Length: Set the length period for the histogram calculation.
Smooth: Adjust the smoothing level of the histogram.
Other
Show Divergence Line: Display divergence lines on the chart.
Show Hidden Divergence: Display hidden divergences.
Show Status Line: Show the status line indicating overbought or oversold conditions.
Show TP Signal: Display signals for take profit.
Show Reversal Points: Display potential trend reversal points.
Delete Broken Divergence Lines: Remove broken divergence lines from the chart.
Alerts Customization
Signal Line Bull/Bear: Set alerts for bullish or bearish signals from the signal line.
TP Bull/Bear: Set alerts for take profit signals.
Status Bull/Bear: Set alerts for bullish or bearish status conditions.
Status Bull+/Bear+: Set enhanced alerts for stronger bullish or bearish status conditions.
Divergence Bull/Bear: Set alerts for bullish or bearish divergences.
Hidden Divergence Bull/Bear: Set alerts for hidden bullish or bearish divergences.
With these comprehensive settings, you can fine-tune the Oscillator to perfectly fit your trading strategy and preferences.
Our indicator utilizes technologies such as RSI, Stochastic, and Money Flow Index, with numerous enhancements from our team. It includes exclusive features such as real-time detection of hidden and classic divergences, identification of reversal points using our unique methodology, and much more.
Disclaimer:
While we consider our Turbo Oscillator to be an excellent tool, it is important to understand that past performance is not indicative of future results. We recommend approaching market analysis comprehensively, using a combination of tools and techniques to make well-informed trading decisions. Always consider the full range of market data and risks when using any trading indicator.

KillZones Hunt + Sessions [TradingFinder] Alert & Volume Ranges🟣 Introduction
🔵 Session
Financial markets are divided into various time segments, each with its own characteristics and activity levels. These segments are called sessions, and they are active at different times of the day.
The most important active sessions in financial markets are :
1. Asian Session
2. European Session
3. New York Session
The timing of these major sessions based on the UTC time zone is as follows :
1. Asian Session: 23:00 to 06:00
2. European Session: 07:00 to 16:30
3. New York Session: 13:00 to 22:00
Note
To avoid overlap between sessions and interference in kill zones, we have adjusted the session timings as follows :
• Asian Session: 23:00 to 06:00
• European Session: 07:00 to 14:25
• New York Session: 14:30 to 22:55
🔵 Kill Zones
Kill zones are parts of a session where trader activity is higher than usual. During these periods, trading volume increases and price fluctuations are more intense.
The timing of the major kill zones based on the UTC time zone is as follows :
• Asian Kill Zone: 23:00 to 03:55
• European Kill Zone: 07:00 to 09:55
• New York Morning Kill Zone: 14:30 to 16:55
• New York Evening Kill Zone: 19:30 to 20:55
This indicator focuses on tracking the kill zone and its range. For example, once a kill zone ends, the high and low formed during it remain unchanged.
If the price reaches the high or low of the kill zone while the session is still active, the corresponding line is not drawn any further. Based on this information, various strategies can be developed, and the most important ones are discussed below.
🟣 How to Use
There are three main ways to trade based on the kill zone :
• Kill Zone Hunt
• Breakout and Pullback to Kill Zone
• Trading in the Trend of the Kill Zone
🔵 Kill Zone Hunt
According to this strategy, once the kill zone ends and its high and low lines no longer change, if the price reaches one of these lines within the same session and is strongly rejected, a trade can be entered.
🔵 Breakout and Pullback to Kill Zone
According to this strategy, once the kill zone ends and its high and low lines no longer change, if the price breaks one of these lines strongly within the same session, a trade can be entered on the pullback to that level.
Trading in the Trend of the Kill Zone
We know that kill zones are areas where high-volume trading occurs and powerful trends form. Therefore, trades can be made in the direction of the trend. For example, when an upward trend dominates this area, you can enter a buy trade when the price reaches a demand order block.
🟣 Features
🔵 Alerts
You can set alerts to be notified when the price hits the high or low lines of the kill zone.
🔵 More Information
By enabling this feature, you can view information such as the time and trading volume within the kill zone. This allows you to compare the trading volume with the same period on the previous day or other kill zones.
🟣 Settings
Through the settings, you have access to the following options :
• Show or hide additional information
• Enable or disable alerts
• Show or hide sessions
• Show or hide kill zones
• Set preferred colors for displaying sessions
• Customize the time range of sessions
• Customize the time range of kill zones

ZigZag Smart Trend [TradingFinder] Major & Minor Structured Wave🔵 Introduction
🟣 Zigzag
Zigzag is a lagging indicator; this indicator identifies points on a price chart that have more significant changes than its previous wave and then by connecting these lines to each other, it assists traders in trend detection.
This indicator reduces random price fluctuations and attempts to make the primary price trend clearer.
🟣 Pivot
Pivots are points where the price chart changes direction. Pivots, also called reversal points, form when supply and demand forces dominate one another.
Different types of technical analysis pivots can be introduced into two categories, minor pivots, and major pivots, each of which has a specific meaning in analysis.
Major Pivot : These pivots actually indicate major changes in the direction of the chart and occur at the end of trends. Analysts seeking to reach the primary analysis focus more on major pivot points. In fact, most technical analysis tools are examined and determined based on major pivots.
Minor Pivot : This type of pivot focuses more on small and subsidiary points and directions. Therefore, it occurs at the end of corrections. Analysts focusing on minor pivots represent small trends, and it should be noted that minor pivots are not suitable for use in primary technical tools.
How to identify minor and major pivots :
Minor pivots are pivots formed between two major pivots and fail to break the opposite major pivot.
Major pivots are pivots that have either successfully broken the opposite pivot or have moved more than the previous pivot of the same type.
🔵 How to use
Based on identifying pivots and drawing zigzag lines, you can have various uses for this indicator.
Identifying support and resistance levels :
Identifying Elliott Waves :
Identifying classic patterns :
Identifying pivots with higher validity :
Identifying internal and external breakouts :
Identifying trends and range areas :
Identifying pivot types along with major and minor recognition :
MHH : Major Higher High
MLH : Major Lower High
MLL : Major Lower Low
MHL : Major Higher Low
mHH : Minor Higher High
mLH : Minor Lower High
mLL : Minor Lower Low
mHL : Minor Higher Low
🔵 Settings
Pivot Period Zigzag Line : Using this input, you can determine the pivot period for identifying zigzag swings.
Show Zigzag Line : To show or not to show the zigzag line.
Zigzag Line Color : Change the color of the zigzag line.
Zigzag Line Style : Change the Style of the zigzag line.
Zigzag Line Width : Change the Width of the zigzag line.
Show Label : To show or not to show Pivot Type.
Color Label : Change the color of the Pivot Type Label.
