Previous Cycle Range + SMTs [bilal x shpat]Inspired by ICT (Inner Circle Trader) concepts
Description made by ChatGPT
Thank you shpat.a for making the SMT option
📝 Overview
The Previous Cycle Range + SMTs indicator is a multi-timeframe tool designed to visualize key market structure levels derived from the previous trading cycle’s range — a concept heavily utilized in ICT-style analysis.
In addition to the traditional range levels, this indicator adds Smart Money Tool (SMT) detection, allowing traders to identify bullish or bearish divergences across multiple correlated assets, giving an edge in spotting potential turning points and liquidity imbalances.
It helps traders identify equilibrium levels, liquidity zones, and potential premium/discount areas based on the prior day (or any chosen period) high and low — now with intermarket divergence insights.
⚙️ Features
Custom Cycle Length: Define your own cycle in minutes (e.g., 1440 = 1 day, 10080 = 1 week).
Previous High/Low: Automatically plots the previous cycle’s high and low levels.
Equilibrium (EQ): Optional 50% midpoint line to highlight the market’s equilibrium.
Quarter Levels: Adds 25% and 75% range lines for refined premium/discount analysis.
Extended Ranges: Optional extended levels (e.g., -100%, +200%) to identify continuation or retracement targets.
Fib Levels (1.272 & 1.618): Adds ICT-style Fibonacci extension levels for confluence zones.
Smart Money Tool (SMT) Detection:
Detects bullish or bearish divergences between your main asset and up to two comparison symbols.
Highlights potential SMT zones with optional text labels for quick visualization.
Optional SMT summary table displays divergence status for all three assets.
Custom Styling: Full control over colors, line width, label style, and extension distance.
💡 How It Helps
This indicator aligns with ICT principles by making the previous day’s range visible and actionable, now with SMT divergence insights:
The previous day’s high/low often act as liquidity pools.
The equilibrium (EQ) represents fair value — useful for spotting premium/discount zones.
Quarter levels and Fibonacci extensions add precision when mapping market structure and potential reaction points.
SMT detection helps traders identify early divergence signals that may indicate upcoming bullish or bearish moves across correlated markets.
🔍 Example Uses
Identify where price is trading relative to the previous session’s range.
Use EQ and quarter levels to gauge premium vs. discount conditions.
Spot intermarket divergences using SMTs to anticipate potential reversal or continuation points.
Combine with other ICT-based tools (e.g., PD arrays, dealing ranges, or kill zones) for refined trade setups.
חפש סקריפטים עבור "fib"

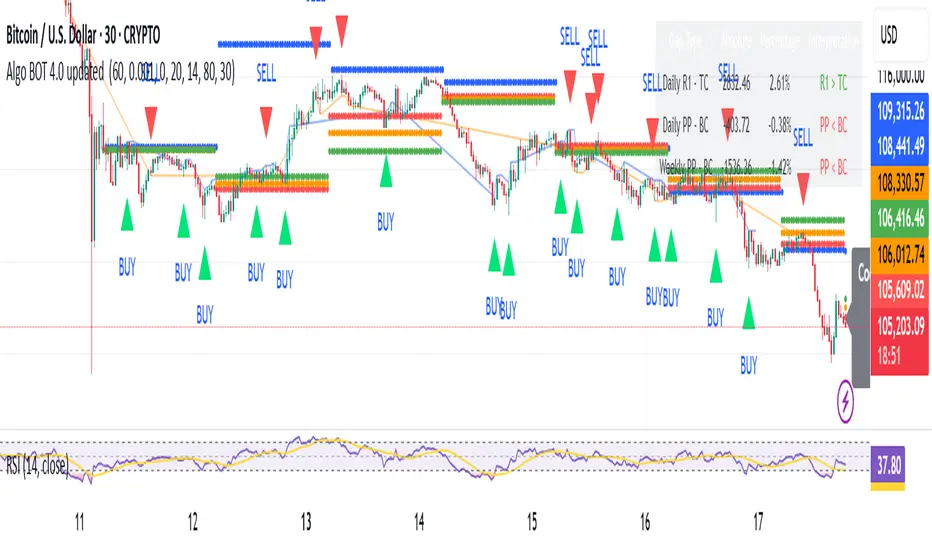
Algo BOT 4.0 updated Strategy Description:
Algo BOT 4.0 updated is a sophisticated multi-timeframe trading strategy that identifies high-probability reversal points using technical confluence. The strategy combines:
Core Components:
Multi-timeframe Pivot Analysis: Daily, Weekly, and Monthly pivot points with CPR (Central Pivot Range)
RSI Momentum Filter: Higher timeframe RSI (user-configurable) for trend bias
VWAP Dynamics: Volume-weighted average price with moving averages
Fibonacci Strength Analysis: Candle close positions relative to 38.2% Fib levels
Advanced Cooldown System: Prevents overtrading with dynamic gap requirements
Entry Logic:
Long Entries: RSI < 57 with bullish candle structure at key support levels
Short Entries: RSI > 43 with bearish candle structure at key resistance levels
Zone-based Filtering: Identifies trades near significant pivot points (D PP, D R1, D S1, W PP, M PP, VWAP)
Risk Management:
Dynamic cooldown periods between trades
Gap-based entry optimization to ensure sufficient price movement
Extreme price tracking for better entry timing
Multi-condition validation to reduce false signals
Alert System:
Real-time alerts for both long and short entries
Includes price, RSI value, and zone information
Visual signals with triangle markers on chart
Comprehensive status monitoring with cooldown timer
Swing Points & Liquidity — ENHANCED PRO (Dark/Light Mode)This indicator — “Swing Points & Liquidity — ENHANCED PRO (Dark/Light Mode)” — automatically detects and visualizes swing highs, swing lows, and liquidity levels on the chart with rich analytics and customizable visuals.
🔍 Core Features
Smart Swing Detection: Identifies pivot highs/lows based on adjustable left/right bar settings.
Liquidity Visualization: Draws dynamic boxes and lines for liquidity pools and swing zones.
Volume & OI Integration: Filters and colors levels using volume and Open Interest Δ (change).
Strength Meter: Highlights strong liquidity levels with color gradients based on OI + volume intensity.
Automatic Trendlines: Connects swing points with selectable style and width.
Fibonacci Mapping: Automatically projects fib retracements (23.6%, 38.2%, 50%, 61.8%, 78.6%) from swing-to-swing for confluence zones.
Statistics Panel: Displays live metrics — total levels, active/filled count, success rate, and average strength.
Alerts System: Alerts for new swing formations and when price touches or breaks a level.
Multi-Timeframe Option: Analyze swing structures from higher timeframes on any chart.
Dual Theme Mode: Fully optimized for both Dark and Light interface preferences.
⚙️ Advanced Options
Adjustable lookback range
Hide or extend filled levels
Configurable volume and OI thresholds
Supports multiple OI data sources (Binance, BitMEX, Kraken)
Fully dynamic text, color, and label alignment settings
💡 Use Case
Perfect for Smart Money Concept (SMC) and ICT-style analysis, liquidity sweeps, and swing-based trading.
Traders can quickly visualize where liquidity sits, track how it gets filled, and monitor structure shifts in real time.

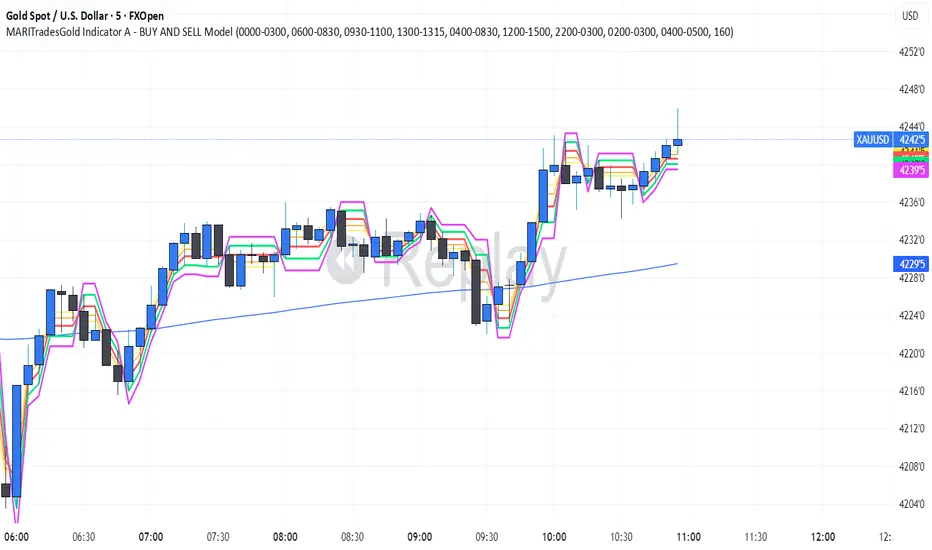
MARITradesGold Indicator A - BUY AND SELL ModelThe MARITrades Gold Indicator A – BOS Model is a professional charting tool designed to help traders visually identify structure breaks (BOS) and potential Fibonacci retracement zones during key market sessions on XAU/USD.
It combines session timing filters, Break of Structure logic, and a WMA160 trend bias to help users study clean continuation or reversal setups with precision.
This indicator is intended for traders who are learning or refining their market structure and session-based gold strategy.
KEY FEATURES AND HOW TO USE
Apply the indicator to XAU/USD on a preferred timeframe
Wait for a Break of Structure (BOS) during valid session hours.
Watch for retracement into 0.5–0.618 Fib levels for possible continuation zones which are marked out with coloured lines. you can edit the colours to your preference
Confirm direction with Moving average160 trend bias.
Use Stop loss and take profit levels for educational visualization — not for direct trade execution.
you can keep the indicator free or lines which optional to view the BUY and SELL signals
📊 BOS Detection: Marks bullish or bearish structure breaks after key levels.
📈 Fibonacci Zones: Auto-calculates retracement zones and gives you signal bias
🕒 Session Filters: Includes Sydney, Asian, London, and New York session timing tools.
🧭 Trend Filter: Moving Average (MA160) helps define directional bias.
🧩 Clean Visualization: retracement zones, and structure markers for chart clarity.
🚨 Optional Alerts: Alerts can be added when structure breaks align with session filters.
Optimal Retracement📘 Optimal Retracement
Fibonacci Retracement Confluence Indicator
(Protected Source)
🧭 Overview
Optimal Retracement is a clean, professional Fibonacci retracement engine that finds price cluster zones where multiple retracements from recent swings align within a tight range. It mirrors the minimalist style of your projection tool: single horizontal lines, right-edge labels with ratio and price, optional price-scale markers, and a clustering core that designates one Prime retracement level with spaced Secondary levels.
⚙️ Core Features
Automatic Trend Bias
Select Auto (EMA-based), Up, or Down to focus calculations on the relevant swing direction.
Swing-Based Anchoring (Non-Repainting)
Builds swing legs from confirmed pivots (left/right bars), scanning a user-defined number of recent swings before computing retracement sets.
Fibonacci Retracements (Boroden)
Standard ratios: 0.236, 0.382, 0.500, 0.618, 0.786
• Up bias (Low→High): computes pullback support below the high.
• Down bias (High→Low): computes pullback resistance above the low.
Cluster Engine (Confluence Finder)
Groups nearby retracement levels within a tick-based tolerance, selects the highest-overlap Prime Cluster, and filters Secondary targets using a minimum spacing rule—keeping charts crisp and readable.
Smart Visualization
• One line per level, extending right a fixed length (configurable).
• Compact right-edge labels (ratio + exact price).
• Optional price-scale markers (Prime + up to two Secondaries).
• Distinct colors/widths for Prime vs Secondary levels.
Alerts Built-In
• Near Prime Cluster — when price approaches the Prime zone.
• Crossed Prime Cluster — when price breaks through the Prime zone.
(Optional runtime alerts include symbol, timeframe, and price.)
🎯 How to Use
Timeframe: Works on any TF; many prefer 1H–Daily for structure.
Bias: Set Auto, Up, or Down to align with trend context.
Swings: Tune Pivot Left/Right and Swings to Scan (e.g., 5–8).
Ratios: Toggle which retracement ratios to include.
Clustering: Adjust Cluster Tolerance (ticks), Min Members, and Min Spacing to instrument volatility/tick size.
Read: Use the Prime retracement cluster as your decision zone; Secondaries offer alternates if Prime is invalidated.
Alerts: Enable Near / Cross alerts to automate monitoring.
💡 Why It’s Different
Basic fib tools draw static lines from one swing. Optimal Retracement aggregates retracements across multiple recent swings and performs mathematical clustering to isolate the most overlapped zone. You get fewer lines, higher informational density, and an objective Prime level—a clean pullback map that pairs perfectly with projection/extension tools.
🔐 Protected Source Notice
Published as a Protected Script to preserve proprietary clustering, swing selection, and visualization design. All calculations, alerts, and visuals are fully functional while the core logic remains secured, consistent with TradingView’s standards for unique, non-trivial scripts.
⚠️ Disclaimer
For educational and analytical purposes only. This tool does not constitute financial advice or performance guarantees. Always perform independent analysis and manage risk appropriately.
🏷 Credits
Methodology inspired by Carolyn Boroden’s Fibonacci work (retracements & price clusters), adapted into a modern, cluster-driven retracement workflow with a minimal chart footprint.
Algo BOT 4.0 Strategy Description:
Algo BOT 4.0 is a sophisticated multi-timeframe trading strategy that identifies high-probability reversal points using technical confluence. The strategy combines:
Core Components:
Multi-timeframe Pivot Analysis: Daily, Weekly, and Monthly pivot points with CPR (Central Pivot Range)
RSI Momentum Filter: Higher timeframe RSI (user-configurable) for trend bias
VWAP Dynamics: Volume-weighted average price with moving averages
Fibonacci Strength Analysis: Candle close positions relative to 38.2% Fib levels
Advanced Cooldown System: Prevents overtrading with dynamic gap requirements
Entry Logic:
Long Entries: RSI < 57 with bullish candle structure at key support levels
Short Entries: RSI > 43 with bearish candle structure at key resistance levels
Zone-based Filtering: Identifies trades near significant pivot points (D PP, D R1, D S1, W PP, M PP, VWAP)
Risk Management:
Dynamic cooldown periods between trades
Gap-based entry optimization to ensure sufficient price movement
Extreme price tracking for better entry timing
Multi-condition validation to reduce false signals
Alert System:
Real-time alerts for both long and short entries
Includes price, RSI value, and zone information
Visual signals with triangle markers on chart
Comprehensive status monitoring with cooldown timer
AriVestHub_SMCIntroduction to the AriVestHub_SMC Indicator
The AriVestHub_SMC indicator is designed and coded based on Smart Money Concepts (SMC). This tool has unique features that you won’t find in any other indicator built around SMC.
I’ve been active in the crypto market since 2019, and besides using the SMC strategy, I also apply several custom strategies in my trading. Personalized versions of these strategies will gradually be shared with you as well.
The main reason for developing this indicator was the gap in existing tools. Many times, setups like Valid Pullback or Inside Bar Candles appear on the chart but are not easily recognizable at first glance, and therefore they get ignored. This often leads to mistakes in Market Structure Mapping right from the beginning, which then causes errors in further analysis and predictions.
Since the SMC strategy is entirely built on market structure, any mistake in identifying its key components basically destroys the reliability of the analysis.
Unlike similar indicators that mostly just draw nice lines and zones on the chart for promotional purposes, AriVestHub_SMC aims to show the reality of the market, not beautify it. Price behavior is the result of trader psychology and the clash of different views—it doesn’t have to look neat and pretty all the time.
This indicator shows exactly what has happened in the market and the possible scenarios ahead. Once you use this tool and study this guide, you’ll clearly feel the difference compared to other common indicators. My main goal in creating AriVestHub_SMC was to give real help to traders—not just to sell or commercialize it.
The AriVestHub_SMC indicator is basically a Market Structure Mapping Engine (SMC Structure Mapping Engine), whose main task is to detect and accurately map market structure movements.
The market is full of exceptional conditions, and analyzing them without indicators and only by visual inspection is almost impossible. This often leads to errors, especially in strategies that are based on market structure.
One of the most important and valuable features of this indicator compared to similar ones is that, after extensively studying and manually analyzing various charts with indicators, I have coded almost all common scenarios as well as exceptional cases that occur under different market conditions.
________________________________________
Its key features include:
• BOS / CHoCH – Detecting
• breakouts and changes in market character
• IDM / Pullback – Confirming pivots and valid moves
• OF / OB – Marking key supply and demand zones
• SMT (Smart Money Trap) – Spotting invalid zones and smart money traps
• Liquidity Sweeps / Equal High-Low – Liquidity hunts and reversal setups
• Transfer Option – Automatically correcting structure in Single Leg scenarios
________________________________________
Basic Concepts in the AriVestHub_SMC Strategy
1. Inside Bar
An Inside Bar is a candle (or group of candles) whose price range falls between the High and Low of the previous candle.
In Smart Money and market structure analysis, these candles are usually ignored, and only the main candle is considered.
Simply put, an Inside Bar signals market pause and energy buildup—a place where both buyers and sellers are waiting for price to decide its next direction.
In the picture, you can see candles highlighted in a different color that fall within the main candle range. They should not be treated as independent candles, and all of them together should be considered as one.
________________________________________
2. Pullback
A pullback happens when price makes a temporary return after a main move. Even a single candle can cause it.
In Smart Money, a valid pullback is defined as:
• In an uptrend: if the Low of a candle breaks the Low of the previous candle which is not an Inside Bar, a valid pullback occurs.
• In a downtrend: if the High of a candle breaks the High of the previous candle which is not an Inside Bar, a valid pullback occurs.
Valid pullbacks are the points where the market gathers the energy needed to continue its move.
In the image below, both valid and invalid pullbacks are shown.
________________________________________
3. IDM – Inducement
Inducement is one of the most important concepts in AriVestHub_SMC. Without IDM, no structure in Smart Money can form.
Every valid pullback can be considered an IDM.
There are two types: Major IDM and Minor IDM.
Correctly identifying IDM is critical, because the entire market structure is mapped based on it.
After each BOS or CHoCH, a new HH or LL pivot is only confirmed if the price returns and touches the IDM.
• In an uptrend after BOS: the lowest price of the first valid pullback is the Major IDM, and the last pullback before reaching the Major IDM is the Minor IDM.
• In an uptrend after CHoCH: the highest price of the first valid pullback is the Major IDM, and the last pullback before reaching the Major IDM is the Minor IDM.
The same rules apply in reverse for downtrends.
In this strategy, Major IDM always takes priority.
The image shows different types of IDM, and the same applies for downtrends.
________________________________________
4. BOS – Break of Structure
A Break of Structure happens when price breaks its previous High or Low in the direction of the trend:
• In an uptrend: if the previous HH is broken, BOS occurs.
• In a downtrend: if the previous LL is broken, BOS occurs.
BOS confirms continuation of the current market trend.
________________________________________
5. CHoCH – Change of Character
Change of Character occurs when price moves against the previous trend:
• In an uptrend: if the previous LL is broken, CHoCH occurs.
• In a downtrend: if the previous HH is broken, CHoCH occurs.
CHoCH is usually a signal of a trend reversal or a deep market correction.
The image shows the overall market structure with BOS and CHoCH.
________________________________________
6. Order Flow
Order Flow zones are formed from valid pullbacks and are usually points where price reacts strongly.
They are defined as:
• In an uptrend: Last Selling Momentum Before pushing upside
• In a downtrend: Last Buying Momentum Before pushing dowside
Three main types of Order Flow used in this strategy:
• OF: Decisional (Dec) – The first valid OF after IDM, where the market makes its key decision.
• OF: Extreme (Ext) – The last valid OF after IDM, acting as the final defense of buyers or sellers.
• SMT – Smart Money Trap – All order zones before IDM, and those between Dec and Ext. These usually cause short-term, deceptive reactions and are not valid for trading.
In addition:
• Unmitigated Order Flow – A zone not yet touched, still a liquidity source.
• Mitigated Order Flow – A zone that has been touched, with reduced validity.
• Redefine Order Flow – Identifying internal OFs within a main unmitigated OF for more precise entries.
The image shows the different types of OF.
________________________________________
7. H/L Liquidity Sweep
A Liquidity Sweep happens when price breaks a previous High or Low with a wick, but the candle body fails to close beyond it.
• If the High is broken with a wick but the candle closes below it, a Liquidity Sweep occurs.
• If the Low is broken with a wick but the candle closes above it, a Liquidity Sweep occurs.
These setups are often signs of trapping traders and starting a move in the opposite direction. In fact, Liquidity Sweep points are among the best trading setups.
________________________________________
🔑 Final Note
All these concepts are like puzzle pieces: Inside Bar, Valid Pullback, IDM, BOS, CHoCH, Order Flow, and Liquidity Sweep.
When combined, they create a clear and accurate picture of the market’s real behavior.
________________________________________
Indicator Settings
1. Analyze From … To …
• Set the analysis time range.
• Another use: In ping-pong structures, you can add another copy of the indicator to the chart, set the starting point at the recent HH or LL, and map the internal structure for counter-trend trading.
________________________________________
2. Main
• Confirm CHoCH with wicks → If enabled, only the wick (not the body) is considered for BOS and CHoCH confirmation. Useful for spotting subtle liquidity-based breaks.
• Major / Minor IDM → Choose IDM type.
• Consider Inside Bar → Best kept enabled, so candles inside the previous candle are ignored.
________________________________________
3. Fib Ret
• Min pullback retracement % → Set the minimum retracement level.
• Helps identify valid pullbacks and gives more confidence in trend continuation.
• Meaning: if BOS happens, price must at least retrace by the minimum percentage before expecting the trend to continue.
________________________________________
4. BOS/CHoCH
• Display BOS and CHoCH on the chart with customizable color and style.
________________________________________
5. IDM
• Mark previous IDM : Show past IDMs.
• Mark live IDM : Show current active IDM.
• Customize IDM display options.
________________________________________
6. Pivots
• Display HH and LL pivots.
________________________________________
7. Transferring H/L IDM BOS/CHoCH
• Transfer in case of lack idmB or idmS → When the move is Single Leg and no valid IDM exists in the recent move, HH, LL, and IDM must be shifted and corrected. This adjusts the market structure.
• In case of transferring, remove all previous transferred Market Structure → If enabled, every time HH/LL and IDM need to be shifted, the transfer happens and the market structure is re-analyzed from scratch.
• Important: Often after one transfer, another Single Leg appears. This option keeps adjusting structure automatically, while doing it manually would be slow and error-prone.
________________________________________
8. Order Flow
• Display Decisional, Extreme, and Supply/Demand OFs.
________________________________________
9. H/L Sweeps
• Detect Liquidity Sweeps at Highs and Lows.
• These are very strong reversal setups.
________________________________________
10. Equal High/Low
• Show equal Highs and Lows where liquidity often accumulates.
________________________________________
11. Moving Average
• Add a moving average as a trend filter.
• Option to choose type (SMA/EMA) and length (e.g., 50 or 200).
• Usually:
o MA50 → For mid-term trends, quick confirmation.
o MA200 → For long-term trends, stronger confirmation.
________________________________________
12. Internal Structure (ZigZag)
• Show internal market structure as ZigZag.
________________________________________
13. Inside Bar Candles
• Display Inside Bars in color or with a box.

alsubihi.2Advanced Market Structure Indicator
This custom-built indicator provides an in-depth analysis of market structure changes to help traders identify key price levels, trends, and potential reversals. It combines multiple tools to give you a clearer picture of market behavior and improve your decision-making process.
Key Features:
Break of Structure (BOS):
The BOS indicator identifies significant changes in market structure, marking when the price breaks previous highs or lows, signaling a potential trend shift. Green lines represent upward breaks (bullish trend), while red lines show downward breaks (bearish trend).
Change of Character (Choch):
This feature helps to highlight subtle shifts in market dynamics. A change in character (Choch) indicates when the market transitions between bullish or bearish behavior. Green indicates a bullish character change, while red shows a bearish one.
Premium vs Discount Zones:
The indicator identifies price levels that are considered 'Premium' (high price levels) and 'Discount' (low price levels), assisting traders in recognizing overbought or oversold conditions and making better trading decisions based on market conditions.
Support and Resistance Levels:
Automatically drawn support and resistance lines are included to show critical price areas where reversals or breakouts might occur, helping traders anticipate price action.
Equilibrium Zone:
This is the price level where supply and demand balance out, acting as a key reference point for identifying potential market reversals or continuation.
Why Use This Indicator?
This all-in-one tool helps traders make informed decisions by combining multiple technical analysis concepts into a single, easy-to-use indicator. It reduces the complexity of analyzing price action and allows traders to quickly identify potential entry and exit points with greater accuracy.
Whether you are an experienced trader or just starting, this indicator provides you with the essential tools needed to identify trend shifts, key support and resistance zones, and price extremes, leading to more profitable trading decisions.
14 سبتمبر
ملاحظات الأخبار
📌 Summary of the Indicator
Market Structure (MS):
Detects swing & internal BOS, CHoCH, CHoCH+. Can color candles or bars by trend.
Multi-Timeframe Scanner (MTF):
Shows trend direction on multiple TFs (5m → 1W).
Highs/Lows (HTF):
Plots previous Day/Week/Month/Year highs & lows as liquidity levels.
Order Blocks (OB):
Draws volumetric order blocks, with filters (BOS/CHoCH), overlap rules, mitigation, and volume metrics.
Fair Value Gaps (FVG/VI/OG):
Detects price imbalances, extends them, and removes when mitigated.
Accumulation/Distribution Zones:
Highlights Wyckoff-style accumulation (green) or distribution (red).
Equal Highs/Lows (EQH/EQL):
Marks liquidity pools at equal highs or lows.
Premium/Discount Bands:
Splits swing range into premium, equilibrium, and discount zones.
RSI & ADX:
Momentum filters for overbought/oversold and trend strength.
DEMA-ATR Baseline:
Adaptive EMA with ATR constraints; alerts for trend shifts.
Regression Channel:
Auto-fits best regression length using Pearson-R, shows channel with std bands.
Fibonacci Ladder:
Auto plots levels 0.236 → 1.618 based on recent swing.
👉 In short: it’s a full SMC toolkit — structure + liquidity + OB/FVG + momentum filters + extra tools (fib, regression, ATR baseline).
📌 ملخص المؤشر
البنية الهيكلية (Market Structure):
يحدد BOS و CHoCH داخلي وسوينغ، ويقدر يلوّن الشموع حسب الاتجاه.
سكانر متعدد الأطر (MTF):
يعرض الاتجاه على عدة فريمات من 5m إلى 1W.
هاي/لو من أطر عليا (HTF Highs/Lows):
يرسم قمم وقيعان اليوم/الأسبوع/الشهر/السنة السابقة (مناطق سيولة).
بلوكات الطلب/العرض (Order Blocks):
يرسم بلوكات مع فلاتر (BOS/CHoCH)، خيارات تداخل، إزالة عند الكسر، ويعرض حجم التداول بداخلها.
الفجوات السعرية (FVG/VI/OG):
يحدد الفجوات غير المغطاة، يمددها، ويحذفها عند التغطية.
مناطق التجميع/التوزيع:
يوضح مناطق Wyckoff (أخضر للتجميع، أحمر للتوزيع).
قمم وقيعان متساوية (EQH/EQL):
يميز مناطق السيولة فوق القمم أو تحت القيعان المتساوية.
مناطق Premium/Discount/Equilibrium:
يقسم آخر نطاق إلى مناطق غالية (Premium)، توازن (Equilibrium)، ورخيصة (Discount).
RSI و ADX:
مؤشرات إضافية لقياس التشبع وقوة الاتجاه.
خط DEMA-ATR:
EMA متكيف مع قيود ATR، يتغير لونه حسب الاتجاه، مع تنبيهات جاهزة.
قناة الانحدار (Regression):
تختار أفضل طول باستخدام معامل الارتباط Pearson-R، وترسم قناة مع انحراف معياري.
فيبوناتشي (Fibonacci):
يرسم مستويات 0.236 حتى 1.618 حسب آخر حركة سعرية.
👉 باختصار: المؤشر هو أداة SMC متكاملة تجمع الهيكل، السيولة، البلوكات، الفجوات، والمؤشرات المساعدة.
Force of Strategy (FoS, Multi TF/TA, Backtest, Alerts)Introducing the FoS Trading System
A comprehensive and innovative solution designed for both novice and experienced traders to enhance their intraday trading.
The basic idea of creating this script is to stay profitable in any market
Key Features:
There are over 25 no-repaint strategies for generating buy and sell signals to choose from
10 symbols for simultaneous trading
Webhook alerts in TTA format (tradingview to anywhere) pre-configured to send messages for trading cross-margin futures on major Crypto Exchanges: Binance, Bitget, BingX, Bybit, GateIO and OKX
A unique automated "Strategy switcher" feature for backtesting and live trading—not just a specific strategy, but the logic behind choosing a trading one or another strategy based on backtesting data obtained in real time
Advanced risk management options and backtest result metrics
Higher Timeframe filters (Technical Rating, ADX, Volatility) and ability for check backtest results with 9 main higher timeframes
Buy and sell signals are generated using TradingView Technical Ratings, indicators with adaptive length algorithms and various classic indicators with standard settings to avoid overfitting
Next, I will describe in detail what this script does and what settings it operates with:
"All Strategies" off
- In the global settings block, as shown in the main chart screenshot, you select how long the script will perform backtests in days, with a limitation on the number of bars for calculations. This limitation is necessary to maintain an acceptable calculation speed. You also choose which two higher timeframes we will use for signal and filters when confirming the opening of trades
- With "All Strategies" off - as in the example on the main chart screenshot, trading is carried out by strategy #1 on 10 selected tickers simultaneously. By default, I selected the 9 top-capitalized cryptocurrencies on the Bitget exchange and the chart symbol. You can change that choice of 9 non chart opened instruments and # strategy for each them
- The first row in the table 1 shows some of the main choosen script settings, in attached example: initial capital 20$, leverage 50L, 20 backtest days, 3$ is invest in one deal, 60m - is chart timeframe, next 60m is higher timeframe 1 and last 90m is higher timeframe 2. In first column you see shortened to 5 characters ticker names
- The exchange name in the second row determines the alert messages format
I've attached another example of trading with setting "All strategies" off in the image below. In this example, trading 10 standard symbols on an hourly timeframe, 2 coins from 10: 1000SATS and DOGE have generated a profit of over $65 over the past 20 days using strategy #4
Can you browse a wide range of trading instruments and select the 10 best strategies and settings for future trading? Of course, trading is what this script is do!
The parameters in the table 1 mean the following:
TR - count of closed trading deals
WR - Winning Rate, PF - Profit Factor
MDD - Max Draw Down for all calculated time from initial capital
R$ - trading profit result in usd
The parameters in the table 2 is just more metrics for chart symbol:
PT - result in usd Per one Trade
PW - result Per Win, PL - result Per Lose
ROI - Rate of Investments
SR - Sharpe Ratio, MR - CalMAR ration
Tx - Commision Fee in Usd
R$ - trading profit result in usd again
Table 2 separate trade results of backtesting for longs and shorts. In first column you see how many USD were invested in one trade, taking into account possible position splitting (will be discussed in more detail in the risk management section)
Settings:
"All Strategies" on, "Check Last" off
When "All Strategies" is active, trading changed from 10 symbols and one strategy to all strategies and one chart symbol. If option "Check Last" is inactive you will see backtest results for each of strategy in backtest setting days. This is useful, for example, if you want to see backtest results under different settings over a long period of time for calibrating risk management or entry rules
"All Strategies" on, "Check Last" on
- If "All Strategies" and "Check Last" is active trading will occur on the chart symbol only for those strategies that meet the criteria of the settings block for the enabled "All Strategies" option. For example your criteria is: for last 5 trades for all strategies, open next trade only on strategy which reached ROI 25% and WinRate 50%. When strategy with this setting criteria receive Buy or Sell Signal this trade will be opened, and when trade will be close "check last" will repeat. This feature i called "Strategy switcher"
-In Table 1 if strategy meet criteria you will see "Ok" label, if strategy meet criteria and have maximum from other reached ROI they labeled "Best". Chart strategy labeled "Chart", Chart and Ok labels in one time is "Chart+", "Chart" and "Best" is labeled "Best+"
- The color in the first column of table 1 indicates that the strategy is currently in an open position: green means an open long position, red means an open short position.
In picture bellow you will see good example for trading with check results for last 10 trades, and make desicion for trading when criteries 0.25 ROI and WinRate 50% reached for Top 2 by ROI strategies from all list of them. This example of trading logic in last 20 days (include periods when strategy don't arise 10 trades) give a profit $30+. At the bottom of the screen, you can see Labels with the numbers of the strategies that opened the trades. In this example, trades were primarily opened using strategy number 2, and the second most effective strategy after the 20-day backtest was strategy number 9
Who can promise you'll make a profit of $30 in the next 20 days with a drawdown of no more than $8 from the initial $20 with invest in one trade just 2.7$? No one. But this script guarantees that in the future it will repeat the same logic of switching trading strategies that brought profit over the last 20 days
Risk management options
- When a buy or sell trade is opened, you'll see three lines on the chart: a red stop-loss line (SL), a green take-profit line (TP), and a blue line representing the entry price. The trade will be closed if the high price or low price reaches the line TP or SL (no wait for bar close) and alert will be triggered once per bar when script recalculates
- Several options are available to control the behavior of SL/TP lines, such as stop-loss by percentage, ATR, or Highest High (HH) and Lowest Low (LL). Take Profit can be in percent, ATR or in Risk Reward ratio. There some Trailing Stop with start trail trigger options, like ATR, percent or HH / LL
- Additionally, in risk managment settings a function has been implemented for adding a position when the breakeven level expressed in the current ROI is reached for opened trade (splitting position). The position is added within the bar.
- Webhook alerts in TTA format with message contained next info : Buy / Sell or adding Quantity, Leverage, SL price, TP price and close trade
Keep in mind if the stop-loss changed when adding a position, the stop-loss will not be able to be higher than the current bar's low price, regardless of your settings, as backtest trades do not use intra-bar data, in this situation SL will be correct at next bar (but alert message don't be sended twice). And please note that this script does not have an option to simultaneously open trades in different directions. Only 1 trade can be opened for 1 trading instrument at a time
Backtest Engine
Backtest is a very important part of this script. Here describe how its calculate:
- Profit or Loss is USD: close trade price * open trade quantity - open trade price * open trade quantity - open trade quantity * (open trade price + close trade price)/2 * commision fee
Possible slippage or alert sending delay needed to be include in commission % which you will set in risk managment settings block, default settings is 0.15% (0,06% for open, 0,06% for close and 0,03% for possible slippage or additional fees)
- Maximum Draw Down: Drawdown = (peak - current equity) / peak * 100 ;
Drawdown > maxDrawdown ? maxDrawdown = Drawdown
- ROI: profit result in USD / sum of all positions margin
- CalMAR Ratio: ROI / (-MaxDrawDown)
- Sharpe Ratio: ROI / standard deviation for (Sum of all Profits and Loses) / (Sum of all Position Margins)
This description was added because in metrics i don't use parameters like "The risk-free rate of return". Keep in mind how exactly this script calculate profit and perfomance when adjusting key criteria in the strategy switching parameters block of script settings
Strategies itself
For trading, you can enable or disable various Higher Timeframes Filters (ADX, volatility, technical rating).
With filters enabled, trades will only open when the setting parameters are reached
- Strategy number 1, 2 and 3: is Higher Timeframe TradingView Technical Ratings itself, 1 is summary total rating, 2 is oscillators and 3 is moving averages. When TR filter cross filter levels trade will be open at chart bar close. By Default on chart you see Summary Technical Rating oscillator, but here the options for change it to Oscillator TR or Moving Average TR
- Strategy number 4, 5 and 6: is Chart TimeFrame TR. Trades will open when its values (Summary, Oscillators and Moving Averages) reached setting buy sell level
- Strategy number 7, 8 and 9: is Alternative buy sell logic for Chart TimeFrame TR, trades will open when counting rising or falling values will be reached
- Strategies with number from 10 to 18: is chosen by user adaptive moving averages and oscillators indicators. There in settings you will see many different adaptive length algorithms for trading and different types of moving averages and oscillators. In tooltips in settings you will find very more information, and in settings you will see list of all indicators and algorithms (more than 30 variations). All adaptive strategies have their options in settings for calibrating and plotting
- Strategies with number from 19: its can't be chosen or calibarted, this is needed for avoid overfitting, i try to found mostly time worked strategies and use its with standard settings. In future it's possible to changing current or adding additional strategies. At the time of publication this script uses: Dynamic Swing HH LL (19), Composite indicator (20), %R Exhausting with different signals (21,22,23), Pivot Point SuperTrend (24), Ichimoku Cloud (25), TSI (26), Fib Level RSI (27). I don't plot classic strategies in this script
Let me explain, the value of this script is not in the strategies it includes, but in how exactly it collects the results of their work, how it filters the opening of trades, what risk management it applies and what strategy switching logic it performs. The system itself that you are now reading about represents the main value of this script
Finally if you get access for this script
- You will see many other not described options and possibilities like Kelly position or list of settings for adaptive strategies, also i added many usefull tooltips in script settings
Happy trading, and stay tuned for updates!
DISCLAIMER: No sharing, copying, reselling, modifying, or any other forms of use are authorized for this script, and the information published with them. This script is strictly for individual use. No one know future and Investments are always made at your own risk. I am not responsible for any losses you may incur. Please before investment make sure that chosen logic is enaugh profitable on virtual demo account.
Liquidity TriggersKey Points
Liquidity Triggers indicate:
Where liquidity-derived support levels are.
Where liquidity-derived resistance levels are.
When a large price increase is approaching via the Rip Currents .
- When a large price decrease is approaching via the Dip Currents .
Summary
Liquidity Triggers are produced by measuring liquidity and determining where supportive liquidity and resistance-liquidity are. These trigger-levels designate price-points where breakouts, breakthroughs, and bounces are anticipated.
Liquidity Triggers are dynamic, and they constantly re-evaluate liquidity conditions to determine where the next group of sellers or buyers are that can fuel rapid changes in price movement, such as initiating a trend change or stalling price-action completely.
To use, simply apply to your chart and monitor for Supportive Liquidity Triggers (LTs that are below price) for bounces, and Resistance Liquidity Triggers (LTs that are above price) for rejections.
You can also set Alerts designed specifically around the Liquidity Triggers.
Examples
Example 1: A quick look at LT Resistances and Supports. When a LT is above spot, then it is considered a resistance. When LT is below spot, it is considered a support.
Example 2: LTs can indicate to us when an upcoming Rip Current (large price appreciation) or a Dip Current (large price depreciation) is starting.
Here is an example of a Rip Current:
And here is a Dip Current:
Details
Liquidity Triggers come with a default load-out that utilizes several pre-configured settings for quick and easy start-up.
Triggers
The default triggers are labeled LT-1 through LT-7, these correspond ` orders ` that describe which type of liquidity is monitored. The two groups of traders that are monitored are the ` Eager ` and the ` Organic `.
The default triggers use the Fibonacci sequence to adjust their orders in a standardized way.
Triggers 1, 2, 3, and 4 monitor the ` Eager ` traders (with default settings) while triggers 5, 6, and 7 monitor the ` Organic `traders.
Eager Triggers represent profit-takers and dip-buyers .
When the Eager Triggers are above the price, they are ` selling the rip `, and when the Eager Triggers are below price, they are ` buying the dip `. These moments indicate growing pressure for a reversal. Eager triggers are any trigger with an order of 89 or less .
Organic Triggers represent value-seekers with long-term goals. When they are below price, they are areas of support and tend to fuel bounces, while when organic triggers that are above price are areas of resistance and often provoke rejections. Organic triggers are any trigger with an order of 90 or more .
Here's an example showing the faint eager liquidity triggers above spot, indicating profit-taking and below spot after a price-dip indicating dip-buying .
Customization
There are additional settings and configurations available to the Liquidity Triggers indicator that help customize your view of liquidity.
Smoothing
Smoothing can be applied to the triggers for a more peaceful showing. The smoothing options are:
None - Default.
Exponential-Moving Average (EMA) : Ideal for when you want the most recent activity to take higher priority.
Simple-Moving Average (SMA) : Ideal for when you want a smoother appearance but do not want to change the data too much.
Weighted-Moving Average (WMA): Ideal for when you want the smoothing to increase as the trigger order increases.
Modified-Moving Average (RMA): Produces the most smooth data.
Here is an example of how smoothing can change the appearance of LTs for easier analysis for when things get complicated:
Modifying the Default Load-out
The default loadout attempts to balance having a wide view of the data without bringing too many lines or values into the picture that might be too noisy, but these values can be added to customize and expand your view if desired.
The Fib load-out has the options with t he default load-out being .
Feel free to mix and match and explore which views you prefer when analyzing liquidity.
For example, for the extreme data-heads, you can add LDPM twice on the chart to get all of the orders displayed at once:
Liquidity Triggers - Granular Triggers
The granular trigger can be toggled on (default: off) for when candle-specific liquidity measurements desired. They can help identify which specific candles have eager and aggressive traders attempting to move spot: the further away the granular trigger is from the candle, the more force is being applied!
Manual LTs
If you’re not satisfied with the default options for triggers, you can set your own with the Manual Liquidity Triggers option.
Time-Based LTs
Time-based liquidity triggers give you a view of support and resistance triggers based off of the time chosen, rather than by an order. This allows you to construct “weekly Liquidity-Triggers” or “hourly Liquidity Triggers” to analyze and compare against.
Note: If the timeframes are too far apart, you might get an error. For instance, putting a 1-week reference LT onto a 30-second chart may not work.
Liquidity-Triggers Data-Table
With the `Display Liquidity Trigger Statuses and Values` option, you can place a data-table on the chart that will display the time-based triggers, their values, and if they are above (bearish) or below (bullish) spot.
Alerts
When you set alerts, you can determine which order is used for determining `Is bullish`, `Is Bearish`, `Has Become Bullish`, `Has Become Bearish` alerts in the LT Alert Order setting.
Several LT alerts are available to set:
Is Bullish / Bearish: these are designed to analyze conditions at the end of the candle and if spot is above the alert-trigger, then an alert is sent out that conditions are bullish, and if spot is below the alert-trigger, then an alert is sent out if conditions are bearish.
Has Become Bullish / Bearish: designed to analyze conditions at the start of a candle and determine if a change has occurred (a LT cross-over).
Suspected Rip Current: these are designed to alert you when a suspected upwards rip in price is underway, as characterized by all LT triggers moving rapidly down away from spot.
Suspected Dip Current: these are designed to alert you when a suspected downwards rip in price is underway, as characterized by all LT triggers moving rapidly up and above, away from spot.
These alerts can then be put into a webhook for external processing if desired.
Frequently Asked Questions
How can I gain access to LT?
Check out the Author's Instructions section below.
Where can I get more information?
Check out the Author's Instructions section below for how to obtain more information.
I tried to add LT to my chart but it produced an error.
Sometimes this happens but no worries. Just change the chart's interval to a different time and then back, the indicator should re-load. If that fails, try removing it completely and re-applying it.
Is it normal for LTs to have different values on different timeframes?
Yup! Think of each time-interval as a different "zoom" of the market. Imagine you are taking a picture of the ocean to figure out the direction of water movement. If you take the picture from space, you will see big general trends but if you take the photo from your boat in the harbor, you're going to get specific data about that area. That's how LT works!
The view of the liquidity depends on the "zoom-age" (the chart's interval) used when taking the photo.
I think there is an issue with the alerts - what should I do?
This is not ideal! If this happens, please reach out via the contact information in the Author's Instructions section below with the following details:
What symbol?
What timeframe?
Which alert?
When did the alert occur?
Can I attach the alerts to webhooks?
Yup! Be sure to check out TV's guide on webhooks ( T.V. Guide to Alerts ) for how to get started.
Does LT receive updates?
Yup! If a bug or issue is found, an update is pushed out. You will be notified when this occurs and it is highly recommended that you replace all charts with LT on them with the new version as the updates go out.
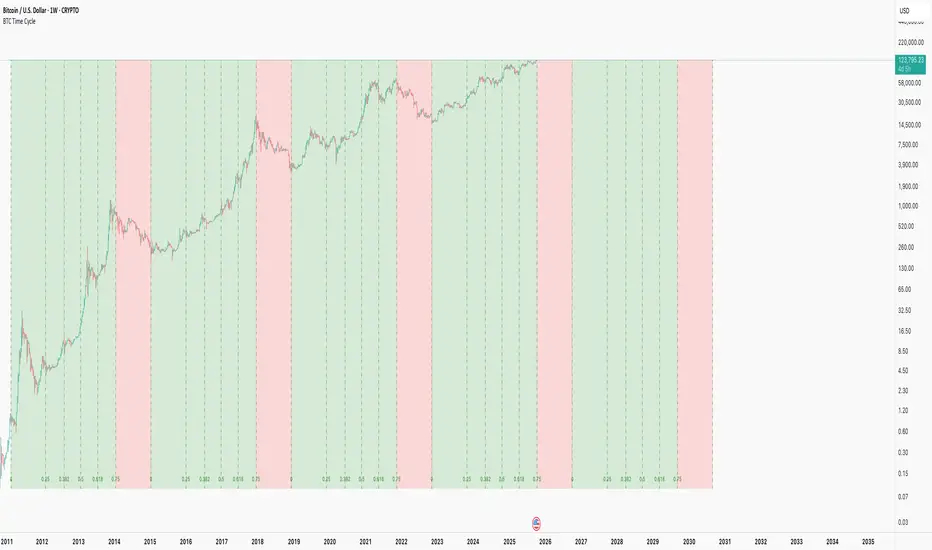
BTC Time CycleThis indicator helps track Bitcoin's historical four-year cycles by dividing time from market bottoms into Fibonacci-based segments, providing clear visual cues for potential bullish and bearish phases.
How It Works: This indicator overlays repeating Fibonacci-based time cycles onto weekly BTC charts , plotting vertical lines at key Fib ratios (0, 0.25, 0.382, 0.5, 0.618, 0.75, 1.0) to track cycle progress. Each cycle concludes at 1.0 and seamlessly resets as the next cycle's 0, capturing historical trough-to-trough intervals like those observed from 2018 to 2022. The week preceding the 0.75 Fibonacci ratio typically signals the cycle peak and bear market onset, transitioning through the final phase until 1.0 initiates a new cycle.
Disclaimer: This pattern has consistently repeated in past cycles, but financial markets are inherently unpredictable—it is not guaranteed to persist and remains valid only until disproven. Treat it as an analytical aid, not a predictive certainty.
This is merely a curiosity and is: True until it isn't™
Auto Fibonacci Retracements with Alerts [SwissAlgo]AUTO-FIBONACCI RETRACEMENT: LEVELS, ALERTS & PD ZONES
Automatically maps Fibonacci retracement levels with Premium/Discount (PD) zones and configurable alerts for technical analysis study.
------------------------------------------------------------------
FEATURES
Automatic Fibonacci Levels Detection
Identifies swing extremes (reference high and low to map retracements) from a user-defined trend start date and trend indication automatically
Calculates 20 Fibonacci levels (from -2.618 to +2.618) automatically
Dynamically updates Fib levels as price action develops, anchoring the bottom (in case of uptrends) or the top (in case of downtrends)
Detects potential Trend's Change of Character automatically
Premium/Discount (PD) zone visualization based on trend and price extremes
Visual Components
Dotted horizontal lines for each Fibonacci level
'Premium' and 'discount' zone highlighting
Change of Character (CHoCH) marker when a trend anchor breaks (a bottom is broken after an uptrend, a top is broken after a downtrend)
Adaptive label colors for light/dark chart themes
Alert System
Configurable alerts for all Fibonacci levels
Requires 2 consecutive bar closes for confirmation (reduces false signals)
CHoCH alert when a locked extreme is broken
Set up using "Any alert() function call" option
------------------------------------------------------------------
USE CASES
Two Primary Use Cases:
1. PROSPECTIVE TREND MAPPING (Real-Time Tracking)
Set start date at or just before an anticipated swing extreme to track levels as the trend develops:
For Uptrend : Place start date near a bottom. The bottom level locks after consolidation, while the top updates in real-time as the price climbs higher
For Downtrend : Place start date near a top. The top-level locks after consolidation, while the bottom updates in real-time as the price falls lower
This mode tracks developing price action against Fibonacci levels as the swing unfolds.
2. RETROSPECTIVE ANALYSIS (Historical Swing Study)
Set the start date at a completed swing extreme to analyze how the price interacted (and is interacting) with the Fibonacci levels:
Both high and low are already established in the historical data
Levels remain static for analysis purposes
Useful for analyzing price behavior relative to Fibonacci levels, studying retracement dynamics, and assessing a trading posture
------------------------------------------------------------------
HOW TO USE
Set 'Start Date' : Select Start Date (anchor point) at or just before the swing extreme (bottom for uptrend, top for downtrend)
Choose Trend Direction (Up or Down): direction is known for retrospective analysis, uncertain for prospective analysis
Update the start date when significant structure breaks occur to begin analyzing a new swing cycle.
Configure alerts as needed for your analysis
------------------------------------------------------------------
TECHNICAL DETAILS
♦ Auto-Mapped Fibonacci Retracement Levels:
2.618, 2.000, 1.618, 1.414, 1.272, 1.000, 0.882, 0.786, 0.618, 0.500, 0.382, 0.236, 0.118, 0.000, -0.272, -0.618, -1.000, -1.618, -2.000, -2.618
♦ Premium/Discount (PD) Zones:
Uptrend: Green (discount zone) = levels 0 to 0.5 | Red (premium zone) = levels 0.5 to 1.0
Downtrend: Red (premium zone) = levels 0 to 0.5 | Green (discount zone) = levels 0.5 to 1.0
The yellow line represents the 0.5 equilibrium level
♦ Lock Mechanism:
The indicator monitors for new extremes to detect a Change of Character in the trend (providing visual feedback and alerts). It locks the anchor swing extreme after a timeframe-appropriate consolidation period has elapsed (varies from 200 bars on second charts to 1 bar on monthly charts) to detect such potentially critical events.
------------------------------------------------------------------
IMPORTANT NOTES
This is an educational tool for technical analysis study. It displays historical and current price relationships to Fibonacci levels but does not predict future price movements or provide trading recommendations.
DISCLAIMER: This indicator is for educational and informational purposes only. It does not constitute financial advice or trading signals. Past price patterns do not guarantee future results. Trading involves substantial risk of loss. Always conduct your own analysis and consult with qualified financial professionals before making trading decisions. By using this indicator, you acknowledge and agree to these limitations.
LA - Opening Price based Previous day Range PivotThis "LA - Opening Price based Previous day Range Pivot" indicator is a custom technical analysis tool designed for Trading View charts. It plots support and resistance levels (often referred to as pivots or ranges) based on the current opening price combined with the previous period's trading range. The "previous period" can be daily, weekly, or monthly, making it a multi-timeframe tool. These levels are projected using Fibonacci-inspired multipliers to create potential breakout or reversal zones.
The core idea is inspired by concepts like the Opening Range Breakout (ORB) strategy or Fibonacci pivots, but it's customized here to use a dynamic range calculation (the maximum of several absolute price differences) rather than a simple high-low range. This makes it more robust for volatile markets. Levels are symmetric above (resistance) and below (support) the opening price, helping traders identify potential entry/exit points, stop-losses, or targets. This will be useful when there is a gap-up/down as in Nifty/Sensex .
Purpose of the Indicator:
To visualize potential support/resistance zones for the current trading session based on the opening price and historical range data. This helps traders anticipate price movements, such as breakouts above resistance or bounces off support
Use Cases:
Intraday Trading: On lower timeframes (e.g., 5-min or 15-min charts), it shows daily levels for short-term trades.
Swing Trading: On higher timeframes (e.g., hourly or daily), it displays weekly/monthly levels for longer holds.
Range Identification: The filled bands highlight "zones" where price might consolidate or reverse.
Conditional Display: Levels only appear on appropriate timeframes (e.g., daily levels on intraday charts <60min), preventing clutter.
Theoretical Basis: It builds on pivot point theory, where the opening price acts as a central pivot. Multipliers (e.g., 0.618 for Fibonacci golden ratio) project levels, assuming price often respects these ratios due to market psychology.
How Calculations Work
Let's dive into the math with examples. Assume a stock with:
Current daily open (cdo) = $100
Previous daily high (pdh) = $105, low (pdl) = $95, close (pdc) = $102, close 2 days ago (pdc2) = $98
Step 1: Dynamic Range Calculation (var_d2):
This is the max of:
|pdh - pdc2| = |105 - 98| = 7
|pdl - pdc2| = |95 - 98| = 3
|pdh - pdl| = |105 - 95| = 10 (previous day range)
|pdh - cdo| = |105 - 100| = 5
|pdl - cdo| = |95 - 100| = 5
|pdc - cdo| = |102 - 100| = 2
|pdc2 - cdo| = |98 - 100| = 2
Max = 10 (so range = 10). This ensures the range accounts for gaps and extended moves, not just high-low.
Step 2: Level Projections:
Resistance (above open): Open + (Range * Multiplier)
dre6 = 100 + (10 * 1.5) = 115
dre5 = 100 + (10 * 1.27) ≈ 112.7
... down to dre0 = 100 + (10 * 0.1) = 101
dre50 = 100 + (10 * 0.5) = 105 (midpoint)
Support (below open): Open - (Range * Multiplier)
dsu0 = 100 - (10 * 0.1) = 99
... up to dsu6 = 100 - (10 * 1.5) = 85
Without Indicator
With Indicator
Pros and Cons
Pros:
Multi-Timeframe Flexibility: Seamlessly integrates daily, weekly, and monthly levels, useful for aligning short-term trades with longer trends (e.g., intraday breakout confirmed by weekly support).
Dynamic Range Calculation: Unlike standard pivots (just (H+L+C)/3), it uses max of multiple diffs, capturing gaps/volatility better—great for stocks with overnight moves.
Customizable via Inputs: Users can toggle levels, adjust multipliers, or change timeframes without editing code. Inline inputs keep the UI clean.
Visual Aids: Filled bands make zones obvious; conditional colors highlight "tight" vs. "wide" ranges (e.g., for volatility assessment).
Fibonacci Integration: Levels based on proven ratios, appealing to technical traders. Symmetric supports/resistances simplify strategy building (e.g., buy at support, sell at resistance).
No Repainting: Uses historical data with lookahead, so levels are fixed once calculated—reliable for back-testing.
Cons:
Chart Clutter: With all toggles on, 50+ plots/fills can overwhelm the chart, especially on mobile or small screens. Requires manual disabling.
Complexity for Beginners: Many inputs and calculations; without understanding fib ratios or range logic, it might confuse new users.
Performance Overhead: On low timeframes (e.g., 1-min), fetching higher TF data multiple times could lag, especially with many symbols or back-tests.
Assumes Volatility Persistence: Relies on previous range projecting future moves; in low-vol markets (e.g., sideways trends), levels may be irrelevant or too wide/narrow.
No Alerts or Signals: Purely visual; no built-in buy/sell alerts or crossover conditions—users must add separately.
Hardcoded Styles/Colors: Limited customization without code edits (e.g., can't change line styles via inputs).
Also, not optimized for non-stock assets (e.g., forex with 24/7 trading).
In summary, this is a versatile pivot tool for range-based trading based on Opening price, excelling in volatile markets but requiring some setup. If you're using it, start with defaults on a daily chart and toggle off unnecessary levels.

Altcoins Exit Planner [SwissAlgo]Altcoins Exit Planner
Navigating Altcoin Exits: A Strategic Approach: Planning your exits before emotions take over
------------------------------------------------------------------
✅ THE PSYCHOLOGY OF ALTCOIN TRADING
Many traders face recurring challenges when managing altcoin positions:
The Greed Trap : Holding through euphoric rallies, hoping for unrealistic targets, only to watch gains evaporate during market reversals.
The Paralysis Problem : Sitting on large unrealized profits but unsure which assets to exit, when, or how much — leading to inaction.
The FOMO Cycle : Rotating into trending coins too early or too late, often abandoning solid positions prematurely.
Analysis Overload : Consuming endless opinions and indicators without ever forming a clear, actionable exit strategy.
These patterns often stem from a lack of structure and planning . Emotional decision-making in volatile markets can be costly — especially with altcoins.
Developing a systematic framework can help define exit levels in advance , aiming to reduce emotional bias and improve decision clarity. The goal is to build disciplined exit strategies based on predefined logic rather than reactive impulses.
------------------------------------------------------------------
✅ FEATURES & FUNCTIONALITY
This indicator is designed to provide traders with a structured framework for exit planning. It aims to reduce decision-making under pressure by offering a visual roadmap on the chart.
The tool provides an analysis of key data points, including:
Structured Analysis : The indicator evaluates asset strength, identifies potential market phases, and derives potential exit levels from historical price behavior. This analysis may help traders assess whether an asset shows characteristics of strength (e.g., potential for extended targets) or weakness (e.g., early exit signals).
Actionable Information : It generates specific price levels and quantities for consideration as part of a predefined exit strategy.
Proactive Alerts : The system includes configurable alerts that can notify users as prices approach these key levels, allowing time for preparation. This feature is intended to support a shift from reactive trading toward systematic, criteria-based exit planning.
------------------------------------------------------------------
✅ HOW IT WORKS - AUTOMATED ANALYSIS & PLANNING
This indicator is designed to automate key aspects of exit planning that would otherwise require manual effort:
Fibonacci Level Calculation & Plotting : Automatically identifies key historical cycle points (e.g., bear market lows, bull market highs, recent pullbacks) and calculates relevant Fibonacci levels (both "Fib Retracments" from previous cycle ATH to bear market bottom, and "Fib. extensions" - considering major price impulses/waves in current bull market). This may help reduce manual drawing errors and streamline target identification.
Automated Calculation and Plotting of "Fib. Retracement "Levels
(from ATH of previous cycle to bottom in bear market)
Fibonacci retracement levels are a popular tool used in technical analysis to identify potential support and resistance levels in a market. After a significant price move, traders look for the price to "retrace" or pull back to one of several key Fibonacci ratios of the original move before continuing in its original direction. The most common retracement levels are 23.6%, 38.2%, 50%, 61.8%, and 78.6%. These levels are static horizontal lines on a chart, and their predictive power is based on the idea that they are "areas of interest" where a trend might pause or reverse.
Automated Calculation and Plotting of "Fib. Extension" Levels
(Price Impulses/Waves within current Bull Market)
Fibonacci extension levels are used to identify potential price targets or profit zones once a market has moved past its previous high or low. Unlike retracements, which measure a pullback, extensions project how far a trend might continue in the direction of its impulse move. They are typically used to anticipate where a wave or a rally might end and are based on ratios like 127.2%, 161.8%, 261.8%, and sometimes even higher. Extensions are a key tool for traders looking to set price targets for taking profits.
Coin Strength Assessment: Evaluates recovery performance relative to previous cycle peaks and classifies assets into four categories (Weak, Average, Strong, Outlier). Strength ratings may adjust dynamically based on momentum conditions — all derived from price data.
Market Phase Detection : Continuously monitors trend indicators, volume behavior, and altseason dynamics to estimate the current market phase. This may assist in contextualizing exit decisions without requiring manual phase analysis.
Exit Level Generation : Based on the asset’s strength classification and selected strategy (Conservative, Balanced, Aggressive), the system generates sequential exit levels with suggested percentages and quantities. Designed to support structured planning across three stages.
Signal Detection : Tracks multiple conditions — including price extensions, volume surges, momentum shifts, and cycle patterns — to generate alerts when predefined criteria are met.
Emergency Exit Detection : Scans for rare but high-risk scenarios (e.g., cycle top formations with multiple confluences) that may warrant immediate attention. Alerts are designed to highlight potential overextension during volatile phases.
Transfer Alerts : Calculates proximity to key exit zones and may issue early warnings to prepare for execution (e.g., moving assets from cold storage to exchanges), aiming to reduce last-minute decision pressure.
The script operates in two distinct modes:
Coin Analysis Mode Displays automatically-calculated Fibonacci levels, asset strength classification, market phase estimation, and contextual risk factors — designed to support structured analysis.
Exit Plan Mode Generates a customizable exit strategy with calculated price levels, suggested quantities, and potential outcome scenarios — aiming to assist with disciplined planning and reduce emotional bias.
------------------------------------------------------------------
✅ SETUP & INSTALLATION
Step 1: Chart Setup
Add the indicator to your altcoin USD chart (e.g., spot market pairs).
Recommended timeframe: 3 days for signal clarity.
Dark theme suggested for visual contrast.
Step 2: Configure Your Exit Strategy
Open Settings → “Setup Your Exit Plan”
Choose your strategy: Conservative: Prioritizes earlier exits for stricter risk control; Balanced: Combines early and late exits for a mixed approach; Aggressive: Targets later exits, accepting potentially higher volatility.
Input your asset quantity.
(Optional) Set a minimum sell price to block exit signals below your defined threshold.
(Optional) Set a sell-now price to trigger a sell alert when your exit target is reached, bypassing intermediate levels.
Step 3: Choose Display Mode
Coin Analysis Mode: View market conditions, strength classification, Fibonacci levels, and contextual risk insights. Designed to support monitoring and signal validation.
Exit Plan Mode: Displays your structured exit roadmap with suggested price levels, quantities, and visual chart overlays. Focuses on execution and planning.
Step 4: Set Up Alerts (Recommended)
Click the “Alert” button on the chart.
Select “Altcoins Exit Planner” as the condition.
Choose alert type: Planned Exit, Emergency Exit, Transfer Alert, Local Top, Trend Change
Set expiration to “Open-ended”
Configure your preferred notification method.
Alert Types Include:
Planned Exit Alerts: Triggered when suggested exit levels are reached (Exit #1, #2, #3).
Emergency Exit Alerts: Highlight potential cycle tops or full-exit conditions.
Transfer Alerts: Advance notice to prepare for execution (e.g., moving assets to exchanges).
Local Top Alerts: Short-term pullback signals for tactical decisions.
Trend Change Alerts: Indicate potential market phase transitions.
Once configured, the indicator begins analyzing and may notify you when exit conditions align with your selected strategy.
------------------------------------------------------------------
✅ USER INTERFACE
The interface is organized into two primary modes:
1) Coin Analysis Mode
Analysis Table Includes:
Fibonacci levels with price targets and percentage differentials
Market trend status (e.g., Strong Bull, Weakening Bull, Bear Market)
Volume behavior (Normal / Abnormal)
Price extension status (Overextended / Within range)
Altseason detection
Coin strength classification
Reversal risk assessment (Low / Average / High)
Suggested action based on current conditions
Visual Elements:
Bull/Bear trend EMA line
Volume-based candle coloring (overrides default chart candles)
Pivot points for key structural levels
Selectable Fibonacci extension/retracement lines
Background highlighting during altseason periods (potential cycle peak phase)
2) Exit Plan Mode
Exit Plan Table Displays:
Suggested quantity to sell at each exit level
Estimated portfolio value in USD
Structured exit plan with Fibonacci levels, percentages, quantities, and projected amounts
Average exit price calculation
Potential outcome scenarios if all exit levels are reached
Price Lines:
Individual exit level markers with contextual details
Average exit price reference line
Minimum sell price line (if enabled)
Sell-now price line (if enabled)
Signal Indicators:
Blue diamonds: Planned exit levels reached
Red triangles: Cycle top warnings
Orange triangles: Local top signals
These elements are designed to assist with visual interpretation and structured decision-making. All outputs are derived from price data and user-defined settings.
------------------------------------------------------------------
✅ LIMITATIONS
Market Cycle Dependency: This indicator is designed for cryptocurrency market cycles and will not perform similarly in other asset classes or market conditions. Its logic is based on historical crypto behavior, which may not repeat.
Assumption-Based Framework: The methodology relies on assumptions about market cycles, Fibonacci relationships, and altcoin behavior patterns. These assumptions may not hold under future conditions.
User Responsibility
All signals require user interpretation and decision-making.
The indicator provides information, not investment advice.
Signals should be validated with additional analysis.
Position sizing and risk management remain the user's responsibility.
Technical Requirements
Intended for use on the 3-day timeframe.
Designed for altcoin/USD trading pairs.
Requires sufficient historical data for Fibonacci calculations.
May not function properly on newly listed assets with limited price history.
Risk Management Guidelines. Recommended practices include:
Use with limited portions of your portfolio.
Combine with other technical and fundamental tools.
Consider broader market context beyond indicator signals.
Maintain independent stop-loss levels.
Review and adjust settings as market conditions evolve.
Signal Interpretation
Emergency signals highlight conditions that may warrant immediate review.
Planned exits support gradual, structured position reduction.
Transfer alerts provide preparation time before potential execution.
Local top signals may assist short-term tactical decisions.
------------------------------------------------------------------
✅ DISCLAIMER
This indicator is for educational and informational purposes only . It does not constitute financial, investment, or trading advice.
The indicator:
Makes no guarantees about future market performance.
Cannot predict market movements with certainty.
May generate false signals or miss key developments.
Relies on historical patterns that may not repeat.
Should not be used as the sole basis for trading decisions.
Users are responsible for:
Conducting independent research and analysis.
Understanding the risks of cryptocurrency trading.
Making their own investment/divestment decisions.
Managing position sizes and risk exposure appropriately.
Cryptocurrency trading involves substantial risk and may not be suitable for all investors. Past performance does not guarantee future results. Users should only invest what they can afford to lose and consult qualified professionals before making financial decisions.
The indicator’s assumptions may be invalidated by changing market conditions.
By using this tool, users acknowledge these limitations and accept full responsibility for their trading decisions.

Gabriel's Triple Impulsive Candle DetectorTriple Impulsive Candle Detector
Overview, critical for catching impulse moves in either direction.
SPX Income System is a rule-based framework designed to identify frequent, high-probability income opportunities on the S&P 500 cash index (SPX/SPY) using 0-DTE credit spreads. The core engine operates on 30-minute Impulse bars during the morning trade window and can be extended with optional modules for afternoon, overnight, and weekly swing opportunities. The methodology centers on a single, mechanical price event called a Impulse Bar (small wick to body ratio) to minimize discretion and keep execution consistent.
🔶What’s Inside
Core Strategy: SPX Daily Income
Timeframe: 3 kinds of 30-min bars.
Window: 09:30–11:30 ET (new setups only)
Instrument: SPX (cash index, XSP/SPY), executed with $5-wide credit spreads on 0-DTE SPX options
Bullish Setup
Entry on the break of setup bar high
Use an at the money put credit spread
Bearish Setup
Entry on the break of setup bar low
Use an at the money call credit spread
Intent: Enter shortly after setup; manage to >80% max profit or EOD expiration if SPX. If it's another stock, then a 1.5~2x D ATR is suggested.
Signal: An Impulse Bar that closes at/near the high (bullish) or low (bearish) of its 30-min range, verified with Volume above average.
Risk—limited to the risk of the option spread.
The spread is 5 dollars wide
The premium collected is $2.50
$5 - 2.50 = $2.50, or the breakeven point.
Which means what's left is the risk involved.
The risk is $2.50 per spread
🔶Why the 30-Minute Chart?
The 30-minute bar is the “chart of choice” because it filters noise and aligns with morning institutional flows.
On alternate timeframes, price often retraces half the candle body before following through.
On the 30m: the follow-through is more consistent, especially with 2x volume confirmation.
Adding support/resistance levels at the impulse bar hl2 strengthens execution.
This strategy has roots in MTF Crypto, and SPX/SPY TPO-Order Block logic.
🔶Bonus Examples:
🔹Afternoon SPX Income
Second chance window (typically 14:00–15:00 ET) if the morning trade has exited, 60-min bars instead.
🔹ORB 30 – Opening Range Break (first 30 min)
Classic ORB with an income twist for early action when time is limited. This can be entered on the 15 minute candle break.
🔹ORB 60 – Opening Range Break (second 30 min)
A follow-up ORB variant for traders who miss the first window, verified on a 60-min chart. Enter on the final 3 minutes of the hourly candle or wait for a pullback.
🔹B&B – Bed & Breakfast (Overnight)
Identifies income setups via the 10-minute chart in the last 30–60 minutes of the session with next-day open as the exit.
🔹JB – Just Breakfast
Uses the prior day’s end-of-day setup to enter at the opening bell, then manages into the daily income flow. I trade 0-date, and selling an ITM spread either partially or fully then gives me a head start on the daily income potential. This may work better if you either roll or the ORB 30 also meets the criteria.
🔹All-Day-Scalper
Converts income logic into 30-minute scalps using deep 75/80 delta ITM options as synthetic stock (requires >PDT). Meaning that the option will behave as if it is stock. This strategy comes with a warning: it's better if you can day trade.
🔹Tag ’n Turn—Weekly SPX Income Swing
Weekly swing overlay using 30-min Pulse Bars + Bollinger Bands (50) for 3–7 day swings and as a filter for daily income alignment. I use the TTM Squeeze and obtain similar results. Target heuristics (directional days) with a fired squeeze.
Part of my Gamma Scalping System.
🔶The Impulse Bar (10~40% Wick to Body Bar)
An Impulse Bar is a candle that:
Bullish: Closes higher than it opens and within the top ~10% of its high-low range.
Bearish: Closes lower than it opens and within the bottom ~10% of its high-low range.
Practical tip: Many traders mark 0-10-80-100% levels on the candle range (custom Fib or ruler) to quickly validate Pulse Bars. If it's accompanied by a volume spike, then it's better quality.
🔶SPX Daily Income—Rules & Execution
🔹Rules
Chart: 30 min, no indicators required. Pure PA, TPO-based strategy.
New Setups: 09:30–11:30 ET
Instrument: SPX signals, executed via SPX 0-DTE credit spreads ($5 wide, $2 for SPY)
🔹Entries
Bullish: Enter on a break of the setup bar high, use ATM put credit spread
Bearish: Enter on a break of the setup bar low, use ATM call credit spread
🔹Exits
Primary: Close at >80% of max profit (credit received)
Alternate: Hold to EOD expiration
Stop: Risk of the spread (defined by width – credit)
Target Heuristics (directional days)
Optional: 1.5–2× ATR as a reference (mirrors directional follow-through that often accelerates the >80% outcome)
Credit Guidance (typical)
OTM short strike ≈ $2.40
ITM short strike ≈ $2.50–$2.80
2× ITM short strike ≈ $2.80–$3.00
Trade Management (PDT-Aware)
If under PDT, many prefer set-and-forget with GTC buy-back (e.g., $0.20) or EOD expiration.
1:00 PM ET time check
Trending day ±$15–$20 SPX: usually no action, run to expiration
Non-trending day ±$5 SPX: consider taking 40–60% if available (optional) to avoid 50/50 end-of-day decay dynamics
Rationale: Without a favorable trend by ~1 PM, the odds of a late push decline; choosing a controlled partial outcome can improve long-run expectancy and reduce variance.
🔶Examples (Conceptual)
🔹Bullish: A green dot marks a bullish impulse bar; minor follow-through pushes the spread to >80% quickly.
🔹Bearish: A red triangle marks a bearish Impulse Bar; a modest down move is often sufficient for >80–95%.
🔹Tag ’n Turn—Weekly Swing (Filter & Stand-Alone)
Chart: 30-minute
Overlay: Bollinger Bands 50 (mean-reversion lens), or KC or TTM.
Setup: Tag of upper/lower band + Pulse Bar, enter on break of Pulse Bar in that direction
Target: Opposite Bollinger Band
Use Case: 3–7 day swings and a directional filter for Daily Income signals (trade with weekly bias)
🔹Afternoon SPX Income: Same Pulse logic, 14:00–15:00 ET window.
🔹ORB 30 / ORB 60: Uses 30/60-min opening range; can relax Pulse threshold (up to 40% bars) for early positioning when time-constrained.
🔹B&B (Overnight): Lasts 30–60 minutes; closes the next day at open or after the first 30-minute bar.
🔹JB (Just Breakfast): Enter at open using prior day’s signal; optionally roll into Daily Income if eligible.
🔹All-Day-Scalper: Deep ITM options (~0.75–0.80 delta) as synthetic stock.
Entry: Long ITM option
Stop: ~40% of option price
Target: 70–150% or 30-minute timed exit
Note: Time-intensive; for accounts above PDT.
🔹Brokerage: Must efficiently support SPX options; a <10% spread between OI and Volume is ideal. Preferences vary; Tastytrade, Thinkorswim, and Interactive Brokers are common choices. Use what’s reliable, available in your region, and cost-effective.
🔶Alerts (Check-in)
Bullish Impulse Detected (within 09:30–11:30 ET)
Bearish Impulse Detected (within 09:30–11:30 ET)
Afternoon Pulse (14:00–15:00 ET)
ORB 30/60 Trigger
B&B Window Open (last 60 mins)
JB at Open
Tag ’n Turn: Band Tag + Impulse (Bull/Bear)
🔶Inputs (Typical)
Session windows (morning, afternoon, last hour) ~5~15 Average Bar
Impulse threshold (strict 10% vs relaxed up to 40% for ORB variants)
Marker/label styles (bull/bear colors, dots vs arrows)
Filters (optional ATR TP, band touch BB(50-SMA, 2 Stdv.) for Tag ’n Turn)
Alert toggles (on-close for webhooks)
🔶Best Practices
One playbook, many Doors: Start with daily income; add afternoon or B&B/JB only after you’re consistent.
Credit discipline: Don’t chase poor pricing; stick to the credit guidance.
Time awareness: If no trend by ~1 PM ET, consider variance control.
Weekly bias: When using Tag ’n Turn, align daily trades with the weekly swing direction for added confluence.
Risk is defined as width – credit = max risk per spread. Size, accordingly, 1~2%.
🔶Disclosures & Risk
This is not financial advice. Options involve risk and are not suitable for all investors. Past performance (including backtests or theoretical studies) does not guarantee future results. Slippage, fills, assignment risk, and latency can materially impact outcomes. Trade a plan you fully understand and always size for durability. On the Daily, the Impulse bars, are often a signal that you should plan for it to return back to half of the Candle's body, and plan accordingly. Plot a horizontal support/resistance level and see how price reacts to it. Keep house-money, and use 1~2% Risk, reduce exposure when VIX is low and increase it when VIX is high.
TL;DR (Summary)
Signal: 30-min Pulse Bar (strict 10% close in range)
Window: 09:30–11:30 ET (new setups)
Execution: 0-DTE $5-wide SPX credit spreads
Exit: >80% max profit or EOD
Add-ons: Afternoon, ORB 30/60, B&B/JB overnights, All-Day-Scalper, Tag ’n Turn weekly swing/filter
Philosophy: Fully rule-based, minimal discretion, production-line consistency 0-date.

Otekura Range Trade Algorithm [Tradebuddies]The Range Trade Algorithm calculates the levels for Monday.
On the chart you will see that the Monday levels will be marked as 1 0 -1.
The M High level calculates Monday's high close and plots it on the screen.
M Low calculates the low close of Monday and plots it on the screen.
The coloured lines on the screen are the points of the range levels formulated with fibonacci values.
The indicator has its own Value table. The prices of the levels are written.
Potential Range breakout targets tell prices at points matching the fibonacci values. These are Take profit or reversal points.
Buy and Sell indicators are determined by the range breakout.
Users can set an alarm on the indicator and receive direct notification with their targets when a new range occurs.
Fib values are multiplied by range values and create an average target according to the price situation. These values represent an area. Breakdown targets show that the target is targeted until the area.

VIX Stoch RSI Oscillator [HUD Box + Compression]vix stoch rsi Oscillator
watch volatility without switching charts,
gives signal based off fib levels 0-100 / volatility,
emoji box to show signal,
HUD Box: emoji-coded tactical feedback
bounce 100 "💥 Expansion" :
bounce 0.8 "🔴 Overbought" :
bounce 0.618 "📉 Distribution" :
bounce 0.5 "🧠 Midline" :
bounce 0.382 "📈 Accumulation" :
bounce 0.2 "🟢 Oversold" :
bounce0.0 "💣 Expansion" : "⚪ Neutral"
Tiger EMA/STOCH
This logic checks if the oscillator is trending above or below its 48-period EMA,
If above, it paints the line GREEN🟢 (bullish),
If below, it paints it RED🔴 (bearish),
If compression is active, it overrides both with purple🟣 to highlight tactical squeeze conditions,
⚠️WARNING⚠️
ALWAYS REMEMBER THIS CHART IS VIX/USD
IN MOST CASES SPY MOVES VICE VERSA
I AM NOT RESPOSIBLE FOR YOUR OWN ACTIONS/TRADE IDEAS
AMEX:USD
TVC:VIX
SP:SPX

Riz Goldbach FrameworkRiz Goldbach Framework maps a dynamic dealing range and a set of Goldbach-derived price levels to structure intraday decision-making. It blends range math (PO3), level clustering, session weighting, volume/volatility context, and an explainable scoring engine that can issue BUY/SELL signals with risk levels (SL/TP). It is designed for discretionary traders who want rules-based context rather than a black box.
Core concepts (how it works)
1) PO3 Dealing-Range Engine
⦁ The script builds a tri-based PO3 range around current price (Auto or Manual).
⦁ It shifts the range when price “accepts” outside (close/wick—user selectable) and adapts width with ATR so the range expands in high volatility and tightens in low volatility.
⦁ From this range it computes mid, premium/discount halves, and sub-mids.
2) Goldbach Levels (structure map)
Within the active PO3 range, fixed percentages anchor recurring behaviors:
⦁ Rejection edges: 3%, 97%
⦁ Order-block tendency: 11%, 89%
⦁ FVG tendency: 17%, 83%
⦁ Liquidity void / expansion: 29%, 71%
⦁ Breaker band: 41%, 59%
⦁ Mitigation band: 47%, 53%
⦁ Equilibrium: 50%
⦁ Touch/near logic is tolerance-based (body-only optional). The script also counts confluence clusters (2=moderate, 3+=strong) near price.
3) Market elements the script tracks
⦁ Order Blocks (OB): detected after BOS behavior when price is sitting on OB-biased GB levels (11/89).
⦁ FVG: 3-bar gaps at FVG-biased levels (17/83) with optional “% fill” confirmation.
⦁ LV bars: wide-range, high-range bars around 29/71 for displacement/voids.
⦁ Equal Highs/Lows (EQH/EQL): tolerance with labeling for sweep risk.
⦁ Circuit Breaker (CB): zone seeded at 41/59. States: intact → broken → retest → revalidated/failed. A shaded band shows the active breaker zone.
⦁ Twin Towers (TT): equal-high/equal-low doublet with spacing/volume/RSI checks, then sweep-and-return into the breaker zone for confirmation.
4) Context & filters
⦁ Trend vs Range: DMI/ADX + EMA stack infer TREND/RANGE/TRANSITION and scale the required score.
⦁ MTF alignment: compares current PO3 halves vs HTF PO3 halves (user timeframe), rewarding alignment and flagging divergence.
⦁ Fib–Goldbach confluence: checks 61.8/38.2/78.6/127.2/161.8 against key GB levels for added weight.
⦁ Session weighting: Asia/London/NY bias different GB levels; weights are higher for London/NY.
⦁ Volume-weighted liquidity: tracks volume at EQH/EQL to flag “high-commitment” sweeps.
⦁ AMD cycle (smart): accumulation/manipulation/distribution estimated from ATR regimes, sweeps, BOS continuation, divergence and PO3 shifts.
⦁ Optional filters: HTF bias, SMT divergence via a second symbol, VSA volume emphasis, news blackout session.
5) Signal engine
⦁ Modes: MMxM, Trending, or Hybrid (auto switches depending on CB acceptance + ATR expansion).
⦁ A score (0–100) aggregates weighted conditions (GB touch/confluence, AMD alignment, CB state, TT, FVG/OB interaction, HTF bias, SMT, high-volume, RSI momentum).
⦁ Adaptive threshold raises/lowers requirements in TREND vs RANGE.
⦁ Outputs: BUY/SELL label with strength (WEAK/NORMAL/STRONG), a reasons string (e.g., GB+AMD+Breaker+TT+FVG+HTF+RSI), and risk levels:
⦁ SL: rejection/structure anchored (e.g., GB3/GB97 or recent swing ± ATR).
⦁ TP1: opposite breaker (41/59).
⦁ TP2: opposite FVG tendency (17/83).
⦁ Live RR displayed on label and plotted as dashed lines.
⦁ Cooldown, session/time, weekend, and volatility gates suppress poor-quality or clustered signals.
What you see on the chart
⦁ PO3 bands: High/Low/Mid lines plus background shading for Premium (bear tint), Discount (bull tint), Equilibrium (neutral).
⦁ Goldbach lines: Major structure (0/50/100) plus the functional GB set (11/17/29/41/47/53/59/71/83/89/3/97).
⦁ Blocks & gaps: OB lines, FVG boxes (extend right, fill progress), LV box, breaker zone band, and TT logic states.
⦁ CE/MT: Central equilibrium (~3.5%/96.5%) and mid-towers (25%/75%) trigger optional alerts.
⦁ Session overlays: Asia/London/NY (optional).
⦁ Opens: Daily/Weekly (optional).
⦁ Dashboard: PO3 value, Zone (Premium/Discount/Equilibrium), AMD phase, Session, Mode (MMxM/Trending/Hybrid), CB state, nearest GB tag, Market context (TREND/RANGE/TRANS), recent Events, and rolling win-rate tallies (signals/CB/TT) from the current chart session.
How to use it (workflow)
1. Pick a preset
⦁ Minimal: only core structure.
⦁ Standard: levels + dashboard.
⦁ Full: adds sessions + GBT window overlays.
2. Choose range logic
⦁ PO3 Auto is reactive and scales with ATR.
⦁ Manual PO3 is for precise range control.
3. Scope your bias
⦁ Confirm Zone (Premium/Discount), CB state, and AMD phase; check MTF row if enabled.
⦁ Strong setups usually appear when session-weighted GB levels + confluence ≥ 2 + CB revalidated + AMD = manipulation → distribution (short) or accumulation → manipulation (long).
4. Act on signals (optional)
⦁ When a label prints, read the factors string and score.
⦁ Use plotted SL/TP1/TP2 lines and RR.
⦁ Respect cooldown, news blackout, and volatility filter.
Inputs you might tweak
⦁ PO3: Auto/Manual, acceptance by Close vs Wick, adaptive widening/tightening.
⦁ Levels: Major-only vs All; tolerance %; wick vs body touches.
⦁ Signals: Mode, score threshold, cooldown, confirm on close.
⦁ CB/TT: breaker width %, spacing window & tolerance, suppress bars after TT.
⦁ Filters: HTF timeframe, SMT symbol, VSA on/off, news blackout session.
⦁ Visuals: colors, line opacity, label sizes, dashboard position/size.
⦁ FVG/LV/CE/MT: fill %, and per-event alerts.
Alerts available
⦁ BUY/SELL signal, PO3 shift, GB touch (with tag), CB broken/retest pass/fail, TT setup/confirmed, OB tagged, FVG formed/filled, LV expansion, CE/MT touches.
Limitations & notes
⦁ Signals are contextual—they depend on the active PO3, tolerance, filters, session weighting, and volatility regime.
⦁ HTF requests depend on broker/exchange data and the timeframe you assign; if HTF is empty or illiquid, features degrade gracefully but may be less informative.
⦁ Win-rate tallies are session-local (not a historical performance guarantee).
⦁ Parameter choices (e.g., tolerance, breaker width, thresholds) materially change behavior.
Disclaimer
This tool is for educational/informational purposes only. It does not constitute financial advice, an invitation to trade, or performance assurance. Markets involve risk—always test on replay/paper and manage risk independently.

Perfect Price-Anchored % Fib Grid This indicator generates support and resistance levels anchored to a fixed price of your choice.
You can also specify a percentage for the indicator to calculate potential highs and lows.
Commonly used values are 3.5% or 7%, as well as smaller decimal versions like 0.35% or 0.7%, depending on the volatility you expect.
In addition, the indicator can highlight potential stop-run levels in multiples of 27 — ranging from 0 up to 243. This automatically places the 243 GB range directly onto your chart.
The tool is versatile and can be applied not only to equities, but also to ES futures and Forex markets.

ORB with Fib Levels - TradingbrockOpening Range (OR) Indicator Overview
This TradingView indicator analyzes and displays the Opening Range - a popular day trading concept that tracks price movement during the first 30-60 minutes of the trading session.
Core Functionality:
Opening Range Detection: By default, it monitors the 9:30-10:00 AM ET period and tracks the highest high and lowest low during this time frame, creating upper and lower boundaries.
Fibonacci Retracement Levels: Inside the opening range, it displays five key Fibonacci levels:
0.236 (23.6% - shallow retracement)
0.382 (38.2% - standard retracement)
0.500 (50% - halfway point)
0.618 (61.8% - golden ratio)
0.786 (78.6% - deep retracement)
Extension Levels: The indicator projects additional levels beyond the opening range:
1x extension above/below the range
2x extension levels that only appear when price breaks the first extension
Trading Applications:
Support & Resistance: The opening range high/low often act as key levels throughout the trading day
Breakout Trading: Many traders watch for price to break above or below the opening range
Mean Reversion: The Fibonacci levels within the range can serve as potential reversal points
Risk Management: Helps define clear levels for stop losses and profit targets
The indicator essentially gives traders a framework to understand how price is behaving relative to the early session's established range, which often sets the tone for the entire trading day.

Indicator 102#M3indicator based on Daily and weekly fib Level. Initial Breakout and breakdowns have been denoted as well

ORB with Golden Zone FIB targets, Any Timeframe by TenAMTraderDescription:
This indicator is designed to help traders identify key price levels using Fibonacci extensions and retracements based on the Opening Range Breakout (ORB). The levels are visualized as “Golden Zones”, which can serve as potential targets for trades.
Features:
Customizable ORB Timeframe: By default, the ORB is set from 9:30 AM to 9:45 AM EST, but any timeframe can be configured in the settings to fit your trading style.
Golden Zones as Targets: Fibonacci levels are intended to be used as potential profit-taking zones or areas to monitor for reversals, providing a structured framework for intraday and swing trading.
Adjustable Chart Settings: Color-coded levels make it easy to interpret at a glance, and all lines can be customized for personal preference.
Versatile Application: The indicator works across any timeframe, enabling traders to analyze both intraday and multi-day price action.
How to Use:
Ensure Regular Trading Hours (RTH) is enabled on your chart for accurate level calculation.
Observe price action near Golden Zones: a confirmed breakout may indicate continuation, while a pullback could signal a reversal opportunity.
Use the Golden Zones as reference targets for managing risk and planning exits.
Adjust the ORB timeframe and display settings to match your preferred trading style.
Legal Disclosure:
This indicator is provided for educational purposes only and is not financial advice. Trading carries a substantial risk of loss. Users should always perform their own analysis and consult a licensed financial professional before making any trading decisions. Past performance is not indicative of future results.

Trend and Entry Marker with MA, Supports, Fib, and Trend LinesJust a little indicator I made when I was bored ...
Helps you find entries for trades!