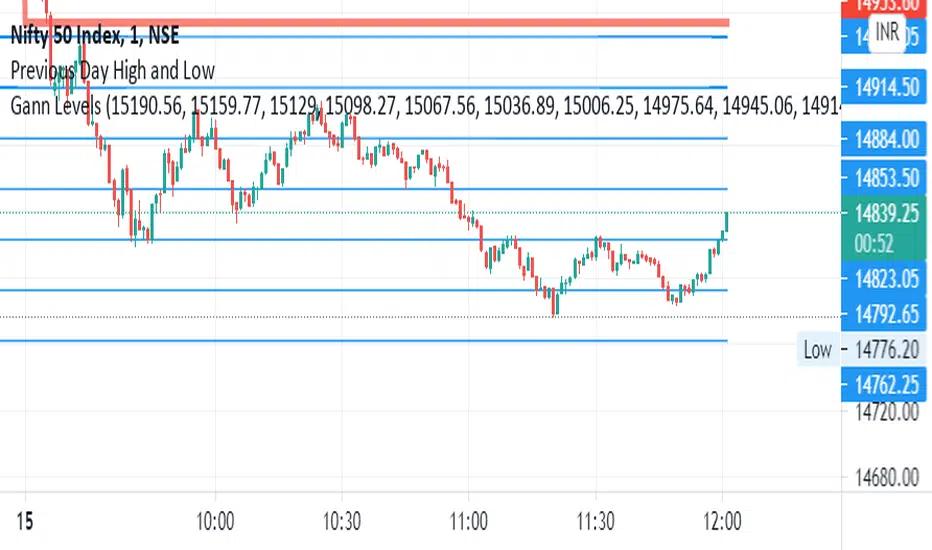
gann fib levelsDescription of gann fib Levels
Input Value Level:
Purpose: This level is the starting point for calculating support and resistance. Users can input a specific high or low price value that serves as the foundation for subsequent calculations.
Visual Representation: A bold blue line indicates this level prominently on the chart, making it easy to identify. Additionally, a horizontal magenta line provides a reference to this initial price level.
Support Levels:
Definition: Support levels are price points where a downtrend can be expected to pause due to buying interest. They act as a floor that prevents the price from falling further.
Calculation: Support levels are derived by calculating the square root of the input value, adjusting it downward by a defined step (0.25), and squaring the result to find potential support points.
Visual Representation: Each support level is plotted with a red line when the current price is below the support level and changes to green when the price is above it. Every fourth support level is depicted with a bolder line for emphasis.
Resistance Levels:
Definition: Resistance levels are price points where an uptrend can be expected to pause due to selling interest. They serve as a ceiling that prevents the price from rising further.
Calculation: Resistance levels are calculated similarly to support levels, using the square root of the input value but adjusting it upward by the defined step (0.25) before squaring the result.
Visual Representation: Each resistance level is plotted with a green line when the current price is below the resistance level and turns red when the price is above it. Like support levels, every fourth resistance line is bolded for easier identification.
Dynamic Behavior:
Crossing Logic: When the current market price crosses above a resistance level, that level transforms into a support level, effectively changing its role. Conversely, if the price crosses below a support level, it transforms into a resistance level. This dynamic behavior reflects real-time market sentiment and helps traders identify potential reversal points.
Summary
This Pine Script provides a visual representation of dynamic support and resistance levels based on a user-defined input price. With distinct color coding and bold lines for significant levels, traders can quickly assess market conditions, identify potential buy or sell signals, and make informed trading decisions. The system's adaptability allows it to reflect the latest market movements, enhancing its utility as a trading tool.
חפש סקריפטים עבור "gann"

Gann HiLo Activator [CC]The HiLo Activator was created by W.D. Gann and I was surprised to not see more of his technical indicators on here. I will start adding more of his indicators on here if I get more interest. This is the original version of the indicator that performs like a trailing stop that also works well as a trend line. Buy when the line turns green and sell when it turns red.
Let me know if there are any other indicators you want me to publish!

Gann Angles With VolatilityThis script will calculate the intraday levels using Gann angles and volatility principle.

Gann Trend OscillatorDeveloped by Robert Krausz, the Gann Trend Oscillator is a trend-following indicator used to determine the financial instruments long-term price direction.


Magic levelsIt is by far the simplest on chart presentation of Gann square of 9. It calculates the levels based on previous day closing. These levels usually acts as support and resistance.

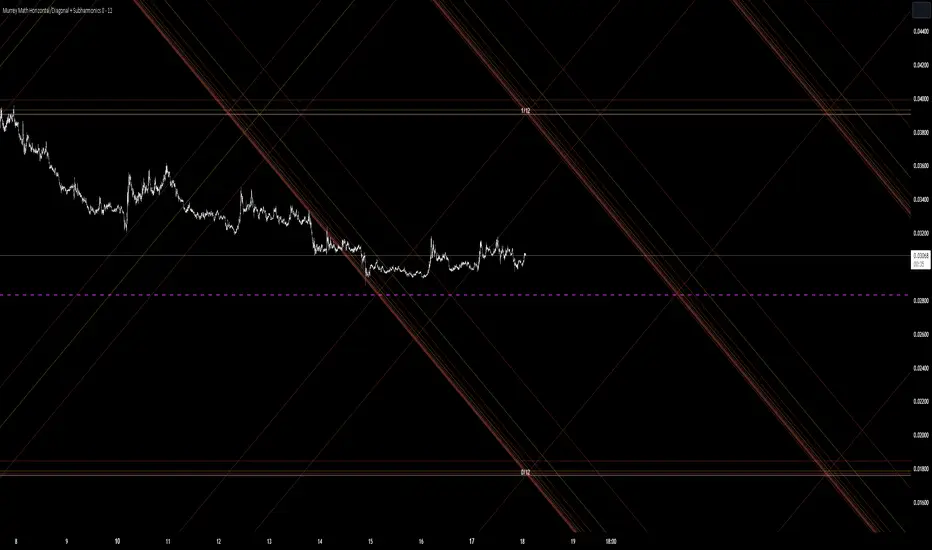
Murrey Math Horizontal/Diagonal + Subharmonics 0 - 12 [All-Time]The Murrey Math lines are created by dividing the range between the high and low of the monthly timeframe prices into equal parts based on the division factor from 2 to 12.
No matter which timeframe you will use, because the calculations based on the most high and low price values.
Better to use > monthly timeframe for faster calculations.
These lines serve as potential support and resistance levels.
The midlines are dashed lines representing the midpoint between two consecutive Murrey Math lines.
The diagonal lines can be enabled to show two different types or both types. These lines connect the highs or lows of the price bars in a diagonal manner.
The subharmonic lines represent smaller divisions within each Murrey Math range. They can be customized to show only strong subharmonics or all subharmonics. Subharmonics are calculated based on the division factor and can provide additional support and resistance levels within the Murrey Math framework.
This script helps visualize the Murrey Math levels and their associated lines on a trading chart, aiding traders in identifying potential price levels for decision-making.
The most strong levels which I tested were: 2, 4, 6, 8, 12.
I was inspired by Gann's work and i tried to implement this indicator.
It's the most accurate version of Murrey Math calculations, you can set the value of 8 which Gann was used but I did up to 12 because of my experiments and I would recommend you to use the value of 12.
This indicator can be used for all types of markets.
Also note, that the strong levels described above is tested on division by 12 setting.
Anyway, you can use the divison of 8 and use the standart strong s/r levels.
(for more information search for Gann 2.0 support resistance on the internet).
Also note: this information is not a financial advice, just my opinion to the indicator I implemented. Please use this indicator wisely and focus to save your money, not earn.
I wish you profitable trades, stick to your risk/money management and the key entry points!
Fine-tune Inputs: Gann + Laplace Smooth Volume Zone OscillatorUse this Strategy to Fine-tune inputs for the GannLSVZ0 Indicator.
Strategy allows you to fine-tune the indicator for 1 TimeFrame at a time; cross Timeframe Input fine-tuning is done manually after exporting the chart data.
I suggest using "Close all" input False when fine-tuning Inputs for 1 TimeFrame. When you export data to Excel/Numbers/GSheets I suggest using "Close all" input as True, except for the lowest TimeFrame.
MEANINGFUL DESCRIPTION:
The Volume Zone oscillator breaks up volume activity into positive and negative categories. It is positive when the current closing price is greater than the prior closing price and negative when it's lower than the prior closing price. The resulting curve plots through relative percentage levels that yield a series of buy and sell signals, depending on level and indicator direction.
The Gann Laplace Smoothed Volume Zone Oscillator GannLSVZO is a refined version of the Volume Zone Oscillator, enhanced by the implementation of the upgraded Discrete Fourier Transform, the Laplace Stieltjes Transform. Its primary function is to streamline price data and diminish market noise, thus offering a clearer and more precise reflection of price trends.
By combining the Laplace with Gann Swing Entries and with Ehler's white noise histogram, users gain a comprehensive perspective on volume-related market conditions.
HOW TO USE THE INDICATOR:
The default period is 2 but can be adjusted after backtesting. (I suggest 5 VZO length and NoiceR max length 8 as-well)
The VZO points to a positive trend when it is rising above the 0% level, and a negative trend when it is falling below the 0% level. 0% level can be adjusted in setting by adjusting VzoDifference. Oscillations rising below 0% level or falling above 0% level result in a natural trend.
HOW TO USE THE STRATEGY:
Here you fine-tune the inputs until you find a combination that works well on all Timeframes you will use when creating your Automated Trade Algorithmic Strategy. I suggest 4h, 12h, 1D, 2D, 3D, 4D, 5D, 6D, W and M.
When Indicator/Strategy returns 0 or natural trend, Strategy Closes All it's positions.
ORIGINALITY & USFULLNESS:
Personal combination of Gann swings and Laplace Stieltjes Transform of a price which results in less noise Volume Zone Oscillator.
The Laplace Stieltjes Transform is a mathematical technique that transforms discrete data from the time domain into its corresponding representation in the frequency domain. This process involves breaking down a signal into its individual frequency components, thereby exposing the amplitude and phase characteristics inherent in each frequency element.
This indicator utilizes the concept of Ehler's Universal Oscillator and displays a histogram, offering critical insights into the prevailing levels of market noise. The Ehler's Universal Oscillator is grounded in a statistical model that captures the erratic and unpredictable nature of market movements. Through the application of this principle, the histogram aids traders in pinpointing times when market volatility is either rising or subsiding.
The Gann swing strategy is developed by meomeo105, this Gann high and low algorithm forms the basis of the EMA modification.
DETAILED DESCRIPTION:
My detailed description of the indicator and use cases which I find very valuable.
What is oscillator?
Oscillators are chart indicators that can assist a trader in determining overbought or oversold conditions in ranging (non-trending) markets.
What is volume zone oscillator?
Price Zone Oscillator measures if the most recent closing price is above or below the preceding closing price.
Volume Zone Oscillator is Volume multiplied by the 1 or -1 depending on the difference of the preceding 2 close prices and smoothed with Exponential moving Average.
What does this mean?
If the VZO is above 0 and VZO is rising. We have a bullish trend. Most likely.
If the VZO is below 0 and VZO is falling. We have a bearish trend. Most likely.
Rising means that VZO on close is higher than the previous day.
Falling means that VZO on close is lower than the previous day.
What if VZO is falling above 0 line?
It means we have a high probability of a bearish trend.
Thus the indicator returns 0 and Strategy closes all it's positions when falling above 0 (or rising bellow 0) and we combine higher and lower timeframes to gauge the trend.
What is approximation and smoothing?
They are mathematical concepts for making a discrete set of numbers a
continuous curved line.
Laplace Stieltjes Transform approximation of a close price are taken from aprox library.
Key Features:
You can tailor the Indicator/Strategy to your preferences with adjustable parameters such as VZO length, noise reduction settings, and smoothing length.
Volume Zone Oscillator (VZO) shows market sentiment with the VZO, enhanced with Exponential Moving Average (EMA) smoothing for clearer trend identification.
Noise Reduction leverages Euler's White noise capabilities for effective noise reduction in the VZO, providing a cleaner and more accurate representation of market dynamics.
Choose between the traditional Fast Laplace Stieltjes Transform (FLT) and the innovative Double Discrete Fourier Transform (DTF32) soothed price series to suit your analytical needs.
Use dynamic calculation of Laplace coefficient or the static one. You may modify those inputs and Strategy entries with Gann swings.
I suggest using "Close all" input False when fine-tuning Inputs for 1 TimeFrame. When you export data to Excel/Numbers/GSheets I suggest using "Close all" input as True, except for the lowest TimeFrame. I suggest using 100% equity as your default quantity for fine-tune purposes. I have to mention that 100% equity may lead to unrealistic backtesting results. Be avare. When backtesting for trading purposes use Contracts or USDT.

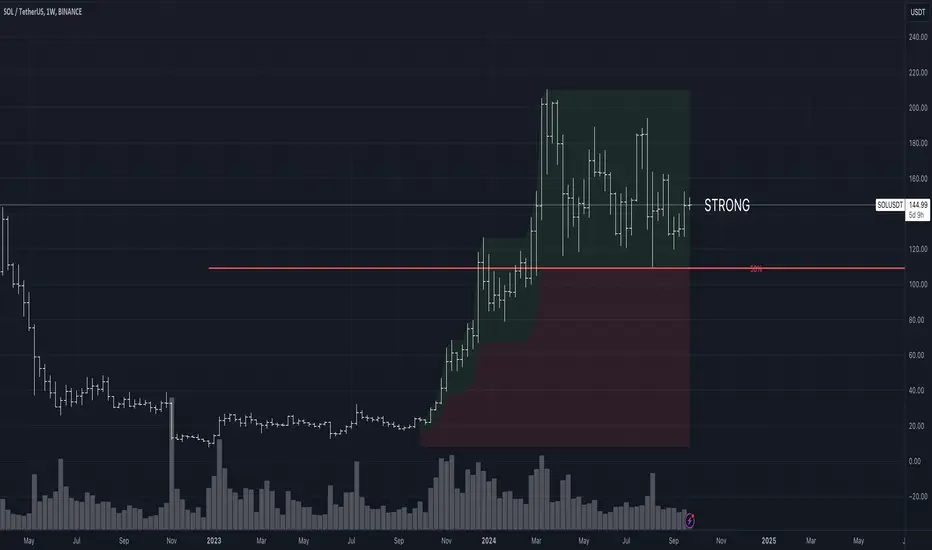
Strength/Weakness IndicatorThe Strength/Weakness Indicator is a customisable tool designed to help traders identify key areas of market strength and weakness based on the 50% Fibonacci retracement level .
█ Underlying Concept:
The concept behind this indicator draws heavily on the principles of Fibonacci retracement and WD Gann’s market theories , particularly the importance of the 50% level in signalling critical psychological areas of support and resistance. Historically, the 50% retracement level has been regarded as a key marker where markets either find new buyers/sellers or continue a trend. Gann himself placed significant emphasis on the halfway point of a previous market move as a critical level for market strength and reversal.
Strength : When an asset is trading above the 50% retracement level, it suggests that buyers are in control and that the market is showing strength. This is particularly useful for traders aiming to ride the continuation of an uptrend.
Weakness : Conversely, when the price falls below the 50% retracement level, it indicates that sellers are dominating, and the market is showing signs of weakness. This can be an early indication of a potential reversal or further decline.
█ Key Features:
1 — Multi-Timeframe Fibonacci Analysis :
This indicator supports up to two distinct retracement levels, allowing traders to analyse multiple timeframes simultaneously. Customise the look-back periods for each level to track the highest high and lowest low over your chosen period.
The tool is adaptable to short-term, swing trading, and long-term investing, making it useful across different trading styles.
2 — Dynamic Strength/Weakness Labelling :
The script dynamically calculates and displays whether the asset is “STRONG” or “WEAK” based on its position relative to the 50% retracement levels. If the price is above both levels, it is considered "VERY STRONG." Conversely, trading below both levels signals "VERY WEAK" conditions. This real-time feedback helps traders gauge market sentiment with ease.
3 — Customizable Visual Representation :
Both retracement levels are fully customisable, including line colours, styles, and thicknesses. The script offers custom background fills—highlighting areas of strength (green) and weakness (red)—to provide a clear visual aid for identifying key price zones.
Traders can modify the appearance of text labels (size, colour, position) and choose whether to extend lines left, right, both directions, or not at all.
4 — Cross-Timeframe Validation :
Traders can cross-reference price action between two timeframes to confirm trends. If both levels signal strength or weakness, it validates market momentum, increasing confidence in trade decisions.
5 — Strategic Decision-Making Aid :
The indicator aids in identifying support and resistance zones based on the 50% retracement level. Use it to time entries and exits effectively: price above the 50% level suggests potential trend continuation, while falling below may indicate reversal.
█ How It Works:
1 — Defining Custom Timeframes :
The trader selects custom time periods (days, weeks, months, or years) to calculate the highest high and lowest low, allowing precise control over the analysis.
2 — Calculating Strength/Weakness :
Once the 50% retracement level is calculated, the price’s position relative to it determines the market’s condition. Above 50% signals strength, below signals weakness.
3 — Comparing Multiple Timeframes :
Enable a second retracement level to compare different time periods. This feature is useful for spotting divergences between short-term and long-term trends or validating strength across timeframes.
█ How to Use:
1 — Assess Market Conditions :
If price trades above both 50% retracement levels, it indicates strong bullish momentum. Conversely, trading below both levels signals bearish conditions.
2 — Plan Entries/Exits :
Use the 50% level as a reference for support and resistance. Plan to enter when the price bounces off the 50% level, or exit if it breaks down below this critical level.
3 — Cross-Timeframe Analysis :
Validate the market trend by comparing retracement levels across different timeframes. This helps in confirming whether the trend is strong enough to justify holding a position.
█ Why This Indicator is Unique:
Comprehensive Multi-Timeframe Analysis : While most Fibonacci indicators focus on a single period, this tool provides a deeper understanding by allowing traders to compare price action across multiple timeframes.
Customizable and Dynamic : The real-time strength/weakness labeling, customizable background fills, and the ability to analyze two retracement levels simultaneously make this tool adaptable to any trading strategy.
Valuable for All Traders : Whether you are day trading, swing trading, or investing long-term, the Strength/Weakness Indicator offers clarity on key market levels and sentiment, improving decision-making for entries and exits.
Disclaimer : This script is for educational purposes and is not financial advice. Trading involves significant risk, so please consult a professional advisor before making investment decisions. For the best results, use this indicator alongside other technical analysis methods like trend lines or moving averages to help you confirm signals and make more informed decisions.
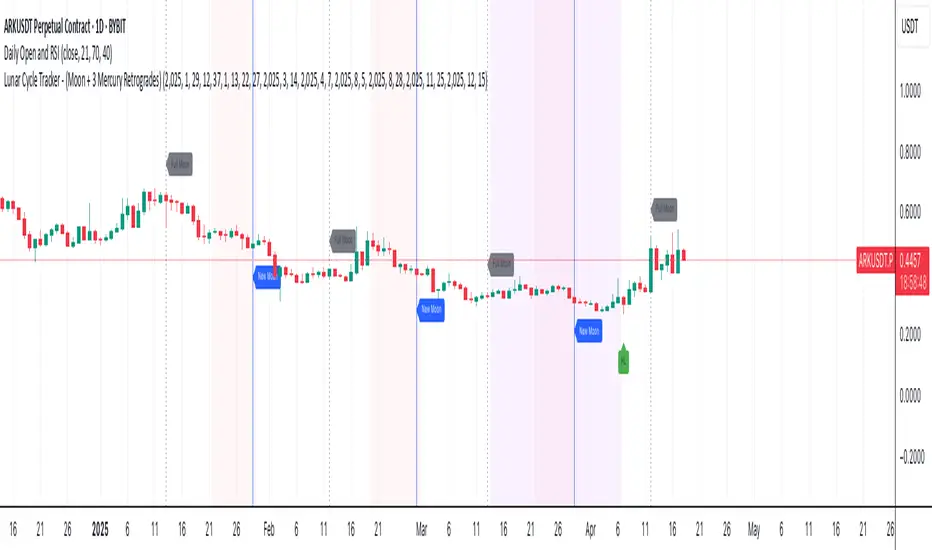
Lunar Cycle Tracker - (Moon + 3 Mercury Retrogrades)This script overlays the lunar and Mercury retrograde cycles directly onto your chart, helping traders visualize natural timing intervals that may influence market behavior.
Key Features:
🌑 New Moon & Full Moon Markers:
Vertical lines and labels indicate new and full moon events each month. You can fully customize their colors.
🌗 Last Quarter Moon Fill:
A soft pink background highlights the last quarter moon phase (from 7.4 days after the full moon to the next new moon).
🪐 Three Mercury Retrograde Zones:
Highlight up to three retrograde periods per year with customizable date inputs and background color. Great for spotting potential reversal or volatility windows.
Customization:
Moon event dates and colors
Manual input for Mercury retrograde periods (year, month, day)
Full compatibility with all timeframes (1H, 4H, daily, etc.)
Great for astro-cycle traders, Gann-based analysts, or anyone who respects time symmetry in the markets.
Fully customizable & works across all timeframes.
This tool was created by AngelArt as part of a larger astro-market model using lunar timing and planetary retrogrades for cycle-based market analysis.
5WMAs based on GANN numbers 5 13 49 73 198Plots 5 Weighted Moving Averages of 5 13 49 73 198 with source (High+Low+Close)/3
A Cross Appears when 13 WMA Crosses 49 WMA

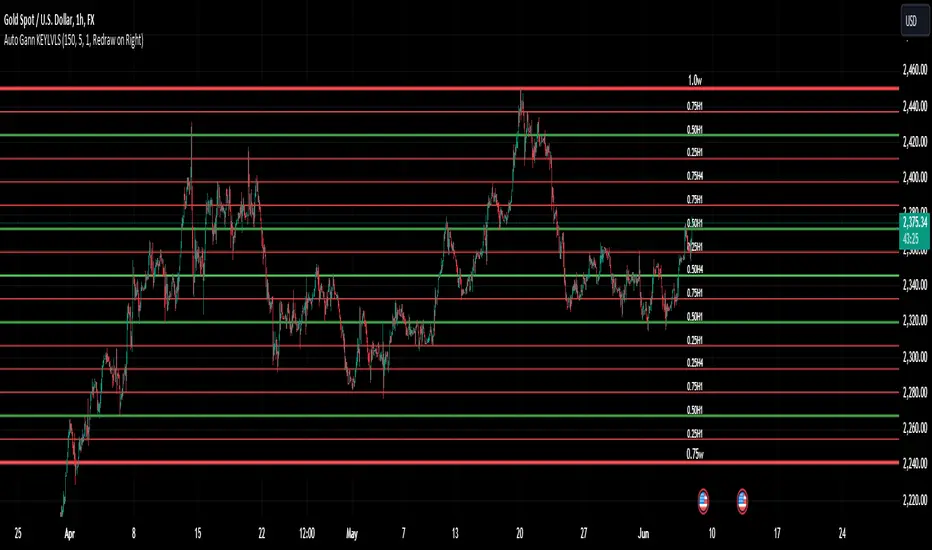
Auto Gann KEYLVLS "Auto Gann KEYLVLS" indicator can be a valuable tool for traders, especially those who employ Gann theory in their analysis. Here are some ways to effectively use this indicator:
Identifying Key Price Levels: Gann lines are known for their ability to identify key support and resistance levels. Use the plotted Gann lines to identify significant price levels where the market may react.
Confirmation of Trend Reversals: When price approaches a Gann line, observe how the price reacts. A bounce off a Gann line can confirm the continuation of the trend, while a break of a Gann line may indicate a potential trend reversal.
Entry and Exit Points: Gann lines can serve as entry and exit points for trades. Look for confluence between Gann lines and other technical indicators or patterns to identify high-probability trade setups.
Trading with the Trend: In an uptrend, consider buying opportunities near Gann support levels, while in a downtrend, look for selling opportunities near Gann resistance levels.
Risk Management: Use Gann lines to set stop-loss and take-profit levels. Place stop-loss orders below Gann support levels for long trades and above Gann resistance levels for short trades to manage risk effectively.
Timeframe Analysis: Utilize the flexibility of this indicator to plot Gann lines on different timeframes. Compare Gann lines across multiple timeframes to identify alignment or divergence, which can provide additional confirmation for trading decisions.
Combination with Other Indicators: Combine the information provided by Gann lines with other technical indicators, such as moving averages, RSI, or MACD, to strengthen your trading decisions.
Input Parameters:
The script defines several input parameters that control the behavior of the Gann lines, such as the number of weeks to look back for highs and lows, the number of Gann lines to plot, line extension settings, and options to show or hide specific Gann lines like .25, .37, .50, .63, and .75.
Auto Gann Functionality:
The script calculates the highest high and lowest low for the specified number of weeks, hours, and minutes.
It then calculates quartile levels (0.25, 0.50, 0.75) based on the weekly high and low.
Gann lines are drawn based on these levels, with options to extend them left and/or right.
Labels are added to the Gann lines indicating their values.
Weekly Gann Lines:
The script plots Gann lines and labels based on the weekly high and low levels.
Labels are added to these lines indicating their values.
Sub Gann Lines:
Additional Gann lines are plotted based on the weekly high and low levels, with subdivisions for lower timeframes like H4, H1, M15, and M1.
Label Management:
Labels are managed based on user preferences, including options to show labels once on the left side, redraw labels on the right side, or not show labels at all.
SCE GANN PredictionsThis is a script designed to give an insight on price direction from being above or below a GANN Value.
What Are GANN Waves?
The SCE GANN Predictions indicator is inspired by the work of W.D. Gann, a renowned trader who believed that price movements follow geometric and mathematical patterns. GANN waves use past price behavior—specifically momentum or "velocity"—to forecast where prices might head next.
How Does the Indicator Work?
Calculating Velocity
The script starts by measuring the "velocity" of price movement over a user-defined lookback period (denoted as n). This velocity is the average difference between the close and open prices over n bars. Think of it as the market’s speed in a given direction.
Predicting the Future Price
Using this velocity, the indicator estimates a future price after a specific time horizon—calculated as n + n*2 bars into the future (e.g., if n = 15, it predicts 45 bars ahead). It scales the velocity by a ratio (Gr) to determine the "end price." This is the raw GANN prediction.
Optimizing the Ratio (Gr)
The key to a good prediction is finding the right Gr. The script tests a range of Gr values (from Gr_min to Gr_max, stepping by Gr_step) and evaluates each one by calculating the sum of squared errors (SSE) between the predicted prices and the actual historical close prices. The Gr with the lowest SSE is deemed "optimal" and used for the final prediction.
Smoothing with an SMA
The raw GANN prediction is then smoothed using a simple moving average (SMA) over the lookback period (n). This SMA is plotted on your chart, serving as a dynamic trend line. The plot’s color changes based on the current price: teal if the close is above the SMA (bullish), and red if below (bearish).
Visuals
This example shows how the value explains price strength and changes color. When the price is above the line, and it’s green, we’re showing an up trend. The opposite is when the price is below the line, and it’s red, showing a down trend.
We can see that there may be moments where price drops under the value for just that one bar.
In scenarios with sideways price action, even though the price crosses, there is no follow through. This is a shortcoming of the overall concept.
Customizable Inputs
Timeframe: Choose the timeframe for analysis (default is 2 minutes).
Show GANN Wave: Toggle the GANN SMA plot on or off (default is true).
Lookback Period (Gn): Set the number of bars for velocity and SMA calculations (default is 15).
Min Ratio (Gr_min): The lower bound for the Gr optimization (default is 0.05).
Max Ratio (Gr_max): The upper bound for Gr (default is 0.2).
Step for Gr (Gr_step): The increment for testing Gr values (default is 0.01).
How to Use SCE GANN Predictions
Trend Direction
The colored SMA provides a quick visual cue. Teal suggests an uptrend, while red hints at a downtrend. Use this to align your trades with the broader momentum.
Crossover Signals
Watch for the close price crossing the GANN SMA. A move above could signal a buy opportunity, while a drop below might indicate a sell. Combine this with other indicators for confirmation.
Fine-Tuning
Experiment with the lookback period (Gn) and Gr range to optimize for your market. Shorter lookbacks might suit fast-moving assets, while longer ones could work for slower trends.
Like any technical tool, SCE GANN Predictions isn’t a crystal ball. It’s based on historical data and mathematical assumptions, so it won’t always be spot-on.

SW monthly Gann Days**Script Description:**
The script you are looking at is based on the work of W.D. Gann, a famous trader and market analyst in the early 20th century, known for his use of geometry, astrology, and numerology in market analysis. Gann believed that certain days in the market had significant importance, and he observed that markets often exhibited significant price moves around specific dates. These dates were typically associated with cyclical patterns in price movements, and Gann referred to these as "Gann Days."
In this script, we have focused on highlighting certain days of the month that Gann believed to have an influence on market behavior. The specific days in question are the **6th to 7th**, **9th to 10th**, **14th to 15th**, **19th to 20th**, **23rd to 24th**, and **29th to 31st** of each month. These ranges are based on Gann’s theory that there are recurring time cycles in the market that cause turning points or critical price movements to occur around certain days of the month.
### **Why Gann Used These Days:**
1. **Mathematical and Astrological Cycles:**
Gann believed that markets were influenced by natural cycles, and that certain dates (or combinations of dates) played a critical role in the price movements. These specific days are part of his broader theory of "time cycles" where the market would often change direction, reverse, or exhibit significant volatility on particular days. Gann's research was based on both mathematical principles and astrological observations, leading him to assign importance to these days.
2. **Gann's Universal Timing Theory:**
According to Gann, financial markets operate in a universe governed by geometric and astrological principles. These cycles repeat themselves over time, and specific days in a given month correspond to key turning points within these repeating cycles. Gann found that the 6th to 7th, 9th to 10th, 14th to 15th, 19th to 20th, 23rd to 24th, and 29th to 31st often marked significant changes in the market, making them particularly important for traders to watch.
3. **Market Psychology and Sentiment:**
These specific days likely correspond to key moments where market participants tend to react in predictable ways, influenced by past market behavior on similar dates. For example, news events or scheduled economic reports might fall within these time windows, causing the market to respond in a particular way. Gann's method involves using these cyclical patterns to predict turning points in market prices, enabling traders to anticipate when the market might make a reversal or face a significant shift in direction.
4. **Turning Points:**
Gann believed that markets often reversed or encountered critical points around specific dates. This is why he considered certain days more important than others. By identifying and focusing on these days, traders can better anticipate the market’s movement and make more informed trading decisions.
5. **Numerology:**
Gann also utilized numerology in his trading system, believing that numbers, and particularly certain key numbers, had significance in predicting market movements. The days selected in this script may correspond to numerological patterns that Gann identified in his analysis of the markets, such as recurring numbers in his astrological and geometric systems.
### **Purpose of the Script:**
This script highlights these "Gann Days" within a trading chart for 2024 and 2025. The color-coding or background highlighting is intended to draw attention to these dates, so traders can observe the potential for significant market movements during these times. By identifying these specific dates, traders following Gann's theories may gain insights into possible turning points, corrections, or key price movements based on the market's historical behavior around these days.
Overall, Gann’s use of specific days was based on his deep belief in the cyclical nature of the market and his attempt to tie those cycles to the natural laws of time, geometry, and astrology. By focusing on these dates, Gann aimed to give traders an edge in predicting significant market events and price shifts.

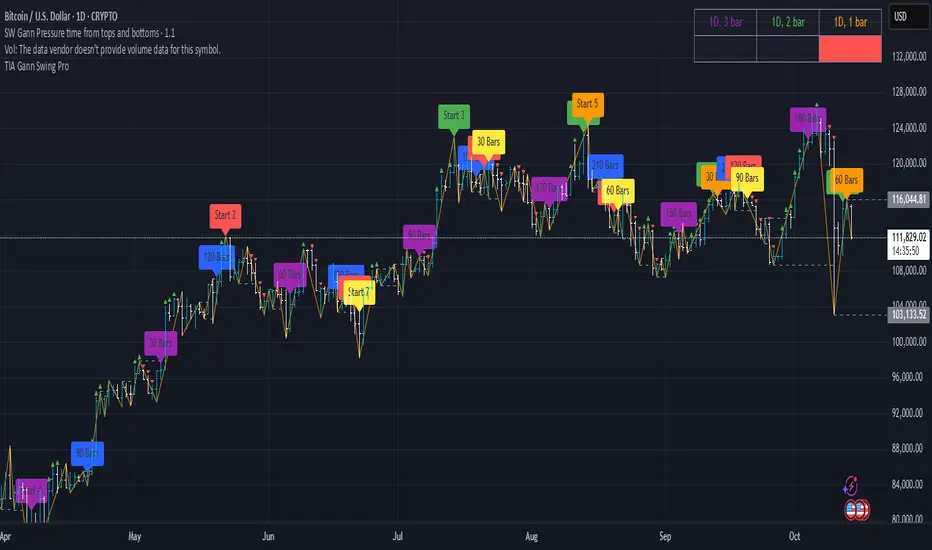
SW Gann Pressure time from tops and bottomsW.D. Gann's trading techniques often emphasized the significance of time in the markets, believing that specific time intervals could influence price movements. Here’s how the 30, 60, 90, 120, 180, and 270 bar intervals relate to Gann's rules:
1. **30 Bars**:
- Gann often viewed shorter time frames as critical for identifying short-term trends. A 30-bar interval can signify minor cycles or potential turning points in price.
2. **60 Bars**:
- This interval is significant as Gann believed in the importance of quarterly cycles. A 60-bar mark could indicate a completion of a two-month cycle, often leading to retracements or reversals.
3. **90 Bars**:
- Gann considered 90 days (or bars) to represent a quarter. This interval can signify a substantial shift in market sentiment or a pivotal point in a longer trend.
4. **120 Bars**:
- The 120-bar mark corresponds to about four months. Gann viewed longer intervals as more significant, often leading to major shifts in market trends.
5. **180 Bars**:
- A 180-bar period relates to a semi-annual cycle, which Gann regarded as critical for major support and resistance levels. Price action around this interval can reveal potential long-term trend reversals.
6. **270 Bars**:
- Gann believed that longer cycles, such as 270 bars (approximately nine months), could indicate significant market phases. This interval may represent major turning points and help identify long-term trends.
### Application in Trading:
- **Identifying Trends**: Traders can use these intervals to spot potential trend reversals or continuations based on Gann’s principles of market cycles.
- **Setting Targets and Stops**: Knowing where these key bars fall can help in setting profit targets and stop-loss orders.
- **Analyzing Market Sentiment**: Price reactions at these intervals can provide insights into market psychology and sentiment shifts.
By marking these intervals on a chart, traders can visually assess when price action aligns with Gann's theories, helping them make more informed trading decisions based on historical patterns and cycles.
Fair Value Gap Finder with Integrated Gann BoxTitle: Fair Value Gap Finder with Integrated Gann Box Analysis
Description:
The "Fair Value Gap Finder with Integrated Gann Box Analysis" is a unique technical indicator designed for traders who wish to incorporate the concepts of Fair Value Gaps (FVG) and Gann Box methodologies into their trading strategy. This tool is beneficial for both trend-following and scalping techniques across various markets and timeframes.
Functionality:
The indicator identifies Fair Value Gaps, which are areas on the chart where price has skipped a range, creating a 'gap'. Recognizing these zones can be crucial for understanding potential price support and resistance areas. Alongside FVG detection, this script employs Gann Box principles to project potential levels of interest. Gann Boxes are drawn automatically when an FVG is identified, providing additional insights based on W.D. Gann's theories, which relate to time and price symmetry.
Usage:
Upon detecting an FVG, the indicator will highlight the gap on the chart and overlay a Gann Box between the high and low points of the gap. Traders can use these zones to make informed decisions about entry and exit points, stop loss, and take profit levels. The script offers customization options for the appearance and behavior of the FVG boxes and Gann Lines, allowing users to adapt the tool to their preferences.
Originality:
What sets this indicator apart is the integration of FVG with Gann Box levels within a single tool, streamlining the analysis process. It takes the classic approach of identifying gaps and enriches it with the geometric significance of Gann's work, all while allowing users to visualize and interact with these levels in a user-friendly manner.
Open-Source Nature:
This script is open-source, making it a transparent solution for those who wish to understand the underlying calculations. While not all traders are versed in Pine Script, the logic of identifying FVGs and applying Gann Box levels is explained through the script's annotations and the user interface itself.
Instructions for Use:
Apply the script to your chart, and it will automatically detect FVGs.
Adjust the settings in the indicator's input menu to match your trading style and preferences.
Use the FVG and Gann Box levels as potential areas of interest for trade setups.
This script does not guarantee profits and should be used as part of a comprehensive trading plan. It is best used in conjunction with other analysis methods to confirm signals and strategies.

Wx Gann WindowsWx Gann Windows — Seasonal Time Windows & Forward Markers
Wx Gann Windows highlights the handful of Gann-style seasonal dates that matter most, without cluttering your chart. It draws subtle “time windows” around key dates each year and optionally projects the next 12 months of dates into the future so you can keep them in mind when planning trades or options spreads.
What it shows
1. Seasonal Windows (background bands)
• Equinox / Solstice windows (Spring, Summer, Autumn, Winter).
• Optional midpoint (cross-quarter) windows: early Feb / May / Aug / Nov.
• Each window is a small number of days (default 3) centered on the approximate calendar date, with a soft background band so price action remains in focus.
2. On-Chart Labels (optional)
• Small labels like “Spring Eq.”, “Winter Sol.”, “Feb Mid” printed just above the current chart’s price range.
• One label per window, on the first bar of the window.
3. Future Projections (next 12 months)
• For each key date, the script projects the next occurrence into the future.
• Draws a vertical dotted line from near the chart low to above the chart high, plus a label such as “Spring Eq. (next)” or “Aug Mid (next)”.
• This gives you a 12-month “time roadmap” for cycles-sensitive planning (e.g., options, swing trades) without manual date marking.
Inputs
Window Settings
• Equinox / Solstice Window (days) – size of the seasonal bands (default 3 days).
• Midpoint Window (days) – size of the mid-Feb / May / Aug / Nov bands.
Visibility
• Show Equinox & Solstice Windows – toggle main seasonal bands on/off.
• Show Midpoint Windows (Feb/May/Aug/Nov) – toggle cross-quarter bands.
• Show Labels (on windows) – show/hide the on-chart labels above price.
Future Projections
• Project Next 12 Months (future markers) – toggle the forward vertical lines + “(next)” labels.
How to use it
• Treat these dates as awareness windows, not prediction signals.
• Use them to:
• Be extra alert for potential turns, accelerations, or exhaustion.
• Tighten risk or avoid opening new positions right into a window if your system suggests caution.
• Plan options expiries or swing entries with time structure in mind.
Always confirm decisions with your own system (trend, structure, volume, breadth, macro), not the dates alone.
Notes & Disclaimer
• Dates are approximate calendar anchors inspired by Gann’s seasonal and cross-quarter work, using simple ±N-day windows.
• Works on any symbol and timeframe; windows are based on calendar dates, not bar count.
• This tool is educational and informational only. It does not place orders and is not financial advice. Always test and integrate with your own strategy and risk management.

Dynamic Stoch200+MACD+Gann Confluence (Cardinal + Ordinal)If you're scrolling through hundreds of indicators on TradingView looking for a reliable edge, here's why this one stands out and deserves a spot on your chart:Ultra-High-Conviction Reversal Signals (Rare but Powerful)
Most indicators spam signals and repaint. This one requires four independent confluences to fire:Hidden bullish/bearish divergences on a very long-period Stochastic (200) – catches major cycle turns, not noise.Matching hidden divergences on MACD histogram – confirms momentum shift.A strong directional candle (close in top/bottom 20% of range) – filters weak wicks.
Price within ~1.75% of a dynamic Gann Square of 9 level (cardinal + ordinal angles).
Because it demands all four at once, signals are extremely rare — often only a handful per year on daily/weekly timeframes. When they appear, they frequently mark significant tops and bottoms.Fully Adaptive Gann Levels (No Static Lines)
Unlike most Gann scripts with fixed levels that quickly become irrelevant, this one:Automatically anchors to the most recent significant pivot low or high.
Calculates authentic Square of 9 rotations (45°, 90°, 135°, 180°, 225°, 270°, 315°, 360°).
Updates dynamically as new swings form — works on any timeframe and any market (BTC, stocks, forex, indices).
Clean & Customizable Toggle cardinal (strong) vs ordinal (intermediate) levels for plotting and signal checks.
Adjustable pivot sensitivity and proximity tolerance.
Minimal chart clutter: bold lines for major levels, subtle for intermediates, plus clear large triangles for entries.
Best For
Swing traders and position traders seeking high-probability reversal zones rather than frequent scalps. Excellent for Bitcoin and volatile assets where geometric levels + extreme momentum divergences often align at cycle extremes.In short: If you want an indicator that stays quiet most of the time but screams when a real reversal is likely — this is it. Add it, watch the Gann levels adapt, and wait patiently for the rare multi-confluence setups. Quality over quantity.

DarkPool's Gann High Low Activator DarkPool's Gann High-Low Activator.
It enhances the traditional trend-following logic by integrating Heikin Ashi smoothing, Multi-Timeframe (MTF) analysis, and volatility filtering. It is designed to filter out market noise and provide clearer trend signals during volatile conditions.
Underlying Concepts
Heikin Ashi Smoothing: Standard price candles can produce erratic signals due to wicks and short-term volatility. This script includes a "Calculation Mode" setting that allows the Gann logic to run on Heikin Ashi average prices. This smoothes out price data, helping traders stay in trends longer by ignoring temporary pullbacks.
Gann High-Low Logic: The core algorithm tracks the Simple Moving Average (SMA) of Highs and Lows over a user-defined period.
Bullish Trend: Price closes above the trailing SMA of Highs.
Bearish Trend: Price closes below the trailing SMA of Lows.
Volatility & Trend Filtering: To reduce false signals during sideways markets, this tool employs two filters:
ADX Filter (Choppiness): Uses the Average Directional Index to detect low-volatility environments. If the ADX is below the defined threshold (default 20), the indicator identifies the market as "choppy" and suppresses signals to preserve capital.
EMA Filter (Baseline): An optional Exponential Moving Average filter ensures trades are only taken in the direction of the longer-term trend (e.g., Longs only above the 200 EMA).
Features
Dual Calculation Modes: Switch between Standard price logic and Heikin Ashi smoothing logic.
Multi-Timeframe (MTF): Calculate the trend based on a higher timeframe (e.g., 4-Hour) while viewing a lower timeframe chart (e.g., 15-Minute).
Automated JSON Alerts: Generates machine-readable JSON alert payloads compatible with external trading bots and webhooks.
Live Dashboard: A data table displaying the current Trend State, Calculation Mode, ADX Value, and risk percentage.
How to Use
Buy Signal: Generated when the trend flips Bullish, provided the ADX indicates sufficient momentum and the price satisfies the EMA filter (if enabled).
Sell Signal: Generated when the trend flips Bearish, subject to the same momentum and trend filters.
Neutral State (Gray Cloud): When the cloud fill turns gray, the market is in consolidation. It is recommended to avoid entering new positions during this state.
Trailing Stop: The Gann Line serves as a dynamic trailing stop-loss level. A close beyond this line invalidates the current trend.
Settings Configuration
Calculation Mode: Select "Standard" for raw price action or "Heikin Ashi" for smoothed trend following.
Gann Length: Lower values (3-5) are suitable for short-term scalping; higher values (10+) are better for swing trading.
MTF Mode: Enable to lock the calculation to a specific higher timeframe.
ADX Threshold: Adjust based on asset volatility. Recommended: 20-25 for Crypto, 15-20 for Forex/Indices.
Disclaimer
This source code and the information presented here are for educational purposes only. This script does not constitute financial advice, trading recommendations, or a solicitation to buy or sell any financial instruments. Trading in financial markets involves a high degree of risk and may not be suitable for all investors. Past performance is not indicative of future results. The author assumes no responsibility for any losses incurred while using this indicator. Use this tool at your own discretion and risk.

DCA Percent SignalOverview
The DCA Percent Signal Indicator generates buy and sell signals based on percentage drops from all-time highs and percentage gains from lowest lows since ATH. This indicator is designed for pyramiding strategies where each signal represents a configurable percentage of equity allocation.
Definitions
DCA (Dollar-Cost Averaging): An investment strategy where you invest a fixed amount at regular intervals, regardless of price fluctuations. This indicator generates signals for a DCA-style pyramiding approach.
Gann Bar Types: Classification system for price bars based on their relationship to the previous bar:
Up Bar: High > previous high AND low ≥ previous low
Down Bar: High ≤ previous high AND low < previous low
Inside Bar: High ≤ previous high AND low ≥ previous low
Outside Bar: High > previous high AND low < previous low
ATH (All-Time High): The highest price level reached during the entire chart period
ATL (All-Time Low): The lowest price level reached since the most recent ATH
Pyramiding: A trading strategy that adds to positions on favorable price movements
Look-Ahead Bias: Using future information that wouldn't be available in real-time trading
Default Properties
Signal Thresholds:
Buy Threshold: 10% (triggers every 10% drop from ATH)
Sell Threshold: 30% (triggers every 30% gain from lowest low since ATH)
Price Sources:
ATH Tracking: High (ATH detection)
ATL Tracking: Low (low detection)
Buy Signal Source: Low (buy signals)
Sell Signal Source: High (sell signals)
Filter Options:
Apply Gann Filter: False (disabled by default)
Buy Sets ATL: False (disabled by default)
Display Options:
Show Buy/Sell Signals: True
Show Reference Lines: True
Show Info Table: False
Show Bar Type: False
How It Works
Buy Signals: Trigger every 10% drop from the all-time highest price reached
Sell Signals: Trigger every 30% increase from the lowest low since the most recent all-time high
Smart Tracking: Uses configurable price sources for signal generation
Key Features
Configurable Thresholds: Adjustable buy/sell percentage thresholds (default: 10%/30%)
Separate Price Sources: Independent sources for ATH tracking, ATL tracking, and signal triggers
Configurable Signals: Uses low for buy signals and high for sell signals by default
Optional Gann Filter: Apply Gann bar analysis for additional signal filtering
Optional Buy Sets ATL: Option to set ATL reference point when buy signals occur
Visual Debug: Detailed labels showing signal parameters and values
Usage Instructions
Apply to Chart: Use on any timeframe (recommended: 1D or higher for better signal quality)
Risk Management: Adjust thresholds based on your risk tolerance and market volatility
Signal Analysis: Monitor debug labels for detailed signal information and validation
Signal Logic
Buy signals are blocked when ATH increases to prevent buying at peaks
Sell signals are blocked when ATL decreases to prevent selling at lows
This ensures signals only trigger on subsequent bars, not the same bar that establishes new reference points
Buy Signals:
Calculate drop percentage from ATH to buy signal source
Trigger when drop reaches threshold increments (10%, 20%, 30%, etc.)
Always blocked on ATH bars to prevent buying at peaks
Optional: Also blocked on up/outside bars when Gann filter enabled
Sell Signals:
Calculate gain percentage from lowest low to sell signal source
Trigger when gain reaches threshold increments (30%, 60%, 90%, etc.)
Always blocked when ATL decreases to prevent selling at lows
Optional: Also blocked on down bars when Gann filter enabled
Limitations
Designed for trending markets; may generate many signals in sideways/ranging markets
Requires sufficient price movement to be effective
Not suitable for scalping or very short timeframes
Implementation Notes
Signals use optimistic price sources (low for buys, high for sells), these can be configured to be more conservative
Gann filter provides additional signal filtering based on bar types
Debug information available in data window for real-time analysis
Detailed labels on each signal show ATH, lowest low, buy level, sell level, and drop/gain percentages

Universal Gann Square & Cube LevelsUniversal Gann Square & Cube Levels - Dynamic Support/Resistance
Description:
📊 UNIVERSAL GANN LEVELS INDICATOR
This powerful indicator automatically plots Gann Square and Cube levels around the current stock price, providing dynamic support and resistance levels based on W.D. Gann's mathematical theories.
🎯 KEY FEATURES:
✅ Auto-Adaptive: Works for ANY stock price (₹20 to ₹100,000+)
✅ Real-time Detection: Uses current close price automatically
✅ Dual Level System: Square levels (black) + Cube levels (red)
✅ Customizable Range: Adjust percentage range (5% to 50%)
✅ Clean Display: Toggle square/cube lines independently
✅ Universal Compatibility: Works on all timeframes and instruments
📈 HOW IT WORKS:
Square Levels (Black Lines): Based on perfect squares (n²) around current price
Cube Levels (Red Lines): Based on perfect cubes (n³) around current price
Smart Range: Automatically calculates relevant levels within your specified percentage range
Info Display: Shows current price and level counts
⚙️ SETTINGS:
Price Range %: Control how many levels appear (default: 15%)
Show Square Levels: Toggle black square lines on/off
Show Cube Levels: Toggle red cube lines on/off
🔥 PERFECT FOR:
Day traders seeking precise entry/exit points
Swing traders identifying key support/resistance zones
Gann theory practitioners and students
Multi-timeframe analysis across all instruments
💡 USAGE TIPS:
Use 10-20% range for active day trading
Use 30-50% range for swing trading analysis
Watch for price reactions at square/cube intersections
Combine with volume analysis for confirmation
🌟 WHY THIS INDICATOR?
Unlike fixed Gann calculators, this indicator dynamically adapts to ANY price level, making it truly universal for Indian stocks, crypto, forex, and commodities.
⚠️ DISCLAIMER:
This indicator is for educational and informational purposes only. It is not financial advice and should not be considered as a recommendation to buy or sell any security. Trading involves significant risk of loss and may not be suitable for all investors. Past performance does not guarantee future results. Always conduct your own research and consult with a qualified financial advisor before making any investment decisions. The developer assumes no responsibility for any trading losses incurred through the use of this indicator.
📋 COMPATIBILITY:
All TradingView plans
All timeframes (1m to 1M)
Stocks, Crypto, Forex, Commodities
Mobile and desktop platforms
