Kelt + BBand Combination (kingthies) █ Overview
The Kelt-BBand Combo is a trading approach that I've used for multiple years now, and works on any timeframe, chart possible. There are various versions of this approach published by myself and others who find value in measuring the deviations of price and strategize market entries and exits. For an entry-level description of each component, I'll type them up below.
█ Using This Indicator
While there are various strategies to use this tool, I'll share the one that has yielded me the most success across traditional and cryptocurrency markets - first understand the different appearances of both....
IF the bbands are inside the kelts, the squeeze is on. In 90% of cases this is often a bullish leaning event
IF the bbands are pinching (regardless of slope or kelt behavior),these are your primary support and resistances, respectively
When trending up, HA candles will touch between the upper kelt and upper bband on every candle, across all timeframes
When trending down, HA candles will touch between the lower kelt and lower bband on every candle, across all timeframes
If one timeframe is not giving clear indicator of trend direction or s/r to follow, zoom out. the higher timeframe will always win and show you the true direction
█ Intro to Bollinger Bands
Bollinger Bands consists of a center line representing the moving average of a security’s price over a certain period, and two additional parallel lines (called the trading bands) one of which is just the moving average plus k-times the standard deviation over the selected time frame, and the other being the moving average minus k-times the standard deviation over that same timeframe. This technique has been developed in the 1980’s by John Bollinger, who lately registered the terms “Bollinger Bands” as a U.S. trademark in 2011. Technical analysts typically use 20 periods and k = 2 as default settings to build Bollinger Bands, while they can choose a simple or exponential moving average. Bollinger Bands provide a relative definition of high and low prices of a security. When the security is trading within the upper band, the price is considered high, while it is considered low when the security is trading within the lower band.
There is no general consensus on the use of Bollinger Bands among traders. Some traders see a buy signal when the price hits the lower Bollinger Band and close their position when the price hits the moving average. Some others buy when the price crosses over the upper band and sell when the price crosses below the lower band. We can see here two opposing interpretations based on different rationales, depending whether we are in a reversal or continuation pattern. Another interesting feature of the Bollinger Bands is that they give an indication of the volatility levels; a widening gap between the upper and lower bands indicates an increasing volatility, while a narrowing band indicates a decreasing volatility. Moreover, when the bands have an almost flat slope (parallel to the x-axis) the price will generally oscillate between the bands as if trading through a channel.
█ Intro to Keltner Channels
Keltner Channels aka Kelts were first described by a Chicago grain trader called Chester W. Keltner in his 1960 book How to Make Money in Commodities. Though Keltner claimed no ownership of the original idea and simply called it the ten-day moving average trading rule, his name was applied by those who heard of this concept through his books.
Similarly to the Bollinger Bands, Keltner channel is a technical analysis tool based on three parallel lines. In fact, the Keltner indicator consists of a central moving average in addition to channel lines spread above and below it. The central line represents a 10-day simple moving average of what Chester W. Keltner called typical price. The typical price is defined as the average of the high, low and close. The distance between the central line and the upper, or lower line, is equivalent to the simple moving average of the preceding 10 days' trading ranges.
One way to interpret the Keltner Channel would be to consider the price breakouts outside of the channel. A trader would track price movement and consider any close above the upper line as a strong buy signal. Equivalently, any close below the lower line would be considered a strong sell signal. The trader would follow the trend emphasized by the indicator while complementing his analysis with the use of other indicators as well. However, the breakout method only works well when the market moves from a range-bound setting to an established trend. In a trend-less configuration, the Keltner Channel is better used as an overbought/oversold indicator. Thus, as the price breaks out below the lower band, a trader waits for the next close inside the Keltner Channel and considers this price behavior as an oversold situation indicating a potential buy signal. Similarly, as the price breaks out above the upper band, the trader waits for the next close inside the Keltner Channel and considers this price movement as an overbought situation indicating a potential sell signal. By waiting for the price to close within the Channel, the trader avoids getting caught in a real upside or downside breakout.
Happy Trading!
חפש סקריפטים עבור "ha溢价率"

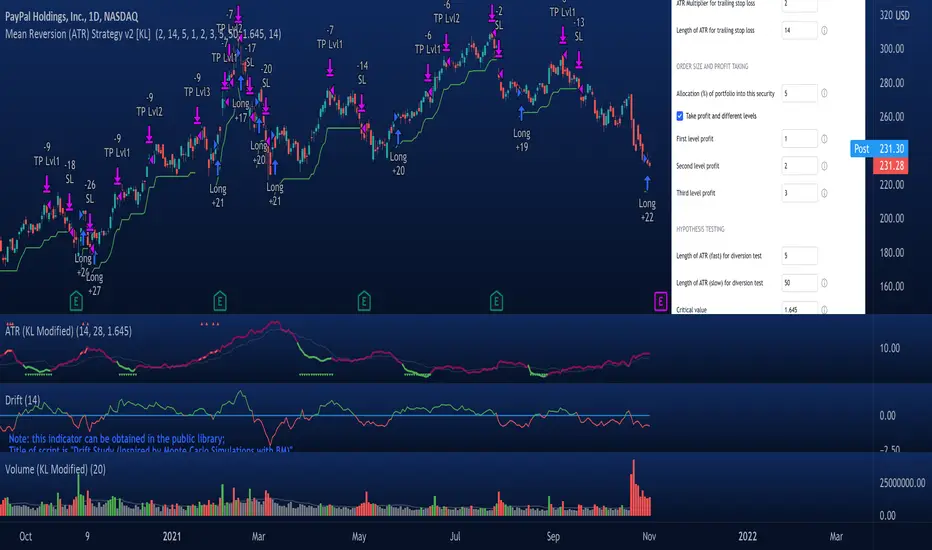
Mean Reversion Strategy v2 [KL]Description :
This strategy will enter a position when the following conditions are met:
a) Main signal: When source data (ATR) diverts from its moving average value, and
b) Confirmation: If predicted direction of trend is favorable.
Assumptions :
During periods of high price volatility, ATR diverts from its moving average value. Eventually, ATR should revert. But since just knowing the magnitude of increase/decrease of ATR does not indicate a trend signal, we need to introduce a model to predict the current trend.
In short:
• Trend Prediction : This strategy calculates the expected logarithmic return of the security (the "Drift") and considers prices to be moving in uptrend if the drift curve is upward sloping.
• Assessment of ATR diversion : To determine "yes/no" regarding whether ATR at a given point in time has diverted, this script conducts a two-tailed hypothesis test at each candlestick period. The null hypothesis (H0) is that the fast moving average value should equal the slow moving average value (say, denoted as H0: atr14 == atr28; it is assumed that atr28 is more meaningful for the purpose of describing the current trend because it has a larger sample size). Investopedia has an article summarizing this topic .
Exit Condition :
When trailing stop loss hits.
Previous version :
This strategy is based on Version 1 published back in September . This older version considers +/- one standard deviation to be the critical values relative to average ATR when testing whether ATR has diverted from the mean. This does not take Standard Error ("SE") into account. As a result, the threshold is often too wide and it generates too many entry signals.
CandleEvaluationLibrary "CandleEvaluation"
Contains functions to evaluate bullish and bearish, engulfing, and outsized candles. They are different from the built-in indicators from TradingView in that these functions don't evaluate classical patterns composed of multiple candles, and they reflect my own understanding of what is "bullish" and bearish", "engulfing", and "outsized".
isBullishBearishCandle()
Determines if the current candle is bullish or bearish according to the length of the wicks and the open and close.
int _barsBack How many bars back is the candle you want to evaluate. By default this is 0, i.e., the current bar.
returns Two values, true or false, for whether it's a bullish or bearish candle respectively.
isTripleBull()
Tells you whether a candle is a "Triple Bull" - that is, one which is bullish in three ways:
It closes higher than it opens
It closes higher than the body of the previous candle
The High is above the High of the previous candle.
int _barsBack How many bars back is the candle you want to evaluate. By default this is 0, i.e., the current bar.
returns True or false.
isTripleBear()
Tells you whether a candle is a "Triple Bear" - that is, one which is bearish in three ways:
It closes lower than it opens
It closes lower than the body of the previous candle
The Low is below the Low of the previous candle.
int _barsBack How many bars back is the candle you want to evaluate. By default this is 0, i.e., the current bar.
returns True or false.
isBigBody()
Tells you if the current candle has a larger than average body size.
int _length - The length of the sma to calculate the average
float _percent - The percentage of the average that the candle body has to be to count as "big". E.g. 100 means it has to be just larger than the average, 200 means it has to be twice as large.
returns True or false
isBullishEngulfing()
Tells you if the current candle is a bullish engulfing candle.
int _barsBack How many bars back is the candle you want to evaluate. By default this is 0, i.e., the current bar.
int _atrFraction The denominator for the ATR fraction, which is the small amount by which the open can be different from the previous close.
returns True or false
isBearishEngulfing()
Tells you if the current candle is a bearish engulfing candle.
int _barsBack How many bars back is the candle you want to evaluate. By default this is 0, i.e., the current bar.
int _atrFraction The denominator for the ATR fraction, which is the small amount by which the open can be different from the previous close.
returns True or false

Realtime 5D Profile [LucF]█ OVERVIEW
This indicator displays a realtime profile that can be configured to visualize five dimensions: volume, price, time, activity and age. For each price level in a bar or timeframe, you can display total or delta volume or ticks. The tick count measures activity on a level. The thickness of each level's line indicates its age, which helps you identify the most recent levels.
█ WARNING
The indicator only works in real time. Contrary to TradingView's line of volume profile indicators , it does not show anything on historical bars or closed markets, and it cannot display volume information if none exists for the data feed the chart is using. A realtime indicator such as this one only displays information accumulated while it is running on a chart. The information it calculates cannot be saved on charts, nor can it be recalculated from historical bars. If you refresh the chart, or the script must re-execute for some reason, as when you change inputs, the accumulated information will be lost.
Because "Realtime 5D Profile" requires time to accumulate information on the chart, it will be most useful to traders working on small timeframes who trade only one instrument and do not frequently change their chart's symbol or timeframe. Traders working on higher timeframes or constantly changing charts will be better served by TradingView's volume profiles. Before using this indicator, please see the "Limitations" section further down for other important information.
█ HOW TO USE IT
Load the indicator on an active chart (see here if you don't know how).
The default configuration displays:
• A double-sided volume profile showing at what price levels activity has occurred.
• The left side shows "down" volume, the right side shows "up" volume.
• The value corresponding to each level is displayed.
• The width of lines reflects their relative value.
• The thickness of lines reflects their age. Four thicknesses are used, with the thicker lines being the most recent.
• The total value of down/up values for the profile appears at the top.
To understand how to use profiles in your trading, please research the subject. Searches on "volume profile" or "market profile" will yield many useful results. I provide you with tools — I do not teach trading. To understand more about this indicator, read on. If you choose not to do so, please don't ask me to answer questions that are already answered here, nor to make videos; I don't.
█ CONCEPTS
Delta calculations
Volume is slotted in up or down slots depending on whether the price of each new chart update is higher or lower than the previous update's price. When price does not move between chart updates, the last known direction is used. In a perfect world, Pine scripts would have access to bid and ask levels, as this would allow us to know for sure if market orders are being filled on upticks (at the ask) or downticks (at the bid). Comparing the price of successive chart updates provides the most precise way to calculate volume delta on TradingView, but it is still a compromise. Order books are in constant movement; in some cases, order cancellations can cause sudden movements of both the bid and ask levels such that the next chart update can occur on an uptick at a lower price than the previous one (or vice versa). While this update's volume should be slotted in the up slot because a buy market order was filled, it will erroneously be slotted in the down slot because the price of the chart's update is lower than that of the previous one. Luckily, these conditions are relatively rare, so they should not adversely affect calculations.
Levels
A profile is a tool that displays information organized by price levels. You can select the maximum quantity of levels this indicator displays by using the script's "Levels" input. If the profile's height is small enough for level increments to be less than the symbol's tick size, a smaller quantity of levels is used until the profile's height grows sufficiently to allow your specified quantity of levels to be displayed. The exact position of levels is not tethered to the symbol's tick increments. Activity for one level is that which happens on either side of the level, halfway between its higher or lower levels. The lowest/highest levels in the profile thus appear higher/lower than the profile's low/high limits, which are determined by the lowest/highest points reached by price during the profile's life.
Level Values and Length
The profile's vertical structure is dynamic. As the profile's height changes with the price range, it is rebalanced and the price points of its levels may be recalculated. When this happens, past updates will be redistributed among the new profile's levels, and the level values may thus change. The new levels where updates are slotted will of course always be near past ones, but keep this fluidity in mind when watching level values evolve.
The profile's horizontal structure is also dynamic. The maximum length of level lines is controlled by the "Maximum line length" input value. This maximum length is always used for the largest level value in the profile, and the length of other levels is determined by their value relative to that maximum.
Updates vs Ticks
Strictly speaking, a tick is the record of a transaction between two parties. On TradingView, these are detected on seconds charts. On other charts, ticks are aggregated to form a chart update . I use the broader "update" term when it names both events. Note that, confusingly, tick is also used to name an instrument's minimal price increment.
Volume Quality
If you use volume, it's important to understand its nature and quality, as it varies with sectors and instruments. My Volume X-ray indicator is one way you can appraise the quality of an instrument's intraday volume.
█ FEATURES
Double-Sided Profiles
When you choose one of the first two configuration selections in the "Configuration" field's dropdown menu, you are asking the indicator to display a double-sided profile, i.e., where the down values appear on the left and the up ones on the right. In this mode, the formatting options in the top section of inputs apply to both sides of the profile.
Single-Sided Profiles
The six other selections down the "Configuration" field's dropdown menu select single-sided profiles, where one side aggregates the up/down values for either volume or ticks. In this mode, the formatting options in the top section of inputs apply to the left profile. The ones in the following "Right format" section apply to the right profile.
Calculation Mode
The "Calculation" input field allows the selection of one of two modes which applies to single-sided profiles only. Values can represent the simple total of volume or ticks at each level, or their delta. The mode has no effect when a double-sided profile is used because then, the total is represented by the sum of the left and right sides. Note that when totals are selected, all levels appear in the up color.
Age
The age of each level is always displayed as one of four line thicknesses. Thicker lines are used for the youngest levels. The age of levels is determined by averaging the times of the updates composing that level. When viewing double-sided profiles, the age of each side is calculated independently, which entails you can have a down level on the left side of the profile appear thinner than its corresponding up side level line on the right side because the updates composing the up side are more recent. When calculating the age of single-sided profiles, the age of the up/down values aggregated to calculate the side are averaged. Since they may be different, the averaged level ages will not be as responsive as when using a double-sided profile configuration, where the age of levels on each side is calculated independently and follows price action more closely. Moreover, when displaying two single-sided profiles (volume on one side and ticks on the other), the age of both sides will match because they are calculated from the same realtime updates.
Profile Resets
The profile can reset on timeframes or trend changes. The usual timeframe selections are available, including the chart's, in which case the profile will reset on each new chart bar. One of two trend detection logics can be used: Supertrend or the one used by LazyBear in his Weis Wave indicator . Settings for the trend logics are in the bottommost section of the inputs, where you can also control the display of trend changes and states. Note that the "Timeframe" field's setting also applies to the trend detection mechanism. Whatever the timeframe used for trend detection, its logic will not repaint.
Format
Formatting a profile for charts is often a challenge for traders, and this one is no exception. Varying zoom factors on your chart and the frequency of profile resets will require different profile formats. You can achieve a reasonable variety of effects by playing with the following input fields:
• "Resets on" controls how frequently new profiles are drawn. Spacing out profiles between bars can help make them more usable.
• "Levels" determines the maximum quantity of levels displayed.
• "Offset" allows you to shift the profile horizontally.
• "Profile size" affects the global size of the profile.
• Another "Size" field provides control over the size of the totals displayed above the profile.
• "Maximum line length" controls how far away from the center of the bar the lines will stretch left and right.
Colors
The color and brightness of levels and totals always allows you to determine the winning side between up and down values. On double-sided profiles, each side is always of one color, since the left side is down values and the right side, up values. However, the losing side is colored with half its brightness, so the emphasis is put on the winning side. When there is no winner, the toned-down version of each color is used for both sides. Single-sided profiles use the up and down colors in full brightness on the same side. Which one is used reflects the winning side.
Candles
The indicator can color candle bodies and borders independently. If you choose to do so, you may want to disable the chart's bars by using the eye icon near the symbol's name.
Tooltips
A tooltip showing the value of each level is available. If they do not appear when hovering over levels, select the indicator by clicking on its chart name. This should get the tooltips working.
Data Window
As usual, I provide key values in the Data Window, so you can track them. If you compare total realtime volumes for the profile and the built-in "Volume" indicator, you may see variations at some points. They are due to the different mechanisms running each program. In my experience, the values from the built-in don't always update as often as those of the profile, but they eventually catch up.
█ LIMITATIONS
• The levels do not appear exactly at the position they are calculated. They are positioned slightly lower than their actual price levels.
• Drawing a 20-level double-sided profile with totals requires 42 labels. The script will only display the last 500 labels,
so the number of levels you choose affects how many past profiles will remain visible.
• The script is quite taxing, which will sometimes make the chart's tab less responsive.
• When you first load the indicator on a chart, it will begin calculating from that moment; it will not take into account prior chart activity.
• If you let the script run long enough when using profile reset criteria that make profiles last for a long time, the script will eventually run out of memory,
as it will be tracking unmanageable amounts of chart updates. I don't know the exact quantity of updates that will cause this,
but the script can handle upwards of 60K updates per profile, which should last 1D except on the most active markets. You can follow the number of updates in the Data Window.
• The indicator's nature makes it more useful at very small timeframes, typically in the sub 15min realm.
• The Weis Wave trend detection used here has nothing to do with how David Weis detects trend changes.
LazyBear's version was a port of a port, so we are a few generations removed from the Weis technique, which uses reversals by a price unit.
I believe the version used here is useful nonetheless because it complements Supertrend rather well.
█ NOTES
The aggregated view that volume and tick profiles calculate for traders is a good example of one of the most useful things software can do for traders: look at things from a methodical, mathematical perspective, and present results in a meaningful way. Profiles are powerful because, if the volume data they use is of good enough quality, they tell us what levels are important for traders, regardless of the nature or rationality of the methods traders have used to determine those levels. Profiles don't care whether traders use the news, fundamentals, Fib numbers, pivots, or the phases of the moon to find "their" levels. They don't attempt to forecast or explain markets. They show us real stuff containing zero uncertainty, i.e., what HAS happened. I like this.
The indicator's "VPAA" chart name represents four of the five dimensions the indicator displays: volume, price, activity and age. The time dimension is implied by the fact it's a profile — and I couldn't find a proper place for a "T" in there )
I have not included alerts in the script. I may do so in the future.
For the moment, I have no plans to write a profile indicator that works on historical bars. TradingView's volume profiles already do that, and they run much faster than Pine versions could, so I don't see the point in spending efforts on a poor ersatz.
For Pine Coders
• The script uses labels that draw varying quantities of characters to break the limitation constraining other Pine plots/lines to bar boundaries.
• The code's structure was optimized for performance. When it was feasible, global arrays, "input" and other variables were used from functions,
sacrificing function readability and portability for speed. Code was also repeated in some places, to avoid the overhead of frequent function calls in high-traffic areas.
• I wrote my script using the revised recommendations in the Style Guide from the Pine v5 User Manual.
█ THANKS
• To Duyck for his function that sorts an array while keeping it in synch with another array.
The `sortTwoArrays()` function in my script is derived from the Pine Wizard 's code.
• To the one and only Maestro, RicardoSantos , the creative volcano who worked hard to write a function to produce fixed-width, figure space-padded numeric values.
A change in design made the function unnecessary in this script, but I am grateful to you nonetheless.
• To midtownskr8guy , another Pine Wizard who is also a wizard with colors. I use the colors from his Pine Color Magic and Chart Theme Simulator constantly.
• Finally, thanks to users of my earlier "Delta Volume" scripts. Comments and discussions with them encouraged me to persist in figuring out how to achieve what this indicator does.

Bagheri IG Ether v2In this version, the winning ratio has been decreased, but the Risk to Reward Ratio (RRR) has been set to be better than the previous version.
This is a technical trading strategy for Ethereum ( BINANCE:ETHUSDT ). We built and developed it on MetaEditor and optimized it with MetaTrader optimizer.
The main indicators are Donchian Channel, Oscillator of ROC , Bears Power, Balance of Power , and Simple Moving Average ( SMA ). Default values in the input panel are the best combination of these indicators, but you can change any of them and try it for better results.
Please notice that this strategy has been optimized on the 1-minute chart of Ethereum .
For each position, you can see the Take Profit (TP) and Stop Loss (SL) levels. Also, you can find the values of mentioned TP and SL in points from the input panel of the script.
Attention: The price of Ethereum has 2 decimal places.
Therefore, 3000 points for TP means 30 USDT for trading 1 BINANCE:ETHUSDT .

[KBCUSTOM] Histogramified Stochastic RSI The public and regular stoch RSI does not come with a histogram which makes it hard to tell the magnitude of any cross. This version comes with one enabled by default and with includes buy and sell triggers on specified crosses.
Buy & Sell Options:
KB Cross Factor: this is the minimum stochastic change between candles that needs to be exceeded in order to trigger a buy or sell signal. For instance, if the previous candle has a value of -20, and the next one has 10, then the factor should be 30 in order for it to trigger a signal.
KB Cross Threshold: in order to minimize bad signals due to weak trend, you can set the minimum stochastic value any candle should have for an order signal to trigger. For instance, say the stochastic has a good cross factor (i.e. 30) and is met, and the stochastic has a value of 10 but your cross threshold is set at 20, then the signal will not trigger unless it is actually 20 or higher.
Let me know how it works.
Cheers.

Trend Bounce [racer8]I discovered this mechanical trading system titled "This Algo Strategy Has Only 3 rules and 62% Win Rate".
I coded the trading system on Tradingview...and now I am introducing it to you guys.
I modified the system so that it has both buy & sell signals.
I've tested it repeatedly in different markets on TV including stocks, currency pairs, bitcoin, and commodities...and it works!
A buy signal is generated whenever the current close is below the previous 7-day low and the current close is above the 200 period moving average.
A sell signal is generated whenever the current close is above the previous 7-day high and the current close is below the 200 period moving average.
The system also has a 2-ATR stop loss which I coded.
This system is unique in that it has both trend-following and reversal elements in it.
The system trades short-term reversals while obeying the long-term trend.
Essentially, you are buying the dips of bullish trends! & selling at the peaks of bearish trends!
Enjoy ♡

Heikin Ashi Candle OverlayHello Friend,
This is a very simple script for fun to demonstrate the new ability to change the colors of attributes pertaining to the plotbar() and plotcandle() functions using series inputs.
For Heiken Ashi lovers, this script does several things. It gives you both bars and hollow candles with Heikin Ashi values - something TV does not currently support.
It also gives you the ability to see your favorite HA candles while on the main series plot. When viewing indicators in the "Heikin Ashi" candle setting on TradingView, the input values are "smoothed' with HA values. This skews the way your indicators behave as the OLHC are calculated averages. Only the regular candle settings will give your indicators "real close" etc.
By 'Muting' the main series bars by toggling the 👁 symbol next to your ticker id, it makes the normal candles invisible. You then overlay this script, which allows you to see the HA Candle of your choice, while not affecting the way your indicators behave.
You now have the best of 2 worlds. Smoothed behavior of price action to help visualize trends, and accurate indicator values derived from actual OLHC data.
Plus, something about hollow HA candles is just kind of clean and soothing isn't it?
Cheers,
Bjorgum
Hollow Setting:
Bars
Or just plain old regular, but on the main chart

Total Turnover Moving Average (TTMA)This is a special type of moving average that incorporates financial information into technical indicators.
CONCEPT:
Number of shares outstanding (NOSH) reflects the floating tickets available for trading in the market. This indicator aims to look at what price has the market transacted on average, given all the NOSH has been turned over.
In order to do this, the number of periods required for trading volume to add up to NOSH is determined. Then, a simple moving average of closing price is calculated based on the number of periods.
Put simply, TTMA is a variable MA indicator, which the parameter depends on trading volume and NOSH. Since every counter has varying NOSH, it also translates volume into liquidity. Given two counters of the same volume , the one with lower NOSH has higher liquidity.
USAGE:
Bullish: when prices are above TTMA
Bearish: when prices are below TTMA
CAVEAT:
Generally works well for mid-cap to large-cap stocks, but not volatile penny counters (just like how you will not use 2-day moving average!). Good as reference and should NOT be used standalone.

Realtime Delta Volume Action [LucF]█ OVERVIEW
This indicator displays on-chart, realtime, delta volume and delta ticks information for each bar. It aims to provide traders who trade price action on small timeframes with volume and tick information gathered as updates come in the chart's feed. It builds its own candles, which are optimized to display volume delta information. It only works in realtime.
█ WARNING
This script is intended for traders who can already profitably trade discretionary on small timeframes. The high cost in fees and the excitement of trading at small timeframes have ruined many newcomers to trading. While trading at small timeframes can work magic for adrenaline junkies in search of thrills rather than profits, I DO NOT recommend it to most traders. Only seasoned discretionary traders able to factor in the relatively high cost of such a trading practice can ever hope to take money out of markets in that type of environment, and I would venture they account for an infinitesimal percentage of traders. If you are a newcomer to trading, AVOID THIS TOOL AT ALL COSTS — unless you are interested in experimenting with the interpretation of volume delta combined with price action. No tool currently available on TradingView provides this type of close monitoring of volume delta information, but if you are not already trading small timeframes profitably, please do not let yourself become convinced that it is the missing piece you needed. Avoid becoming a sucker who only contributes by providing liquidity to markets.
The information calculated by the indicator cannot be saved on charts, nor can it be recalculated from historical bars.
If you refresh the chart or restart the script, the accumulated information will be lost.
█ FEATURES
Key values
The script displays the following key values:
• Above the bar: ticks delta (DT), the total ticks for the bar, the percentage of total ticks that DT represents (DT%)
• Below the bar: volume delta (DV), the total volume for the bar, the percentage of total volume that DV represents (DV%).
Candles
Candles are composed of four components:
1. A top shaped like this: ┴, and a bottom shaped like this: ┬ (picture a normal Japanese candle without a body outline; the values used are the same).
2. The candle bodies are filled with the bull/bear color representing the polarity of DV. The intensity of the body's color is determined by the DV% value.
When DV% is 100, the intensity of the fill is brightest. This plays well in interpreting the body colors, as the smaller, less significant DV% values will produce less vivid colors.
3. The bright-colored borders of the candle bodies occur on "strong bars", i.e., bars meeting the criteria selected in the script's inputs, which you can configure.
4. The POC line is a small horizontal line that appears to the left of the candle. It is the volume-weighted average of all price updates during the bar.
Calculations
This script monitors each realtime update of the chart's feed. It first determines if price has moved up or down since the last update. The polarity of the price change, in turn, determines the polarity of the volume and tick for that specific update. If price does not move between consecutive updates, then the last known polarity is used. Using this method, we can calculate a running volume delta and ticks delta for the bar, which becomes the bar's final delta values when the bar closes (you can inspect values of elapsed realtime bars in the Data Window or the indicator's values). Note that these values will all reset if the script re-executes because of a change in inputs or a chart refresh.
While this method of calculating is not perfect, it is by far the most precise way of calculating volume delta available on TradingView at the moment. Calculating more precise results would require scripts to have access to tick data from any chart timeframe. Charts at seconds timeframes do use exchange/broker ticks when the feeds you are using allow for it, and this indicator will run on them, but tick data is not yet available from higher timeframes. Also, note that the method used in this script is far superior to the intrabar inspection technique used on historical bars in my other "Delta Volume" indicators. This is because volume and ticks delta here are calculated from many more realtime updates than the available intrabars in history. Unfortunately, the calculation method used here cannot be used on historical bars, where intrabar inspection remains, in my opinion, the optimal method.
Inputs
The script's inputs provide many ways to personalize all the components: what is displayed, the colors used to display the information, and the marker conditions. Tooltips provide details for many of the inputs; I leave their exploration to you.
Markers
Markers provide a way for you to identify the points of interest of your choice on the chart. You control the set of conditions that trigger each of the five available markers.
You select conditions by entering, in the field for each marker, the number of each condition you want to include, separated by a comma. The conditions are:
1 — The bar's polarity is up/dn.
2 — `close` rises/falls ("rises" means it is higher than its value on the previous bar).
3 — DV's polarity is +/–.
4 — DV% rises (↕).
5 — POC rises/falls.
6 — The quantity of realtime updates rises (↕).
7 — DV > limit (You specify the limit in the inputs. Since DV can be +/–, DV– must be less than `–limit` for a short marker).
8 — DV% > limit (↕).
9 — DV+ rises for a long marker, DV– falls for a short.
10 — Consecutive DV+/DV– on two bars.
11 — Total volume rises (↕).
12 — DT's polarity is +/–.
13 — DT% rises (↕).
14 — DT+ rises for a long marker, DT– falls for a short.
Conditions showing the (↕) symbol do not have symmetrical states; they act more like filters. If you only include condition 4 in a marker's setup, for example, both long and short markers will trigger on bars where DV% rises. To trigger only long or short markers, you must add a condition providing directional differentiation, such as conditions 1 or 2. Accordingly, you would enter "1,4" or "2,4".
For a marker to trigger, ALL the conditions you specified for it must be met. Long markers appear on the chart as "Mx▲" signs under the values displayed below candles. Short markers display "Mx▼" over the number of updates displayed above candles. The marker's number will replace the "x" in "Mx▲". The script loads with five markers that will not trigger because no conditions are associated with them. To activate markers, you will need to select and enter the set of conditions you require for each one.
Alerts
You can configure alerts on this script. They will trigger whenever one of the configured markers triggers. Alerts do not repaint, so they trigger at the bar's close—which is also when the markers will appear.
█ HOW TO USE IT
As a rule, I do not prescribe expected use of my indicators, as traders have proved to be much more creative than me in using them. Additionally, I tend to think that if you expect detailed recommendations from me to be able to use my indicators, it's a sign you are in a precarious situation and should go back to the drawing board and master the necessary basics that will allow you to explore and decide for yourself if my indicators can be useful to you, and how you will use them. I will make an exception for this thing, as it presents fairly novel information. I will use simple logic to surmise potential uses, as contrary to most of my other indicators, I have NOT used this one to actually trade. Markets have a way of throwing wrenches in our seemingly bullet-proof rationalizing, so drive cautiously and please forgive me if the pointers I share here don't pan out.
The first thing to do is to disable your normal bars. You can do this by clicking on the eye icon that appears when you hover over the symbol's name in the upper-left corner of your chart.
The absolute value and polarity of DV mean little without perspective; that's why I include both total volume for the bar and the percentage that DV represents of that total volume. I interpret a low DV% value as indecision. If you share that opinion, you could, let's say, configure one of the markers on "DV% > 80%", for example (to do so you would enter "8" in the condition field of any marker, and "80" in the limit field for condition 8, below the marker conditions).
I also like to analyze price action on the bar with DV%. Small DV% values should often produce small candle bodies. If a small DV% value occurs on a bar with much movement and high volume, I'm thinking "tough battle with potential explosive power when one side wins". Conversely, large bodies with high DV% mean that large volume is breaching through multiple levels, or that nobody is suddenly willing to take the other side of a normal volume of trades.
I find the POC lines really interesting. First, they tell us the price point where the most significant action (taking into account both price occurrences AND volume) during the bar occurred. Second, they can be useful when compared against past values. Third, their color helps us in figuring out which ones are the most significant. Unsurprisingly, bunches of orange POCs tend to appear in consolidation zones, in pauses, and before reversals. It may be useful to often focus more on POC progression than on `close` values. This is not to say that OHLC values are not useful; looking, as is customary, for higher highs or lower lows, or for repeated tests of precise levels can of course still be useful. I do like how POCs add another dimension to chart readings.
What should you do with the ticks delta above bars? Old-time ticker tape readers paid attention to the sounds coming from it (the "ticker" moniker actually comes from the sound they made). They knew activity was picking up when the frequency of the "ticks" increased. My thinking is that the total number of ticks will help you in the same way, since increasing updates usually mean growing interest—and thus perhaps price movement, as increasing volatility or volume would lead us to surmise. Ticks delta can help you figure out when proportionally large, random orders come in from traders with other perspectives than the short-term price action you are typically working with when you use this tool. Just as volume delta, ticks delta are one more informational component that can help you confirm convergence when building your opinions on price action.
What are strong bars? They are an attempt to identify significance. They are like a default marker, except that instead of displaying "Mx▲/▼" below/above the bar, the candle's body is outlined in bright bull/bear color when one is detected. Strong bars require a respectable amount of conditions to be met (you can see and re-configure them in the inputs). Think of them as pushes rather than indications of an upcoming, strong and multi-bar move. Pushes do, for sure, often occur at the beginning of strong trends. You will often see a few strong bars occur at 2-3 bar intervals at the beginning or middle of trends. But they also tend to occur at tops/bottoms, which makes their interpretation problematic. Another pattern that you will see quite frequently is a final strong bar in the direction of the trend, followed a few bars later by another strong bar in the reverse direction. My summary analyses seemed to indicate these were perhaps good points where one could make a bet on an early, risky reversal entry.
The last piece of information displayed by the indicator is the color of the candle bodies. Three possible colors are used. Bull/bear is determined by the polarity of DV, but only when the bar's polarity matches that of DV. When it doesn't, the color is the divergence color (orange, by default). Whichever color is used for the body, its intensity is determined by the DV% value. Maximum intensity occurs when DV%=100, so the more significant DV% values generate more noticeable colors. Body colors can be useful when looking to confirm the convergence of other components. The visual effect this creates hopefully makes it easier to detect patterns on the chart.
One obvious methodology that comes to mind to trade with this tool would be to use another indicator like Technical Ratings at a higher timeframe to identify the larger context's trend, and then use this tool to identify entries for short-term trades in that direction.
█ NOTES AND RAMBLINGS
Instant Calculations
This indicator uses instant values calculated on the bar only. No moving averages or calculations involving historical periods are used. The only exception to this rule is in some of the marker conditions like "Two consecutive DV+ values", where information from the previous bar is used.
Trading Small vs Long Timeframes
I never trade discretionary at the 5sec–5min timeframes this indicator was designed to be used with; I trade discretionary at 1D, 1W and 1M timeframes, and let systems trade at smaller timeframes. The higher the timeframe you trade at, the fewer fees you will pay because you trade less and are not churning trading volume, as is inevitable at smaller timeframes. Trading at higher timeframes is also a good way to gain an instant edge on most of the trading crowd that has its nose to the ground and often tends to forget the big picture. It also makes for a much less demanding trading practice, where you have lots of time to research and build your long-term opinions on potential future outcomes. While the future is always uncertain, I believe trades riding on long-term trends have stronger underlying support from the reality outside markets.
To traders who will ask why I publish an indicator designed for small timeframes, let me say that my main purpose here is to showcase what can be done with Pine. I often see comments by coders who are obviously not aware of what Pine is capable of in 2021. Since its humble beginnings seven years ago, Pine has grown and become a serious programming language. TradingView's growing popularity and its ongoing commitment to keep Pine accessible to newcomers to programming is gradually making Pine more and more of a standard in indicator and strategy programming. The technical barriers to entry for traders interested in owning their trading practice by developing their personal tools to trade have never been so low. I am also publishing this script because I value volume delta information, and I present here what I think is an original way of analyzing it.
Performance
The script puts a heavy load on the Pine runtime and the charting engine. After running the script for a while, you will often notice your chart becoming less responsive, and your chart tab can take longer to activate when you go back to it after using other tabs. That is the reason I encourage you to set the number of historical values displayed on bars to the minimum that meets your needs. When your chart becomes less responsive because the script has been running on it for many hours, refreshing the browser tab will restart everything and bring the chart's speed back up. You will then lose the information displayed on elapsed bars.
Neutral Volume
This script represents a departure from the way I have previously calculated volume delta in my scripts. I used the notion of "neutral volume" when inspecting intrabar timeframes, for bars where price did not move. No longer. While this had little impact when using intrabar inspection because the minimum usable timeframe was 1min (where bars with zero movement are relatively infrequent), a more precise way was required to handle realtime updates, where multiple consecutive prices often have the same value. This will usually happen whenever orders are unable to move across the bid/ask levels, either because of slow action or because a large-volume bid/ask level is taking time to breach. In either case, the proper way to calculate the polarity of volume delta for those updates is to use the last known polarity, which is how I calculate now.
The Order Book
Without access to the order book's levels (the depth of market), we are limited to analyzing transactions that come in the TradingView feed for the chart. That does not mean the volume delta information calculated this way is irrelevant; on the contrary, much of the information calculated here is not available in trading consoles supplied by exchanges/brokers. Yet it's important to realize that without access to the order book, you are forfeiting the valuable information that can be gleaned from it. The order book's levels are always in movement, of course, and some of the information they contain is mere posturing, i.e., attempts to influence the behavior of other players in the market by traders/systems who will often remove their orders when price comes near their order levels. Nonetheless, the order book is an essential tool for serious traders operating at intraday timeframes. It can be used to time entries/exits, to explain the causes of particular price movements, to determine optimal stop levels, to get to know the traders/systems you are betting against (they tend to exhibit behavioral patterns only recognizable through the order book), etc. This tool in no way makes the order book less useful; I encourage all intraday traders to become familiar with it and avoid trading without one.

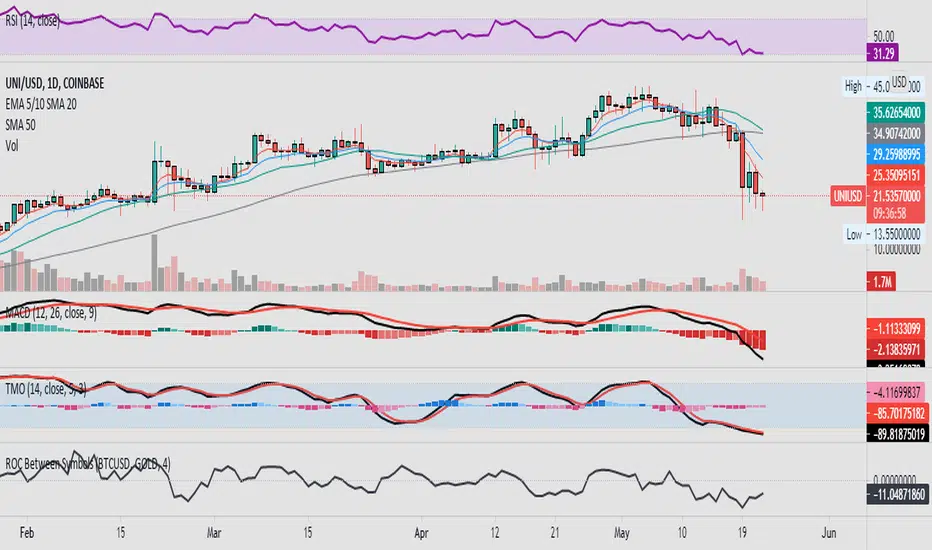
ROC Between SymbolsThis script is a simple Rate Of Change (ROC) closing price comparison between a "compare" symbol and a "base" symbol over a user-specified period (maximum 200).
When the ROC is greater than zero, >0 (positive), the compare symbol is increasing faster than the base symbol -- the compare symbol has positive comparative momentum. Of course, your compare symbol could be flat and your base symbol could be decreasing, but math-wise these scenarios are equivalent and the compare symbol has positive comparative momentum.
When the ROC is less than zero, <0 (negative), the compare symbol has negative comparative momentum. Again, the base symbol could be increasing and the compare symbol could be flat, but math-wise this is the same scenario and the compare symbol has negative comparative momentum.
This ROC comparison tactic was documented and described on YouTube channel "Figuring Out Money" in an interesting study between Bitcoin and Gold prices on a weekly timeframe.
Bollinger Band Width PercentileIntroducing the Bollinger Band Width Percentile
Definitions :
Bollinger Band Width Percentile is derived from the Bollinger Band Width indicator.
It shows the percentage of bars over a specified lookback period that the Bollinger Band Width was less than the current Bollinger Band Width.
Bollinger Band Width is derived from the Bollinger Bands® indicator.
It quantitatively measures the width between the Upper and Lower Bands of the Bollinger Bands.
Bollinger Bands® is a volatility-based indicator.
It consists of three lines which are plotted in relation to a security's price.
The Middle Line is typically a Simple Moving Average.
The Upper and Lower Bands are typically 2 standard deviations above, and below the SMA (Middle Line).
Volatility is a statistical measure of the dispersion of returns for a given security or market index, measured by the standard deviation of logarithmic returns.
The Broad Concept :
Quoting Tradingview specifically for commonly noted limitations of the BBW indicator which I have based this indicator on....
“ Bollinger Bands Width (BBW) outputs a Percentage Difference between the Upper Band and the Lower Band.
This value is used to define the narrowness of the bands.
What needs to be understood however is that a trader cannot simply look at the BBW value and determine if the Band is truly narrow or not.
The significance of an instruments relative narrowness changes depending on the instrument or security in question.
What is considered narrow for one security may not be for another.
What is considered narrow for one security may even change within the scope of the same security depending on the timeframe.
In order to accurately gauge the significance of a narrowing of the bands, a technical analyst will need to research past BBW fluctuations and price performance to increase trading accuracy. ”
Here I present the Bollinger Band Width Percentile as a refinement of the BBW to somewhat overcome the limitations cited above.
Much of the work researching past BBW fluctuations, and making relative comparisons is done naturally by calculating the Bollinger Band Width Percentile.
This calculation also means that it can be read in a similar fashion across assets, greatly simplifying the interpretation of it.
Plotted Components of the Bollinger Band Width Percentile indicator :
Scale High
Mid Line
Scale Low
BBWP plot
Moving Average 1
Moving Average 2
Extreme High Alert
Extreme Low Alert
Bollinger Band Width Percentile Properties:
BBWP Length
The time period to be used in calculating the Moving average which creates the Basis for the BBW component of the BBWP.
Basis Type
The type of moving average to be used as the Basis for the BBW component of the BBWP.
BBWP Lookback
The lookback period to be used in calculating the BBWP itself.
BBWP Plot settings
The BBWP plot settings give a choice between a user defined solid color, and a choice of "Blue Green Red", or "Blue Red" spectrum palettes.
Moving Averages
Has 2 Optional User definable and adjustable moving averages of the BBWP.
Visual Alerts
Optional User adjustable High and low Signal columns.
How to read the BBWP :
A BBWP read of 95 % ... means that the current BBW level is greater than 95% of the lookback period.
A BBWP read of 5 % .... means that the current BBW level is lower than 95% of the lookback period.
Proposed interpretations :
When the BBWP gets above 90 % and particularly when it hits 100% ... this can be a signal that volatility is reaching a maximum and that a macro High or Low is about to be set.
When the BBWP gets below 10 % and particularly when it hits 0% ...... this can be a signal that volatility is reaching a minimum and that there could be a violent range breakout into a trending move.
When the BBWP hits a low level < 5 % and then gets above its moving average ...... this can be an early signal that a consolidation phase is ending and a trending move is beginning.
When the BBWP hits a high level > 95 % and then falls below its moving average ... this can be an early signal that a trending move is ending and a consolidation phase is beginning.
Essential knowledge :
The BBWP was designed with the daily timeframe in mind, but technical analysists may find use for it on other time frames also.
High and Low BBWP readings do not entail any direction bias.
Deeper Concepts :
In finance, “mean reversion” is the assumption that a financial instrument's price will tend to move towards the average price over time.
If we apply that same logic to volatility as represented here by the Bollinger band width percentile, the assumption is that the Bollinger band width percentile will tend to contract from extreme highs, and expand from extreme lows over time corresponding to repeated phases of contraction and expansion of volatility.
It is clear that for most assets there are periods of directional trending behavior followed by periods of “consolidation” ( trading sideways in a range ).
This often ends with a tightening range under reducing volume and volatility ( popularly known as “the squeeze” ).
The squeeze typically ends with a “breakout” from the range characterized by a rapid increase in volume, and volatility when price action again trends directionally, and the cycle repeats.
Typical Use Cases :
The Bollinger Band Width Percentile may be especially useful for Options traders, as it can provide a bias for when Options are relatively expensive, or inexpensive from a Volatility (Vega) perspective.
When the Bollinger Band Width Percentile is relatively high ( 85 percentile or above ) it may be more advantageous to be a net seller of Vega.
When the Bollinger Band Width Percentile is relatively low ( 15 percentile or below ) it may be advantageous to be net long Vega.
Here we examine a number of actionable signals on BTCUSD daily timeframe using the BBWP and a momentum oscillator ( using the TSI here but can equally be used with Bollinger bands, moving averages, or the traders preferred momentum oscillator ).
In this first case we will examine how a spot trader and an options trader could each use a low BBWP read to alert them to a good potential trade setup.
note: using a period of 30 for both the Bollinger bands and the BBWP period ( approximately a month ) and a BBWP lookback of 350 ( approximately a year )
As we see the Bollinger Bands have gradually contracted while price action trended down and the BBWP also fell consistently while below its moving average ( denoting falling volatility ) down to an extremely low level <5% until it broke above its moving average along with a break of range to the upside ( signaling the end of the consolidation at a low level and the beginning of a new trending move to the upside with expanding volatility).
In this next case we will continue to follow the price action presuming that the traders have taken or locked in profit at reasonable take profit levels from the previous trade setup.
Here we see the contraction of the Bollinger bands, and the BBWP alongside price action breaking below the BB Basis giving a warning that the trending move to the upside is likely over.
We then see the BBWP rising and getting above its moving average while price action fails to get above the BB Basis, likewise the TSI fails to get above its signal line and actually crosses below its zeroline.
The trader would normally take this as a signal that the next trending move could be to the downside.
The next trending move turns out to be a dramatic downside move which causes the BBWP to hit 100% signaling that volatility is likely to hit a maximum giving good opportunities for profitable trades to the skilled trader as outlined.
Limitations :
Here we will look at 2 cases where blindly taking BBWP signals could cause the trader to take a failed trade.
In this first example we will look at blindly taking a low volatility options trade
Low Volatility and corresponding low BBWP levels do not automatically mean there has to be expansion immediately, these periods of extreme low volatility can go on for quite some time.
In this second example we will look at blindly taking a high volatility spot short trade
High volatility and corresponding high BBWP levels do not automatically mean there has to be a macro high and contraction of volatility immediately, these periods of extreme high volatility can also go on for quite some time, hence the famous saying "The trend is your friend until the end of the trend" and lesser well known, but equally valid saying "never try to short the top of a parabolic blow off top"
Markets are variable and past performance is no guarantee of future results, this is not financial advice, I am not a financial advisor.
Final thoughts
The BBWP is an improvement over the BBW in my opinion, and is a novel, and useful addition to a Technical Analysts toolkit.
It is not a standalone indicator and is meant to be used in conjunction with other tools for direction bias, and Good Risk Management to base sound trades off.
John Bollinger has suggested using Bolliger bands, and its related indicators with two or three other non-correlated indicators that provide more direct market signals.
He believes it is crucial to use indicators based on different types of data.
Some of his favored technical techniques are moving average divergence/convergence (MACD), on-balance volume and relative strength index (RSI).
Thanks
Massive respect to John Bollinger, long-time technician of the markets, and legendary creator of both the Bollinger Bands® in the 1980´s, and the Bollinger band Width indicator in 2010 which this indicator is based on.
His work continues to inspire, decades after he brought the original Bollinger Bands to the market.
Much respect also to Eric Crown who gave me the fundamental knowledge of Technical Analysis, and Options trading.

Lawyers Trend ProThis indicator basilcy has 2 sections
A. Lawyers Trend Pro
B. Lawyers Band
A. Lawyers Trend Pro
This indicator basicly using 2 different calculations average.
And you can see this average as line on this script.
This line has 2 functions
1. Buy and Sell Strategy
-İf the line colored BLUE this means you can BUY
-İf the line colored RED this means you can SELL
As you can see the picture you can buy and sell with this line
2. Support and Resistance Function
You can use the line as resistance and support.
B. Lawyer's Band
This indicator has 3 bands
1. Upper Band
2. Middle Band
3. Lower Band
1. Upper Band
Average of Moving Average of the Close (add Standard Deviations) and Highest price reached in the prior period
2. Middle Band
Average of upper and middle bands. And middle band also has BUY-SELL function. If middle band is blue you can BUY and if the middle band colored red you can SELL
3. Lower Band
Average of Moving Average of the Close(subtract Standard Deviations) and Lowest price reached in the prior period
Upper and Lower bands can be used for BUY&SELL strategy.
You can buy when price touches the lower band
You can sell when price touches the upper band
Indicator can work with long and short positions aswell
As you can see when price touches the lower band you can be LONG
and when the price touches the upper band you can be SHORT
When stock prices continually touch the upper Lawyers Band, the prices are thought to be overbought; conversely, when they continually touch the lower band, prices are thought to be oversold, triggering a buy signal. When using Lawyers Bands, designate the upper and lower bands as price targets.

Auto PitchFan, Fib Extension/Retracement and ZigZag by DGT Aᴜᴛᴏ PɪᴛᴄʜFᴀɴ, Fɪʙ Exᴛᴇɴꜱɪᴏɴ/Rᴇᴛʀᴀᴄᴇᴍᴇɴᴛ ᴀɴᴅ ZɪɢZᴀɢ
This study aim to automate PitchFan drawing tool and combines it with Fibonacci Extentions/Retracements and ZigZag.
Common setting options, applied to all components of the study
Deviation , is a multiplier that affects how much the price should deviate from the previous pivot in order for the bar to become a new pivot. Increasing its value is one way to get higher timeframe Levels
Depth , affects the minimum number of bars that will be taken into account when building
Historical PitchFan / Fibonacci Levels option will allow plotting of PitchFan / Fibonacci Levels on previous Pivot Highs/Lows
█ PɪᴛᴄʜFᴀɴ — is a set of rays spreading out of the point of a trend's beginning. These rays inclined with the coefficients formed by a Fibonacci number sequence. It is recommended to adjust the Pitchfan plottings to fit after the first wave of the trend has passed and the correction has clearly begun.
PitchFan rays corresponding to Fibonacci levels appear on a chart and represent inclined lines of support and resistance. Price areas near these rays are estimated areas from which the price can turn around or make a significant rebound. The whole logic of working with a pitchfan is based on one simple idea - if the price has bounced off the level, then the correction is likely to end, and the trend will continue. If the price has broken the first resistance, you should wait for the next level test
- Automatically plots PitchFan Rays, based on Pivot Lows/Highs.
- Ability to set ALERTs for each PitchFan Ray Level
- PitchFan Labels displays the price of the line at the last bar, the price value will be recalculated in each new bar
Please check the link provided below with the educational post of how to apply pitchfork, application of pitchfan is same keeping in mind the recommendation stated above
█ Fɪʙ Rᴇᴛʀᴀᴄᴇᴍᴇɴᴛs / Exᴛᴇɴꜱɪᴏɴꜱ
Fibonacci retracements is a popular instrument used by technical analysts to determine support and resistance areas. In technical analysis, this tool is created by taking two extreme points (usually a peak and a trough) on the chart and dividing the vertical distance by the key Fibonacci coefficients equal to 23.6%, 38.2%, 50%, 61.8%, and 100%.
Fibonacci extensions are a tool that traders can use to establish profit targets or estimate how far a price may travel AFTER a retracement/pullback is finished. Extension levels are also possible areas where the price may reverse.
IMPORTANT NOTE: Fibonacci extensions option may require to do further adjustment of the study parameters for proper usage. Extensions are aimed to be used when a trend is present and they aim to measure how far a price may travel AFTER a retracement/pullback. I will strongly suggest users of this study to check the education post for further details where to use extensions and where to use retracements
- Automatically plots possible Support and Resistance levels, based on Pivot Lows/Highs.
- Ability to set ALERTs for each Fibonacci Extension/Retracement Level
- Labels displays the level and the level price
█ Zɪɢ Zᴀɢ — The Zig Zag indicator is used to help identify price trends and changes in price trends. The Zig Zag indicator plots points on a chart whenever prices reverse by a percentage greater than a Deviation variable. Straight lines are then drawn, connecting these points. The Zig Zag indicator serves base for PitchFan and Fibonacci Retracements / Extensions
█ OTHER
PitchFan is often used in combination with the other indicators and/or drawing tools such as Fibonacci Retracement, Fibonacci Channels, Fibonacci Time Zone and others. It allows identify the most powerful areas from which price can turn and to get more accurate trading signal
Andrews’ Pitchfork, how to apply pitchfork and automated pitchfork study
Fibonacci Fans, how to apply fibonacci fans and automated fibonacci speed and resistance fans study
Fibonacci Extension / Retracement, where to use extensions and where to use retracements and automated fibonacci extension / retracement / pivot points study
Others
Fibonacci Channels, how to apply fibonacci channels and automated fibonacci channels study
Linear Regression Channels, , what linear regression channels are? and linear regression channel/curve/slope study
Disclaimer :
Trading success is all about following your trading strategy and the indicators should fit within your trading strategy, and not to be traded upon solely
The script is for informational and educational purposes only. Use of the script does not constitute professional and/or financial advice. You alone have the sole responsibility of evaluating the script output and risks associated with the use of the script. In exchange for using the script, you agree not to hold dgtrd TradingView user liable for any possible claim for damages arising from any decision you make based on use of the script

Chart Champions - Part 3 - SessionsThank you for sparing you time to read my indicator.
This indicator has been created as a suite of 3. This was to ensure that those with only the Free Trading View account could benefit (with their restriction to 3 indicators). Please ensure you install each indicator and read each indicator write up to fully understand what has tried to achieved.
Chart Champions – Part 1 –Lvls nPOC VWAPS
This indicator is broken down into:
• Levels
• VWAPS
• Naked Point of Control
Levels
It displays the levels to the right of the price Axis to enable the user to have a cleaner chart.
The below levels will automatically appear:
dOpen – pdHigh – pdLow – pdEQ – pwEQ
Optional Levels include:
mOpen – pmOpen – pdOpen – dbyOpen – wOpen – pwOpen
VWAPs
Optional VWAPs
Daily (including pdVWAP close) – Weekly – Monthly
Naked Points of Control (nPOC)
To view the nPOC move the chart back in time to pick up the nPOCs.
Chart Champions – Part 2 – CCV IBs POC
This indicator is broken down into:
• Chart Champions Value
• Initial Balance
• Points of Control
Chart Champions Value (CCV)
CCV is based on the 80% rule of the dOpen opening outside of the pdVAH/pdVAL. Please do you own research to fully understand how this trading strategy works (readily avaliable online).
Initial Balance (IB)
IB is based on the first 60 minutes of the market opening. It captures the highest and lowest points within that 60 minutes. Please do you own research to fully understand how this trading strategy works (readily avaliable online).
Points of Control (POCs)
POC are the price levels where the most volume was traded.
Developing POC (dPOC) will constantly move with volume/price action through out the day.
Optional POCs
Previous Day POC (pdPOC) – Day Before Yesterday POC (dbyPOC)
Chart Champions – Part 3 – Sessions - Manual Input
This indicator is broken down into:
• Manual Inputs (daily, weekly, monthly)
• IGOR SessionsTtimes
• Pre + Market Openings
Manual Input
Daily x3
Weekly x 3
Monthly x 3
This allows the trader to put in specific levels.
IGOR Session Times
This is a user specific requirement to highlight cetain times during the day, displayed at the bottom of the chart in the colour strip.
Pre + Market Openings
This allows the user to see when pre market trading has started and with the live maket has started, displayed at the top of the chart in colours.
A huge thank you goes out to:
Stackoverflow users AnyDozer and Bjorn.
TV user ahancock for allow me use of this code.
Disclaimer the lower the timeframe the more information it processes.

Chart Champions - Part 2 - CCV IBs POCsThank you for sparing you time to read my indicator.
This indicator has been created as a suite of 3. This was to ensure that those with only the Free Trading View account could benefit (with their restriction to 3 indicators). Please ensure you install each indicator and read each indicator write up to fully understand what has tried to achieved.
Chart Champions – Part 1 –Lvls nPOC VWAPS
This indicator is broken down into:
• Levels
• VWAPS
• Naked Point of Control
Levels
It displays the levels to the right of the price Axis to enable the user to have a cleaner chart.
The below levels will automatically appear:
dOpen – pdHigh – pdLow – pdEQ – pwEQ
Optional Levels include:
mOpen – pmOpen – pdOpen – dbyOpen – wOpen – pwOpen
VWAPs
Optional VWAPs
Daily (including pdVWAP close) – Weekly – Monthly
Naked Points of Control (nPOC)
To view the nPOC move the chart back in time to pick up the nPOCs.
Chart Champions – Part 2 – CCV IBs POC
This indicator is broken down into:
• Chart Champions Value
• Initial Balance
• Points of Control
Chart Champions Value (CCV)
CCV is based on the 80% rule of the dOpen opening outside of the pdVAH/pdVAL. Please do you own research to fully understand how this trading strategy works (readily avaliable online).
Initial Balance (IB)
IB is based on the first 60 minutes of the market opening. It captures the highest and lowest points within that 60 minutes. Please do you own research to fully understand how this trading strategy works (readily avaliable online).
Points of Control (POCs)
POC are the price levels where the most volume was traded.
Developing POC (dPOC) will constantly move with volume/price action through out the day.
Optional POCs
Previous Day POC (pdPOC) – Day Before Yesterday POC (dbyPOC)
Chart Champions – Part 3 – Sessions - Manual Input
This indicator is broken down into:
• Manual Inputs (daily, weekly, monthly)
• IGOR SessionsTtimes
• Pre + Market Openings
Manual Input
Daily x3
Weekly x 3
Monthly x 3
This allows the trader to put in specific levels.
IGOR Session Times
This is a user specific requirement to highlight cetain times during the day, displayed at the bottom of the chart in the colour strip.
Pre + Market Openings
This allows the user to see when pre market trading has started and with the live maket has started, displayed at the top of the chart in colours.
A huge thank you goes out to:
Stackoverflow users AnyDozer and Bjorn.
TV user ahancock for allow me use of this code.
Disclaimer the lower the timeframe the more information it processes.
Chart Champions - Part 1 - nPOC - Levels - VWAPsThank you for sparing you time to read my indicator.
This indicator has been created as a suite of 3. This was to ensure that those with only the Free Trading View account could benefit (with their restriction to 3 indicators). Please ensure you install each indicator and read each indicator write up to fully understand what has tried to achieved.
Chart Champions – Part 1 –Lvls nPOC VWAPS
This indicator is broken down into:
• Levels
• VWAPS
• Naked Point of Control
Levels
It displays the levels to the right of the price Axis to enable the user to have a cleaner chart.
The below levels will automatically appear:
dOpen – pdHigh – pdLow – pdEQ – pwEQ
Optional Levels include:
mOpen – pmOpen – pdOpen – dbyOpen – wOpen – pwOpen
VWAPs
Optional VWAPs
Daily (including pdVWAP close) – Weekly – Monthly
Naked Points of Control (nPOC)
To view the nPOC move the chart back in time to pick up the nPOCs.
Chart Champions – Part 2 – CCV IBs POC
This indicator is broken down into:
• Chart Champions Value
• Initial Balance
• Points of Control
Chart Champions Value (CCV)
CCV is based on the 80% rule of the dOpen opening outside of the pdVAH/pdVAL. Please do you own research to fully understand how this trading strategy works (readily avaliable online).
Initial Balance (IB)
IB is based on the first 60 minutes of the market opening. It captures the highest and lowest points within that 60 minutes. Please do you own research to fully understand how this trading strategy works (readily avaliable online).
Points of Control (POCs)
POC are the price levels where the most volume was traded.
Developing POC (dPOC) will constantly move with volume/price action through out the day.
Optional POCs
Previous Day POC (pdPOC) – Day Before Yesterday POC (dbyPOC)
Chart Champions – Part 3 – Sessions - Manual Input
This indicator is broken down into:
• Manual Inputs (daily, weekly, monthly)
• IGOR SessionsTtimes
• Pre + Market Openings
Manual Input
Daily x3
Weekly x 3
Monthly x 3
This allows the trader to put in specific levels.
IGOR Session Times
This is a user specific requirement to highlight cetain times during the day, displayed at the bottom of the chart in the colour strip.
Pre + Market Openings
This allows the user to see when pre market trading has started and with the live maket has started, displayed at the top of the chart in colours.
A huge thank you goes out to:
Stackoverflow users AnyDozer and Bjorn.
TV user ahancock for allow me use of this code.
Disclaimer the lower the timeframe the more information it processes.

34ema trend channelFirst of all, thanks to the first designer of this indicator, I just made some modifications to this favorite indicator.Please forgive me for my limited English!
First of all, I would like to say that the modification of King EMA index has given me a new trading experience. Four moving averages can be used for indicators, but I only used two because I think two are enough. These two moving averages are 34ema's high and low, which form a trend channel. When this channel runs downward, it is short trend; when the channel runs upward, it is long trend; when the channel runs horizontally, it is shock trend.
In fact, let's explain the presentation of AUD chart on the left。
1sell is the beginning of the downward trend. When we see the beginning of the trend, the shape of the K-line is a 4-hour downward trend, so we need to observe whether there is a short opportunity when the price rebounds to 2sell. The second is 3Sell and 4sell. They all have one thing in common, that is, they all have one or two k-lines falling and breaking a new low. At this point, when we go to observe the moving average channel, we find that it has become a short trend.
When the card short trend, we need to do is to follow the market to trade. Sell at high prices. When the price does not reach a new low after 6sell, we should be alert because the low point is rising. When 1buy breaks through 6sell, the high point needs to pay attention to whether the trend has changed,
So how to confirm whether the trend has changed from short to long? We can see that when 2buy stepped back on the moving average channel, there was a buying reaction, which is a good confirmation signal. And 2buy-5buy are all low points rising. When 6buy appears, the price rises rapidly and becomes a bigger bull market. That's the power of trends. Specific operation I can explain in Chinese, foreign friends hope to be able to translate and understand.
Now let's talk about how to set indicators.
After opening the indicators, we can see that the first line to the fourth line is the display and hiding of the moving average. I only choose to check direction and dragging direction, which are the channel moving average. They are also the more useful moving average channels for large-scale trend trading.
Then comes the volatility zone, which is the choice of colors in the moving average channel. You can choose the color you like. So what I see in the chart is that I only checked the three options of direction lagging direction vvolatility zone, and set their colors.
首先我想说的是感谢这个指标最初的设计者提供了源码,我只是针对指标的修改,使我获得了一种新的交易体验。指标是可以使用4条均线的,但我其实只用了两条,因为我觉得两条就够用了。这两条均线就是34EMA的HIGH和LOW,这两条均线组成了一条趋势渠道,当这条通道向下运行时为空头趋势,当通道向上运行时为多头趋势,当通道横向运行时为震荡趋势。
其实,我们对于左侧AUD图表的演示作一个解释:
1SELL为下跌趋势的开始,当我们看到趋势开始时K线的形态是4小时的大阴线向下跌,所以我们需要观察价格在反弹到2SELL的时候是否有做空机会。其次是3SELL和4SELL 它们都有一个共同点,就是全部都是1根或两根K线就向下跌,并且破了新的低点。此时我们再去观察均线通道时,发现它已经成为了空头趋势。
当牌空头趋势时,我们需要做的就是跟随市场去交易。逢高卖出。而当6SELL之后价格没有创新低时,我们就应该产生警觉,因为低点在抬高,而当1BUY突破6SELL时,高点在抬高时就需要注意趋势是否已经转变,
那么如何确认趋势是否已经由空头转为多头呢?我们可以看到2BUY时回踩到均线通道时出现了买盘反应,这种反应就是比较好的确认信号。并且2buy-5buy都是低点在抬升,当出现6BUY时,价格又快速拉升成为一个更大的牛市。这就是趋势的威力。具体操作我可以用中文解释,国外的朋友希望可以翻译理解。
下面我们先来说一下指标如何设置。
打开指标之后我们可以看到第一行至第四行是均线的显示与隐藏,而我只选择勾选Direction和lagging direction 这两条就是通道均线,也是大级别趋势交易较为好用的均线通道。
然后就是Volatility zone这是对于均线通道内颜色的选择。这个大家可以随意选择自己喜欢的颜色。所以图表中看到的就是我只勾选了DIRECTION LAGGING DIRECTION VVOLATILITY ZONE这三个选择,并对其颜色进行了设置。
下面我用中文好好来说一下我对这指标的一些使用心得:
1,当通道表现为空头趋势时,只能选择逢高卖出。利用价格回到通道边缘或内部的时候进行买出,止损在通道上方。
2、当价格向上突破通道时,选择空头止损离场,然后等待多头的入场机会。
3、当价格突破下跌的通道时,价格回踩到通道上沿时选择止跌买入。预期后面的多头趋势,但上破通道有一个硬性的要求就是必须突破最近的下跌趋势拐点,形成更高的高点。
4、随着时间的演变,趋势从下跌演变成上涨时,并且低点在抬高,高点也在抬高时,为明显多头趋势,此时只适合逢低买入。
5、什么算低点呢?就是当价格跌到通道上沿或通道里面时可以选择买进。
6、如果价格向下跌破趋势通道但快速收回通道时不算有效跌破,因为必须两根同色K线收盘在下方时才算跌破趋势通道,否则我都认为是主力机构在制作空头陷阱。
所以当你看到一根PINBAR或者是刺透双K线时都算是假破位诱空。
然后是右图上方的XAU 4H错误示例,因为趋势下破了低点,但同时也上破了高点,所以趋势是不明显的,即使从图中可以看到是震荡下跌行情,但均线最怕的就是震荡行情,不管是震荡上升还是横向又或者是下跌,都是不灵的。
所以当大级别左侧为下跌行情时,不要被小级别的反弹趋势通道短期向上就觉得应该考虑做多,其实我们更应该顺势而为。
尽管做为后知后觉者,我们也能吃到趋势的中间部分,不会在场外看着不敢入场。
那么趋势通道做XAU真的就不行吗?答案不是的,只是因为你选择的周期不对,用均线做交易有一个诀窍就是图表周期总有一个适合通道的,如果4小时是震荡下跌,那小时就会更加明显,所以只有选择通道适合的周期才能事半功倍,而不是用通道去选择合适的行情。
当然,用均线通道去做单边的行情是最好不过,但不要忘记,行情走势有70%的时间都是震荡的,只有30%的时间是单边的。
所以如果我们把XAU切换成为小时级别的走势时,你会发现,趋势当通道处于空头排列时,逢高卖出并不是不可以。同是也能看到多空转换时的回踩动作,就比如AUD 4H 和XAU 1H图表在多空转换的时候都有异曲同工之妙,市场绝大多数多空转换的时候就是这样子的。

Muqwishi Volumetric CandleIntroduction
Have you ever heard that each candle represents a battle between bulls (buyer) and bears (seller)? If you know the answer, apparently you understand what the price action means. What if I ask you, how much was bloody in each battle between bulls and bears?!. This indicator may give a clear picture of how to identify the candle’s strength by implementing the Standard Deviation on volume and reshape the candle.
The Muqwishi Volumetric Candles indicator works to weigh each candle instantaneously and updates its color level from lightness to darkness based on the rate of the volumetric standard deviation.
Here’s how the idea started with the conceptual design, then improved till achieved to the implemented design of a structured candle.
The conceptual design mentioned for reviewing how the idea started. However, I want you to understand the “implemented design” in which the indicator has been built to address it. As I stated structurally for the implemented design section, wick and border are identified by the user through “Chart Properties” unlike core and body is measured by the indicator.
The candle’s body is ”Dynamic” that colored based on the amount of volume standard deviation in which the low volume standard deviation is a lighter candle’s color and the high volume standard deviation is a darker candle’s color. The core is “Static” color represents zero volume standard deviation which the volume at the average level. In the case where the core is darker than the body means the volume standard deviation is lower than the average volume level, and when the core is lighter than the body mean the volume standard deviation is higher than the average volume level, and when the core’s color has the same body’s color means the volume is in the average level. The image is the best guide to understand the idea.
Rarely seeing a volume standard deviation below -2σ, even though the volume is apparently dead. However, it’s possible to see more than 3.9σ, and mostly it has the same effect as 3.9σ. Personally, any candle above 1.5σ is taking my attention, and more than 2σ I look around seeking for reasons to not take a trade.
§§ Note, if you have misunderstood the standard deviation concept, there are many great sources to understand it such as Wikipedia, YouTube,... etc. In a basic example, How much is your height relative to the height of average people in your city!!?. Similarly, how much is the amount of volume relative to the average volume of a number series of previous bars?!.
Indicator Overview
Before I get into this section, this is NOT meant to be an educational or recommendation. Just showing you how I use this indicator based on an experience.
The chart above has been remarked as an example of how I apply it. Again, it’s a personal preference, and it doesn’t mean this’s an efficient way.
Indicator Setting
➤ Ensure to visualize the indicator to the front for recognition of the candle’s core.
For more information check the image: drive.google.com
➤ Indicator’s title.
Generates two outputs. The first one is the coordinate location for the char “Core”, don’t pay attention to it. The second one colored in blue is referring to the measurement of the volume standard deviation as your cursor point move at any candle on the chart. For more information check the image: drive.google.com
➤ Indicator’s inputs.
■ Length: Number of previous bars covered in the calculation. Prefer between 14-20.
■ Long Candle Color: Choose a color for bullish candles.
■ Short Candle Color: Choose a color for bearish candles.
■ Color Mode: Kinda color style.
● Lightness: From lightness to darkness colored as low volume SD to high volume SD.
● Saturation: From narrow range to wide range colored as low volume SD to high volume SD.
■ Reverse Mode: Yes → Darkness to Lightness colored as low SD to high SD.
■ Show Core: No → Hide cores.
Summarize
■ Users should have a fundamental knowledge of Standard Deviation.
■ The candle’s body is dynamic colored. Got light as low volume standard deviation, and Dark as high volume standard deviation occurred.
■ The Candle’s core is static colored. Represents the average volume which Standard Deviation equals zero.
■ This’s not a trading signal. It works to visualize the level of transactions made per candle.
Final Comments
■ My goal was to achieve the conceptual design, but there’re many obstacles that go beyond the coding ability.
■ Let me know if you have any questions, comments, and any improvements to the project.
■ I hope every time you found this indicator useful and scaled up your trading skills, please present support through PayPal that linked in the signature box below. That will help to get me excited and post many ideas.
■ Trade Safe. ✌
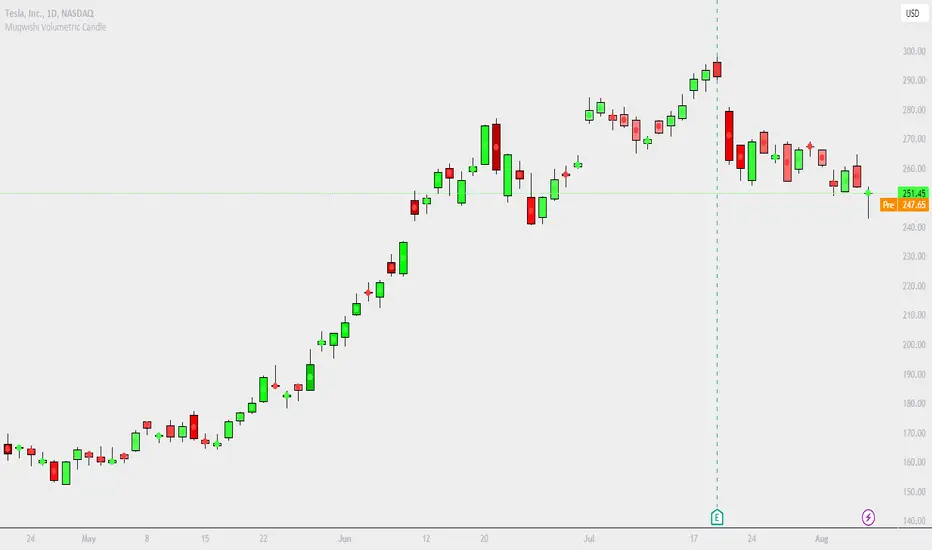
Modified Smoothed Heiken AshiThis code is based on Smoothed HA candle which will work on all chart types
condition for BUY:
1. When close crosses Smoothed HA
2.Close should be in side upper band
3.BBW must be greater than the average
vice versa for sell
this code takes data from HA chart so that it can be applied on all chart type.
Bollinger band and Bollinger band width conditions added for removal of unwanted signals
Alert added so that you can apply alert and check it in real time performance
thanks to The Secret Mindset You tube channel from where I got the idea to convert this into a pine script indicator
smooth HA taken from "Smoothed Heiken Ashi Candles v1" at //@jackvmk

|AG| VWAP ANALYSIS|AG| VWAP ANALYSIS
The volume-weighted average price (VWAP) is a trading benchmark used by traders that gives the average price security has traded throughout the day, based on both volume and price.
It is important because it provides traders with insight into both the trend and value of the security.
VWAP is calculated by adding up the $ traded for every transaction (price multiplied by the number of shares traded) and then dividing by the total shares traded.
A detailed formula and calculations could be found here:
-> fanf2.user.srcf.net
Actually, TradingView has an option for Anchored Vwap is a really good implementation for specific analysis.
The following script takes into account the #Time_Period_Change and plots the VWAP calculation.
The #Time_Period Available for this script are:
-> Day
-> Week
-> Monthly
-> Quarter
-> Year
1. The option that we have is the SOURCE:
-> HLC3 (High, Low, Close)/3 is the right way to calculate VWAP.
-> But I included other traditional options:
-> open, high, low, close, hl2, hlc3, ohlc4
2. The option of Turn ON/OFF VWAP
-> Timeframe selection:
-> All, 1. Day, 2. Week, 3. Month, 4. Quarter, 5. Year, 6. >=Weekly, 7. >=Montlhy
-> With this, we could select the time for plotting the VWAP. And some cool features such as >= that we are going to plot different Timeframes VWAP calculations.
-> Vwap Label:
-> We could select if show labels or not
3. The option of Turn ON/OFF Previous VWAP Level
-> VWAP of one selected Time Period is going to end with a final price this level most of the time is retested and gives us a good opportunity for entry into one trade.
Or could be used as Stop Loss.
-> Timeframe selection:
-> 1. Day, 2. Week, 3. Month, 4. Quarter, 5. Year, 6. >=Weekly, 7. >=Montlhy, 8. >=Daily
-> Factor
-> The factor options lead as increment the extension of the previous time period.
-> Example: D is the normal time period and with factor, we change from 1D to 2D in order to extend previous levels of VWAP.
->The Factor option is only available in 1. Day and 2. Week. With a Min Value of 1 and a Maximum Value of 50.
-> Labels:
-> We could select if show labels or not
4. The option of Turn ON/OFF Standard Deviation Bands
-> Label:
-> We could select if show labels or not
-> Timeframe selection:
-> 1. Day, 2. Week, 3. Month, 4. Quarter, 5. Year
5. The option of Turn ON/OFF Previous Standard Deviation
-> Timeframe selection:
-> None, 1. Day, 2. Week, 3. Month, 4. Quarter, 5. Year, 6. >=Weekly, 7. >=Montlhy, 8. Quarter & Year
-> STDEV LEVEL
-> Since there are different options for Standard Deviation I included 4 options
-> 1
-> 2
-> 3
-> User Selection
-> In this option we could select any NUMBER for STVDEV 0.25 of step.
-> Label:
-> We could select if show labels or not
6. The Lockback Setting
-> This Script also includes an option to only plot a certain amount of days back.
The main reason in order to have a more clear chart.
-> We could select between:
-> PLOT ALL
-> CUSTOM
-> If we select Custom Then we could select the Number of Days Back that is going to be plotted.
7. Color Theme
Here we select the color (Visual Desing)
-> Color Theme
-> Text Color
-> Here I use the recent input.color option added for TradingView making the color selection really simple
8. Time Period Highlighter
-> In this option, we could select one time period in order to plot one tiny background and identify the change in the time period.
-> Timeframe selection:
-> 1. Day, 2. Week, 3. Month, 4. Quarter, 5. Year
9. Label Offset
-> Finally, this option leads us to change the position of the labels into the X-axis by default 20.
This script has many options the combinations and the possibilities of making different analyses are bast.
Here some examples of what we could make:
DEFAULT SETTING:
PREVIOUS VWAP FOR TIME PERIOD >= WEEK
(work good as S&D levels)
PREVIOUS VWAP Week WITH A FACTOR OF 4
STANDARD DEVIATION BANDS - DAY
STANDARD DEVIATION BANDS - WEEK
STANDARD DEVIATION BANDS - MONTH
STANDARD DEVIATION BANDS - QUARTER
STANDARD DEVIATION BANDS - YEAR
PREVIOUS STANDARD DEVIATION - DAY SDTV 3
PREVIOUS STANDARD DEVIATION - WEEK SDTV 3
USING STANDARD DEVIATION BANDS - WEEK
WITH LOCKBACK -> PLOT ALL
WITH CUSTOM 30 DAYS
I think the options possibilities of analysis using #VWAP are truly awesome.
I like the relationship that one previous VWAP has with Standard Pivot Points.
Good Luck,
Anderson,

Trend ChannelMarket engineers can use channels to find out when a market has entered an undervalued or overvalued zone. Purchases and sales take place in these zones. Professionals use trending channels to find out when the market has overtaken itself and where it is likely to reverse.
Upper channel line = EMA + EMA x channel coefficient
Lower channel line = EMA - EMA x channel coefficient
The topline reflects the bulls' strength in raising prices above the average value consensus. This line marks the normal limit of optimism in the market.
The bottom line of the channel reflects the strength of the bears pushing prices below the average consensus of values. This line marks the normal limit of pessimism in the market.
The coefficient is used to correct the distance to the moving average until the channel contains 95% of all prices. Only the tips and the lowest bottoms are allowed to protrude. For these peaks and curves and sideways trends, I have added two more switchable lines to the border lines, with a distance of 23.6% (light blue).
The larger the time frame, the wider the channel.
If you buy near a rising moving average, you take profits near the upper line of the channel.
If you are short near a falling moving average, you should close out near the bottom of the channel.
If the moving average is essentially flat, then you should be long on the bottom of the channel and short on the top of the channel. You realize profits when the prices have returned to their moving average to normal.
Interesting for day traders:
Adjust the moving average so that it has the same slope as the quotes on the hourly chart. With the coefficient you set the distance between the border lines. Perhaps adding the 23.6% lines will help, where the sideways trends are starting. Set the resolution to "1 hour". If you want to trade with these settings in short time units, e.g. in the 3 minute chart or in the 1 minute chart, then you now have target marks and indications in which direction the prices will possibly move when the prices have reached the moving average or one of the border lines.
The text contains excerpts from "Come into my Trading Room" by Dr. Alexander Elder.
The indicator has an additional exponential moving average with adjustable period, adjustable shift and adjustable source for the narrow range of quotations and final determination of direction.
The chart shows how the trend channel and the Fibonacc trading indicator can complement each other.
The text contains excerpts from "Come into my Trading Room" by Dr. Alexander Elder.
Markttechniker können Kanäle verwenden um heraus zu finden, wann ein Markt eine unterbewertete oder überbewertete Zone erreicht hat. An diesen Zonen finden Käufe und Verkäufe statt. Profis benutzen Trendkanäle um herauszufinden, wann der Markt sich selbst überholt hat und wo er wahrscheinlich eine Umkehrbewegung vollziehen wird.
Obere Kanallinie = EMA + EMA x Kanalkoeffizient
Untere Kanallinie = EMA - EMA x Kanalkoeffizient
Die Oberlinie reflektiert die Kraft der Bullen, mit der sie die Kurse über den durchschnittlichen Wertekonsens anheben. Diese Linie kennzeichnet die normale Grenze des Optimismus im Markt.
Die untere Linie des Kanals reflektiert die Kraft der Bären, mit der sie die Kurse unter den durchschnittlichen Wertekonsens drücken. Diese Linie kennzeichnet die normale Grenze des Pessimismus im Markt.
Mit dem Koeffizienten wird der Abstand zum gleitenden Durchschnitt so lange korrigiert, bis der Kanal 95% aller Kurse enthält. Lediglich die Spitzen und die niedrigsten Böden dürfen herausragen. Für diese Spitzen und Bögen und Seitwärtstrends habe ich zu den Grenzlinien zwei weitere zuschaltbare Linien, mit einem Abstand von 23,6%, hinzugefügt (hellblau).
Je größer der Zeitrahmen ist, um so breiter ist der Kanal.
Wenn Sie in der Nähe eines ansteigenden gleitenden Durchschnitts kaufen, nehmen Sie die Gewinne in der Nähe der oberen Grenzlinie des Kanals mit.
Wenn Sie in der Nähe eines fallenden gleitenden Durchschnitts leerverkaufen, sollten Sie in der Nähe der unteren Grenzlinie des Kanals glattstellen.
Wenn der gleitende Durchschnitt im Wesentlichen flach ist, dann sollten Sie an der unteren Kanalbegrenzung eine Long-Position und an der oberen Kanalbegrenzung eine Short-Position einnehmen. Gewinne realisieren Sie jeweils, wenn die Kurse zu ihrem gleitenden Durchschnitt, zur Normalität zurückgekehrt sind.
Für Daytrader interessant:
Stellen Sie den gleitenden Durchschnitt so ein, dass er die gleiche Steigung wie die Notierungen im Stunden-Chart hat. Mit dem Koeffizienten Stellen Sie den Abstand der Grenzlinien ein. Vielleicht hilft die Zuschaltung der 23,6%-Linien, wo die Seitwärtstrends anstoßen. Stellen Sie die Auflösung auf „1 Stunde“. Wenn Sie mit diesen Einstellungen in niedrigen Zeiteinheiten traden wollen, z.B. im 3 Minuten-Chart oder im 1 Minuten-Chart, dann haben Sie jetzt Zielmarken und Hinweise in welche Richtung die Notierungen möglicherweise laufen werden, wenn die Notierungen den gleitenden Durchschnitt oder eine der Grenzlinien erreicht haben.
Der Text enthält Auszüge aus „Come into my Trading Room“ von Dr. Alexander Elder.
Der Indikator besitzt zur engen Umfang der Notierungen und endgültigen Richtungsbestimmung einen zusätzlichen exponentiellen gleitenden Durchschnitt mit einstellbarer Periode, einstellbarer Verschiebung und einstellbarer Quelle.
Der Chart zeigt wie sich Trendkanal und Fibonacc-Trading-Indikator ergänzen könne.
Der Text enthält Auszüge aus „Come into my Trading Room“ von Dr . Alexander Elder.

Excellent ADXThe Average Directional movement indeX (ADX) is an indicator that helps you determine the trend direction, pivot points, and much more else! But it looks not so easy as other famous indicators. It seems strange or even terrible, but don't be afraid. Let's understand how it works and get its power into your analysis tactics.
In the beginning, imagine a drunk man goes through a ladder: step by step. Up, up, down, up, down, down, up...
How can we understand which direction he goes? Exactly! We can count the number of steps in each direction. In the above example, in the upward – 4, in the downward – 3. So, it looks like he goes in an upward direction.
The ADX indicator counts the same steps, but for price. The size of each step equals 1 ATR for "DI Length" candles. On the indicator chart, we have the green and red lines. The green line represents a number of steps upward. The red line shows one downward. When the red line upper green, then the price goes below, then the trend is directed down. Later the green line comes above the red one, and then the trend changes the direction to upward. Wow? After that, you can easy detect the trend direction on the market!
But it is still not the end. On the chart, we also have the fat blue line. This is the ADX line, and it represents the power of the trend. It is calculated from a distance between the green and red curves. The ADX line value grows if the distance is increased. If the movement is really powerful, then a number of steps into a direction much more prominent than one in an opposed direction. Then the blue line grows faster. But if the growth has stopped and the blue line turns back or already had changed self-direction, then it is a signal that the trend has ended too. It's an excellent sign to close the position (but not always). Easy? Not quite. Thresholds help you there. The indicator has two additional parameters: upper and lower thresholds to evaluate the trend-over signal strength. An u-turn of the ADX line above the upper threshold sends a strong signal. If one occurs between both thresholds, it is a bit weak signal. But if the blue line goes below the lower threshold, it looks like there is no trend, and the price goes side. We can also say that the price goes side when the ADX value gradually falls down.
The Excellent ADX indicator helps you catch pivot/pullback signals based on green, red, and blue lines. Each such signal is highlighted as a green (buy) or red (sell) dot on the plot. The size of the dot represents the strength of the signal. You can also check the position of green and red lines from each other to determine the trend direction and the place where it has been changed. The Excellent ADX indicator helps you there too. It highlights the trend direction by the background-color, so you'll never miss it! The Excellent ADX good compliance with the Price Channel indicator built for the same length. You can use them together to be on a trend wave always!
